
This Week in Crypto, Full Written Summary: W4 March 2026

Is the Market Ready to Turn? What Social Dominance and Whale Silence Tell Us
Executive Summary
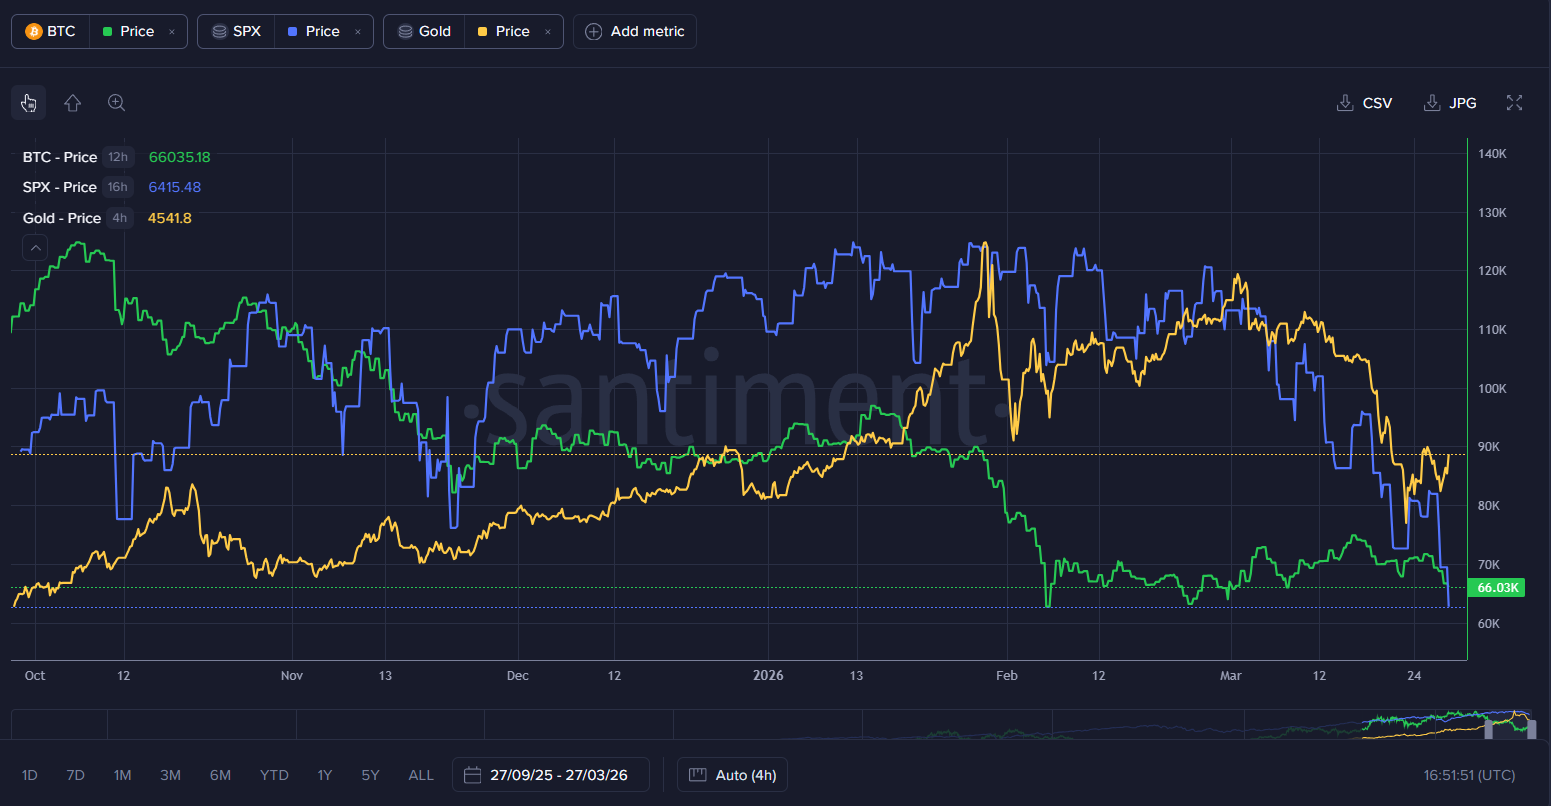
- Bitcoin is displaying unusual resilience near the $70k mark, decoupling slightly from recent downturns in the S&P 500 and precious metals.
- Major whale transactions have plummeted to multi-year lows, indicating that key stakeholders are awaiting macroeconomic clarity before making further decisions.
- Long-term MVRV(Market Value to Realized Value) ratios present a potentially favorable risk profile for accumulation, even as retail social chatter signals bearishness.
Introduction
The markets are currently operating within a storm of geopolitical tension and economic uncertainty. Despite these headwinds, Bitcoin has managed to hold just below $70k. The Santiment team recently reviewed the latest on-chain and social metrics to understand how this resilience compares to traditional equities and physical commodities. With a critical five-day pause in global conflicts coming to an end, analysts reviewed the data to see where smart money is positioning itself and what social sentiment reveals about the market's true direction.
00:00 - Crypto Market Resilience Amid Global Conflict
Despite widespread uncertainty causing bearish pressure across traditional markets, crypto assets have shown surprising strength. While gold, silver, and the S&P 500 have taken hits, Bitcoin remains near the $70k level. This stability suggests that digital assets are currently functioning under a different set of market mechanics than traditional safe havens.
- Key Data: Bitcoin remains priced near $70,000 despite major traditional market corrections(chart).
- Actionable Tip: Traders often view decoupling from traditional equities as a signal to reassess portfolio exposure toward crypto assets.
01:43 - Why Decentralized Assets Outperform Physical Gold
Geopolitical conflicts highlight the logistical limitations of physical assets. Moving gold out of restricted regions like the Middle East is currently highly problematic. Decentralized networks like Bitcoin and Ethereum offer frictionless mobility via hardware wallets, making them uniquely suited for wealth preservation during physical supply chain disruptions.
- Key Data: Physical gold supply logistics face severe disruption in key global regions.
- Actionable Tip: Historically, escalating physical border restrictions correlate with increased utility demand for borderless digital networks.
05:01 - Evaluating Political Impact On Market Volatility
Elections and government policies heavily dictate market rhythms. There is speculation that ongoing economic strain might force shifts in political strategy as midterm elections approach this coming November. While timing these governmental reactions is notoriously difficult, the eventual introduction of fresh liquidity or policy pivots typically acts as a catalyst for risk asset price moves.
- Key Data: The U.S. midterm elections are roughly six to eight months away.
- Actionable Tip: Past cycles suggest that election-year policy shifts can trigger sudden capital rotations across risk-on asset classes.

07:17 - How Historical Stock Corrections Influence Crypto
Since early February, Bitcoin has flipped the script on traditional equities. While the S&P 500 and gold have posted negative returns over the past several weeks, Bitcoin has posted an 8% gain. This marks a significant pendulum swing from previous months where crypto lagged behind the stock market's performance.
- Key Data: Since February 5th, Bitcoin is up 8%, while the S&P 500 is down 3% and Gold is down 7.5%(chart).
- Actionable Tip: Analysts often look at sustained outperformance against the S&P 500 as an indicator of growing institutional confidence in digital assets.
09:20 - Predicting Market Reactions To Weekend Announcements
Critical geopolitical announcements are frequently timed for Friday evenings after traditional markets close. This pattern forces traders to position themselves defensively going into the weekend. The impending expiration of the current five-day military pause suggests that weekend volatility could be unusually high.
- Key Data: A major geopolitical military pause officially ends on the upcoming weekend.
- Actionable Tip: Options traders frequently use Friday afternoon market closures to hedge against unpredictable weekend news cycles.
11:37 - Analyzing BitTensor's Massive Price Rally
BitTensor has surged dramatically, positioning itself as a highly tradable AI commodity. The asset recently broke into the top 30 by market capitalization. However, this massive price appreciation is now attracting mainstream attention, which often precedes short-term corrections as early buyers secure profits.
- Key Data: BitTensor price increased 140% over the past six weeks (chart).
- Actionable Tip: Surges into the top 30 market cap rankings historically precede increased sell pressure from early investors.

14:20 - Spotting Reversal Signals With Social Dominance
Tracking the percentage of crypto discussions focused on a single asset is critical. BitTensor's social dominance recently spiked near 0.8%. When retail excitement reaches these levels, it frequently forms a local top. If the social chatter fades while the price remains stable, it could indicate a second leg up, but divergence is typically a red flag.
- Key Data: BitTensor's social dominance spiked to 0.8% immediately before a slight price retracement(chart).
- Actionable Tip: When an altcoin's social dominance approaches 1% or higher, it historically signals a high probability of a local market top.
20:51 - Finding Historical Parallels In Previous Altcoin Cycles
Current AI token hype mirrors past cycles, such as the privacy coin boom. Assets like Zcash previously captured immense market share before newer narratives took over. Understanding that these cycles repeat helps analysts separate fundamental long-term value from fleeting social manias.
- Key Data: Historical models show social volume fades by up to 95% once a specific technological narrative cools down.
- Actionable Tip: Experienced market participants treat extreme narrative hype as an opportunity to secure profits rather than establish long-term positions.
22:22 - Identifying Warning Signs In Meme Coin Pumps
Meme coins remain highly speculative and volatile. Recent on-chain data shows flash spikes in social volume preceding sudden price pumps, followed by immediate dumps. These coordinated movements often trap retail traders who attempt to catch falling knives after the initial momentum breaks.
- Key Data: Meme coin social volume typically peaks roughly 10 hours before the final price top.
- Actionable Tip: Entering a meme coin trade after a massive social volume spike carries a statistically higher risk of immediate drawdown.

24:28 - Why War Resolution Chatter Is A Bearish Indicator
Social sentiment tools show a massive increase in traders expecting an immediate end to global conflicts. In the crypto space, this organic retail optimism is often misplaced. When the crowd overwhelmingly expects bullish macroeconomic news to drive prices higher, the market typically moves in the opposite direction.
- Key Data: Discussions regarding the war ending have spiked continuously since March 15th(my narratives tool).
- Actionable Tip: High concentrations of retail optimism on social platforms are frequently viewed as contrarian indicators for short-term price action.
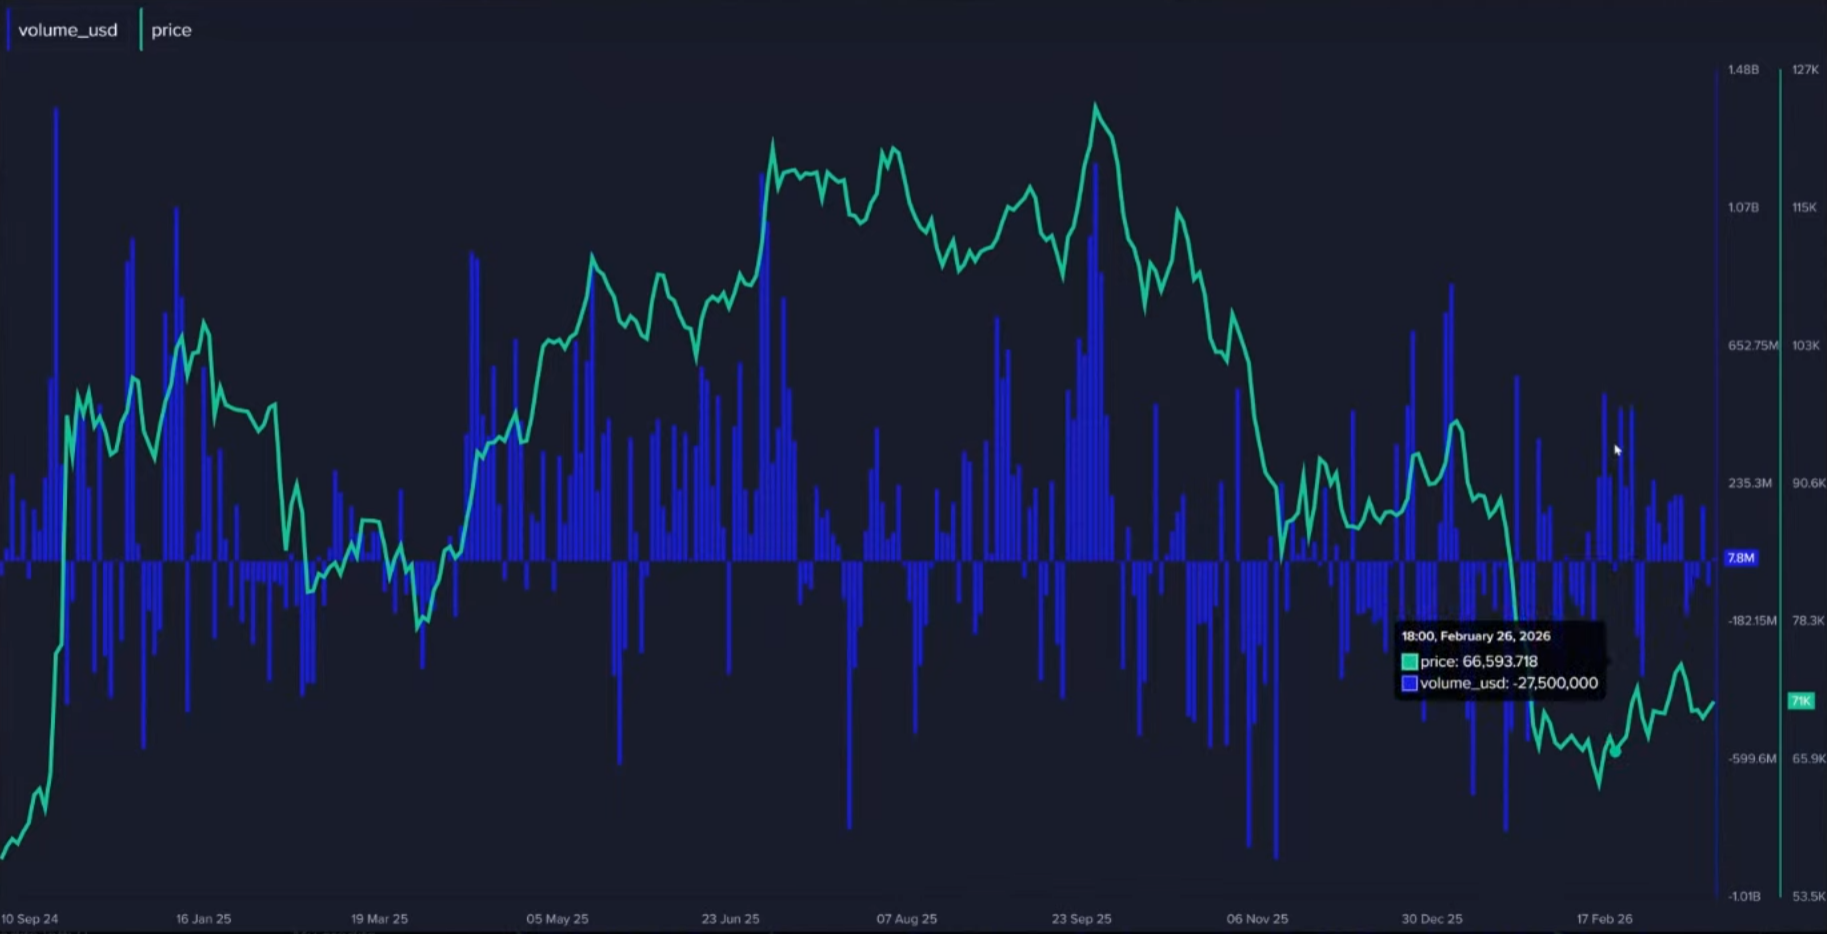
27:37 - Reading Institutional ETF Outflow Data
Following massive volume spikes in late February, institutional activity has cooled. Current ETF flows show more capital slowly leaving than entering. While volume is low, this minor outflow bias indicates that traditional finance investors are taking a cautious approach.
- Key Data: ETF flows currently show a small net negative outflow bias over the past week(charts).
- Actionable Tip: Consistent ETF outflows typically correlate with sideways or downward price action until institutional accumulation resumes.
29:19 - Finding Bullish Signals In Long Term MVRV
The Market Value to Realized Value ratio reveals the average profit or loss of active holders. Both the 30-day and 365-day MVRV ratios are currently negative. This means average holders are underwater, which historically places the market in an accumulation zone where the risk of mass sell-offs is greatly reduced.
- Key Data: The 365-day MVRV currently sits at -28%(chart).
- Actionable Tip: Historically, taking positions when the 365-day MVRV drops below -20% offers a highly favorable risk-to-reward ratio for long-term holders.
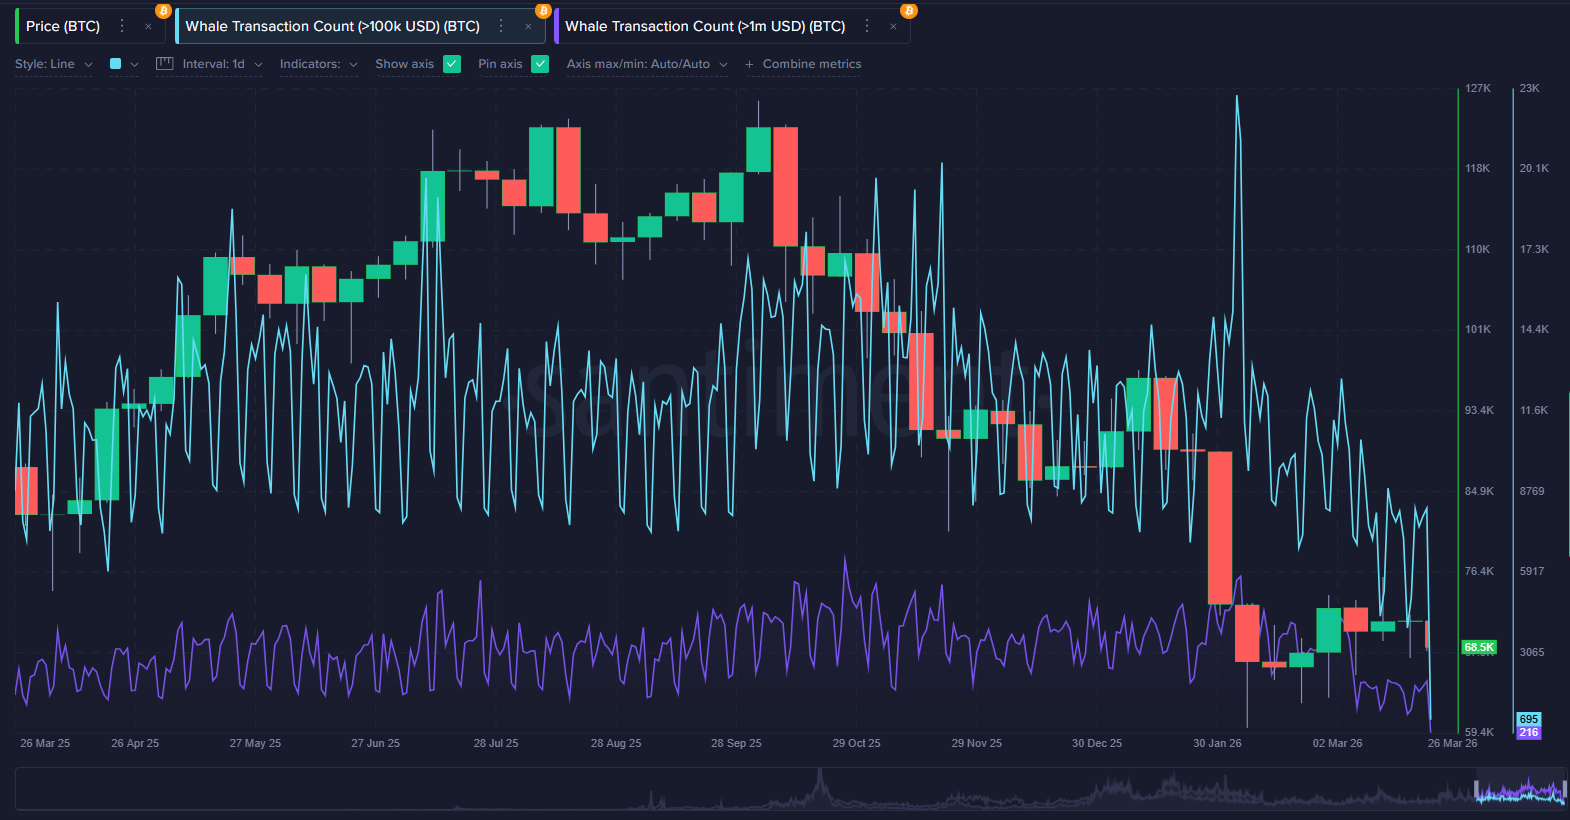
31:17 - Decoding The Extreme Drop In Whale Transactions
Bitcoin's largest holders have gone completely dormant. Transactions exceeding $100k and $1M have hit their lowest levels since late 2023. This extreme lack of movement suggests that smart money is uncertain about upcoming macroeconomic shifts and prefers holding cash or current positions over executing new trades.
- Key Data: $100k+ whale transactions are at their lowest levels since September 2023(data).
- Actionable Tip: Low whale activity is generally interpreted as a signal to avoid high-leverage trades until major institutional direction is established.
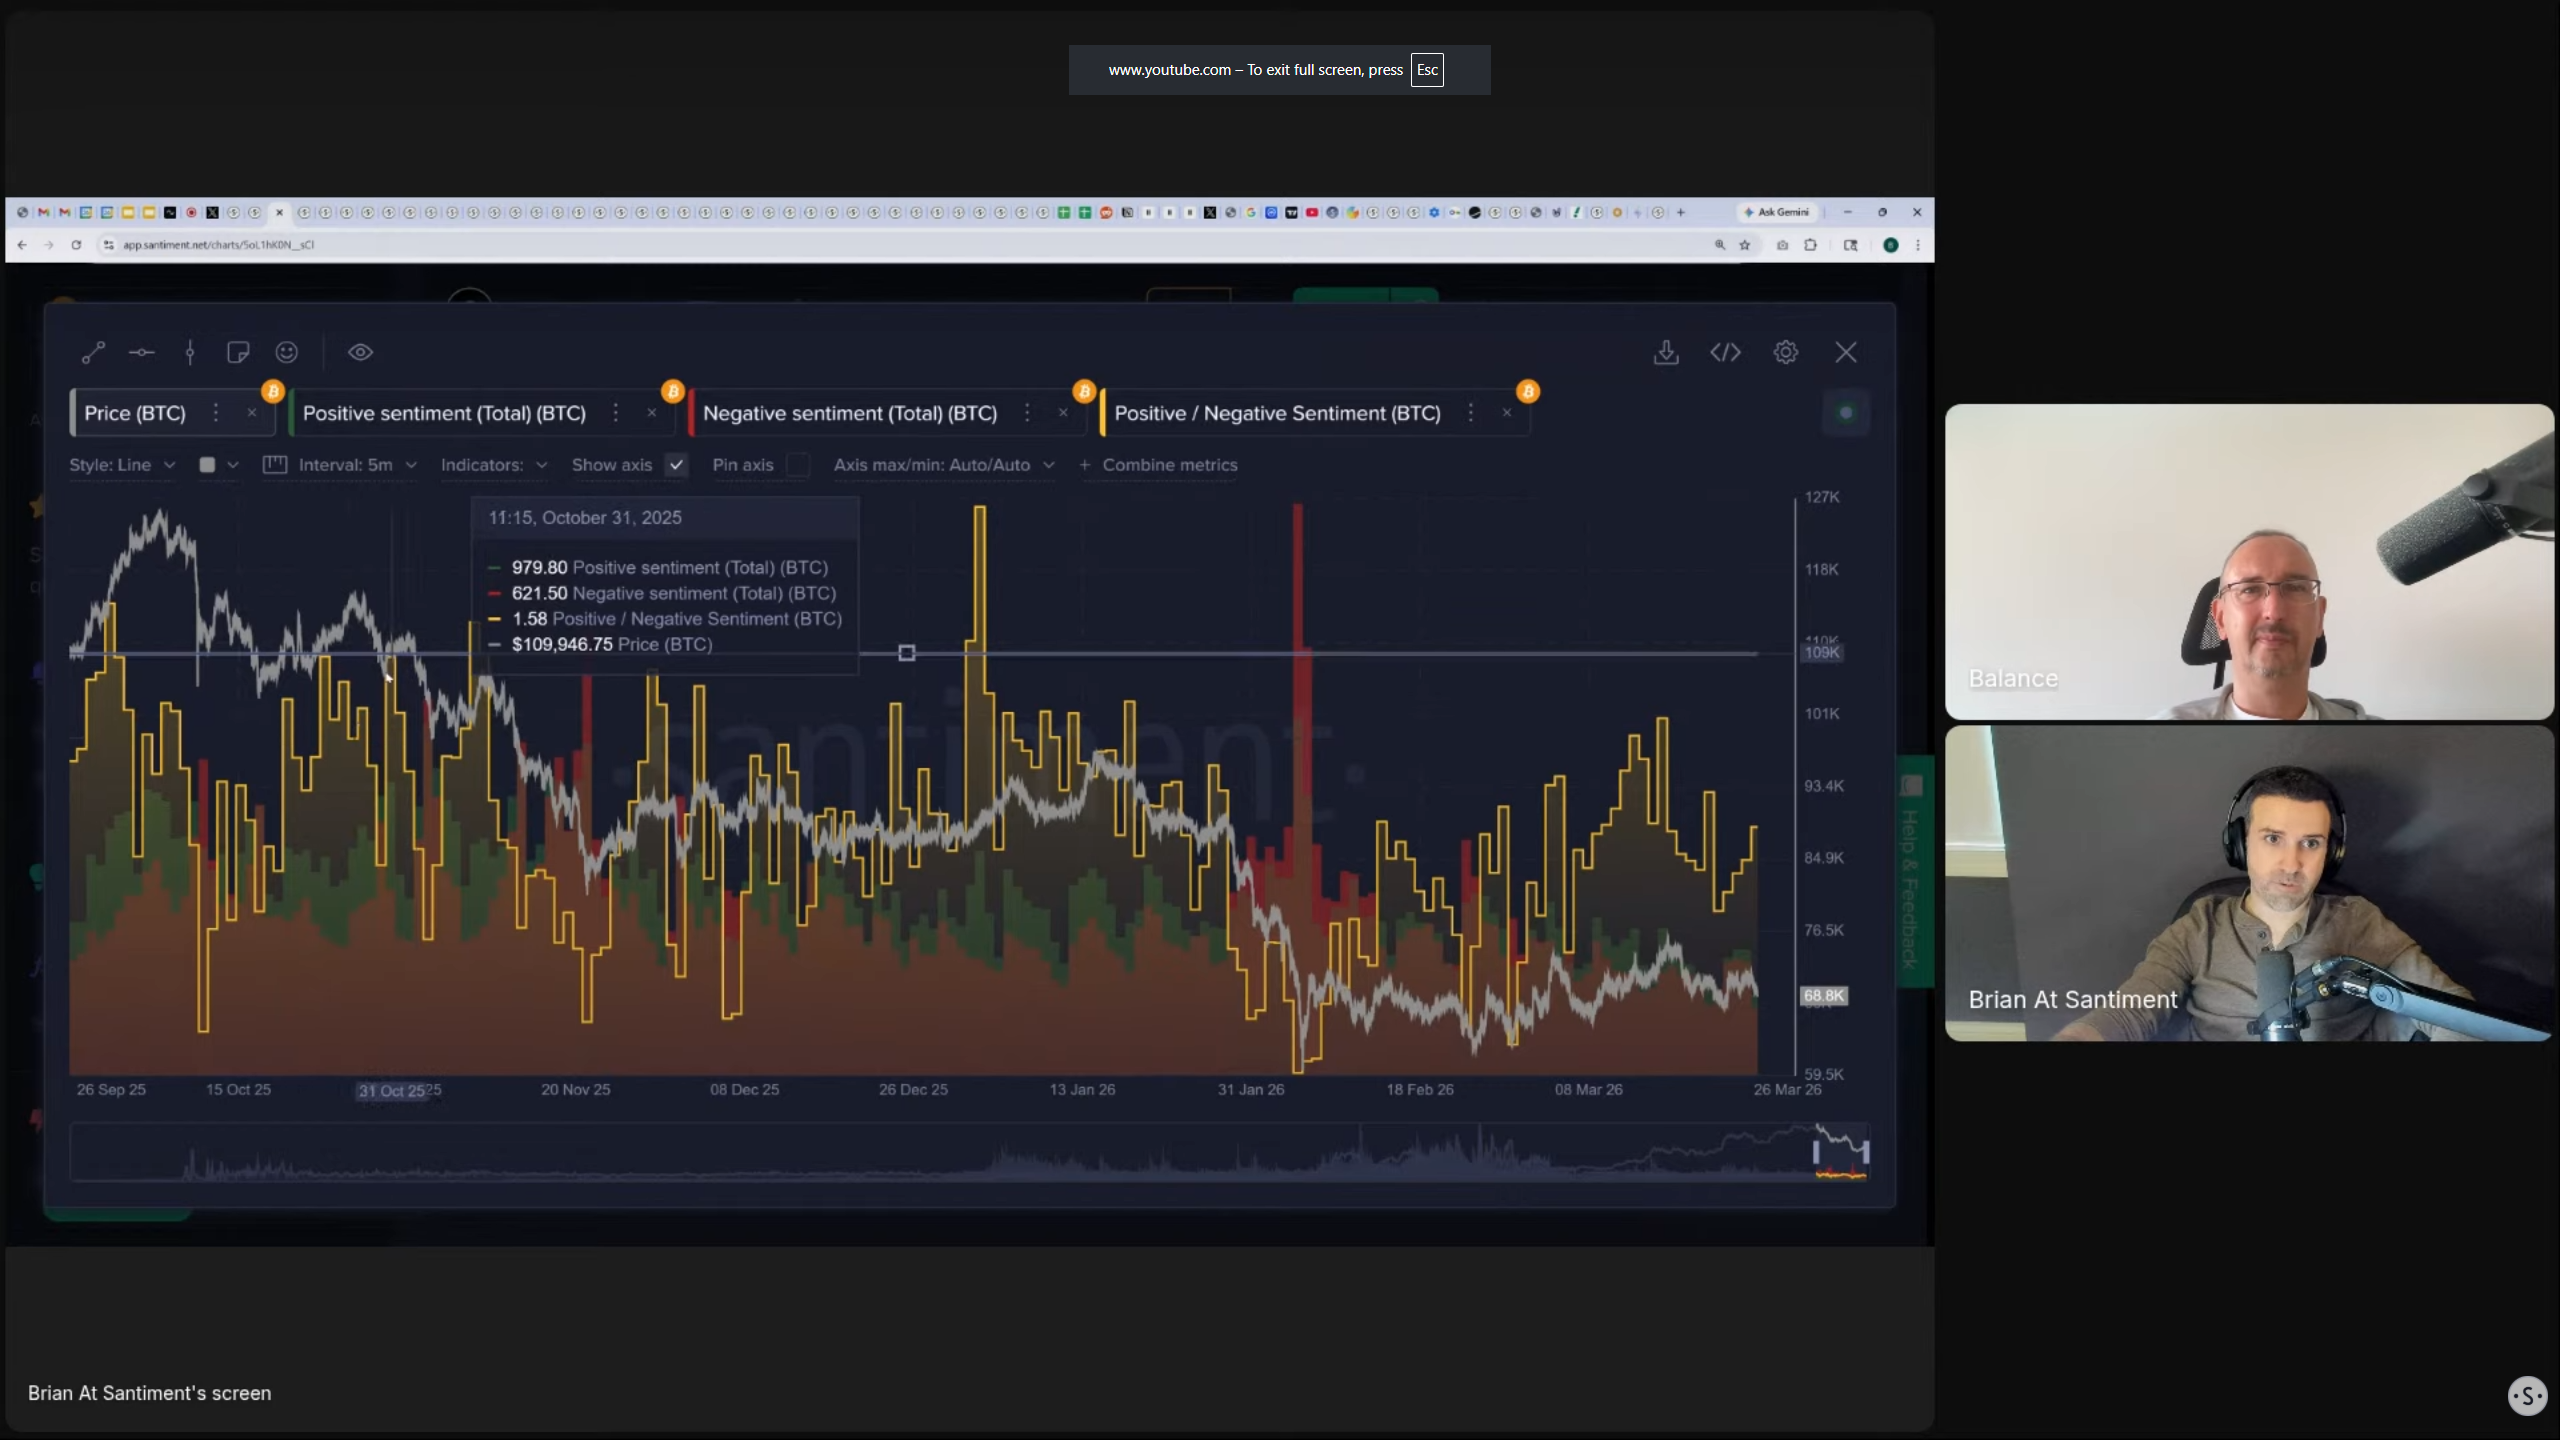
34:02 - Timing Market Entries Using Sentiment Ratios
Comparing positive versus negative comments across social channels provides a clear view of crowd psychology. The current sentiment ratio is hovering near neutral, occasionally dipping into negative territory. While not at absolute capitulation levels, the absence of excessive euphoria is a healthy sign for sustained market stability.
- Key Data: The positive-to-negative comment ratio briefly dropped below 0.99, indicating slight crowd fear(chart).
- Actionable Tip: Accumulating assets when the sentiment ratio falls heavily below neutral historically yields higher short-term returns.
38:35 - Breaking Down The Latest Crypto Alpha Narratives
Significant real-world adoption continues to develop quietly under the radar. Institutions like Fannie Mae accepting crypto collateral present strong fundamental tailwinds. Concurrently, new narratives surrounding cash flow, stablecoins, and yield generation indicate that institutional capital is rotating out of speculative meme coins and into sustainable DeFi infrastructure.
- Key Data: Fannie Mae has introduced new regulations to accept crypto as mortgage collateral (trending stories).
- Actionable Tip: Analyzing sustained social volume in structural DeFi narratives is often viewed as a leading indicator for the next crypto market cycle.
Conclusion
The prevailing sentiment throughout the market is one of intense uncertainty mixed with a dangerous dose of retail optimism. While the broader geopolitical situation keeps massive institutional whales firmly on the sidelines, long-term metrics like MVRV suggest the market presents a favorable risk profile for patient investors. Understanding these hidden dynamics gives data-driven traders a significant edge over the emotional crowd.
Don't trade on feelings, trade on data. Sign up for app.santiment.net and join our discord for access to real time metrics and analysis. For more data-driven crypto analysis, subscribe to our YouTube channel, our Substack, or follow us on Santiment Insights.
Disclaimer: The opinions expressed in the post are for general informational purposes only and are not intended to provide specific advice or recommendations for any individual or on any specific security or investment product.