
This Week in Crypto, Full Written Summary: W2 October

Crypto's 16% Plunge: Has There Been Enough Pain?
Executive Summary
- Market-Wide Plunge: The crypto market experienced one of its worst weeks, with total crypto market cap dropping 16.1% driven by fears over potential US tariffs on China and a looming credit crisis. Bitcoin fell over 10%, while some altcoins like Aptos plunged as much as 36%.
- Contrarian Signals Abound: Despite the price crash, multiple data points suggest a potential rebound. On-chain metrics show traders are not in significant pain (low MVRV), retail sentiment is highly fearful, and Bitcoin ETFs saw massive outflows—all historically bullish contrarian indicators.
- Whales vs. Shorts: While large "whale" investors have sold off slightly in recent days, their long-term trend remains strong accumulation. Meanwhile, record levels of short positions have opened, creating conditions for a potential "short squeeze."
- Gold's Strange Behavior: In a rare market anomaly, Bitcoin has been moving inversely to gold, which is hitting all-time highs, signaling that investors are treating them as opposing bets on economic stability.
Introduction
Welcome to our summary of “This Week in Crypto." Brian provided a data-packed update on a turbulent week in the markets. His analysis offered a clear, numbers-based perspective on the recent crypto bloodbath. We saw the total market cap shrink significantly, but what does the underlying data tell us? Below we will explore key factors driving the downturn and interesting data points from tariff fears to a rare inverse relationship between Bitcoin and gold. We will also look at on-chain metrics to see if a rebound could be next.
Crypto's Bloody Week: Market Plunges 16%!
It was a painful week for the crypto markets. The total market capitalization fell by a staggering 16.1%, one of the largest weekly declines in recent memory. Bitcoin led the charge downwards, dropping over 10.5%. Despite the price crash, the market cap still sits at a healthy $4.6 trillion, showing that significant capital remains in the space. Interestingly, the volatility spurred a massive increase in trading volume. This indicates that traders are highly active, with strong opinions on whether the market will fall further or bounce back.
- Key Data: The total crypto market cap dropped 16.1%, while overall trading volume increased by nearly 25%.
- Actionable Tip: Pay attention to trading volume during price drops. High volume can indicate strong conviction from both buyers and sellers, it often precedes a decisive market move.
Altcoin Carnage: Which Coins Suffered the Most?
While Bitcoin’s drop was significant, many altcoins experienced even steeper losses. The downturn was widespread, hitting large and mid-cap assets hard. Dogecoin fell by approximately 23%, and Cardano saw a 21% decline. Other notable drops included Sui at nearly 28% and Polkadot at 29%. Aptos appeared to be the biggest loser among this group, plummeting by 36% in just a week.
- Key Data: Aptos was the biggest loser among large to mid-caps, falling 36% in one week.
- Actionable Tip: During a market-wide downturn, compare the performance of different altcoins. Assets that show relative strength (or weakness) can offer insights into sector-specific sentiment.
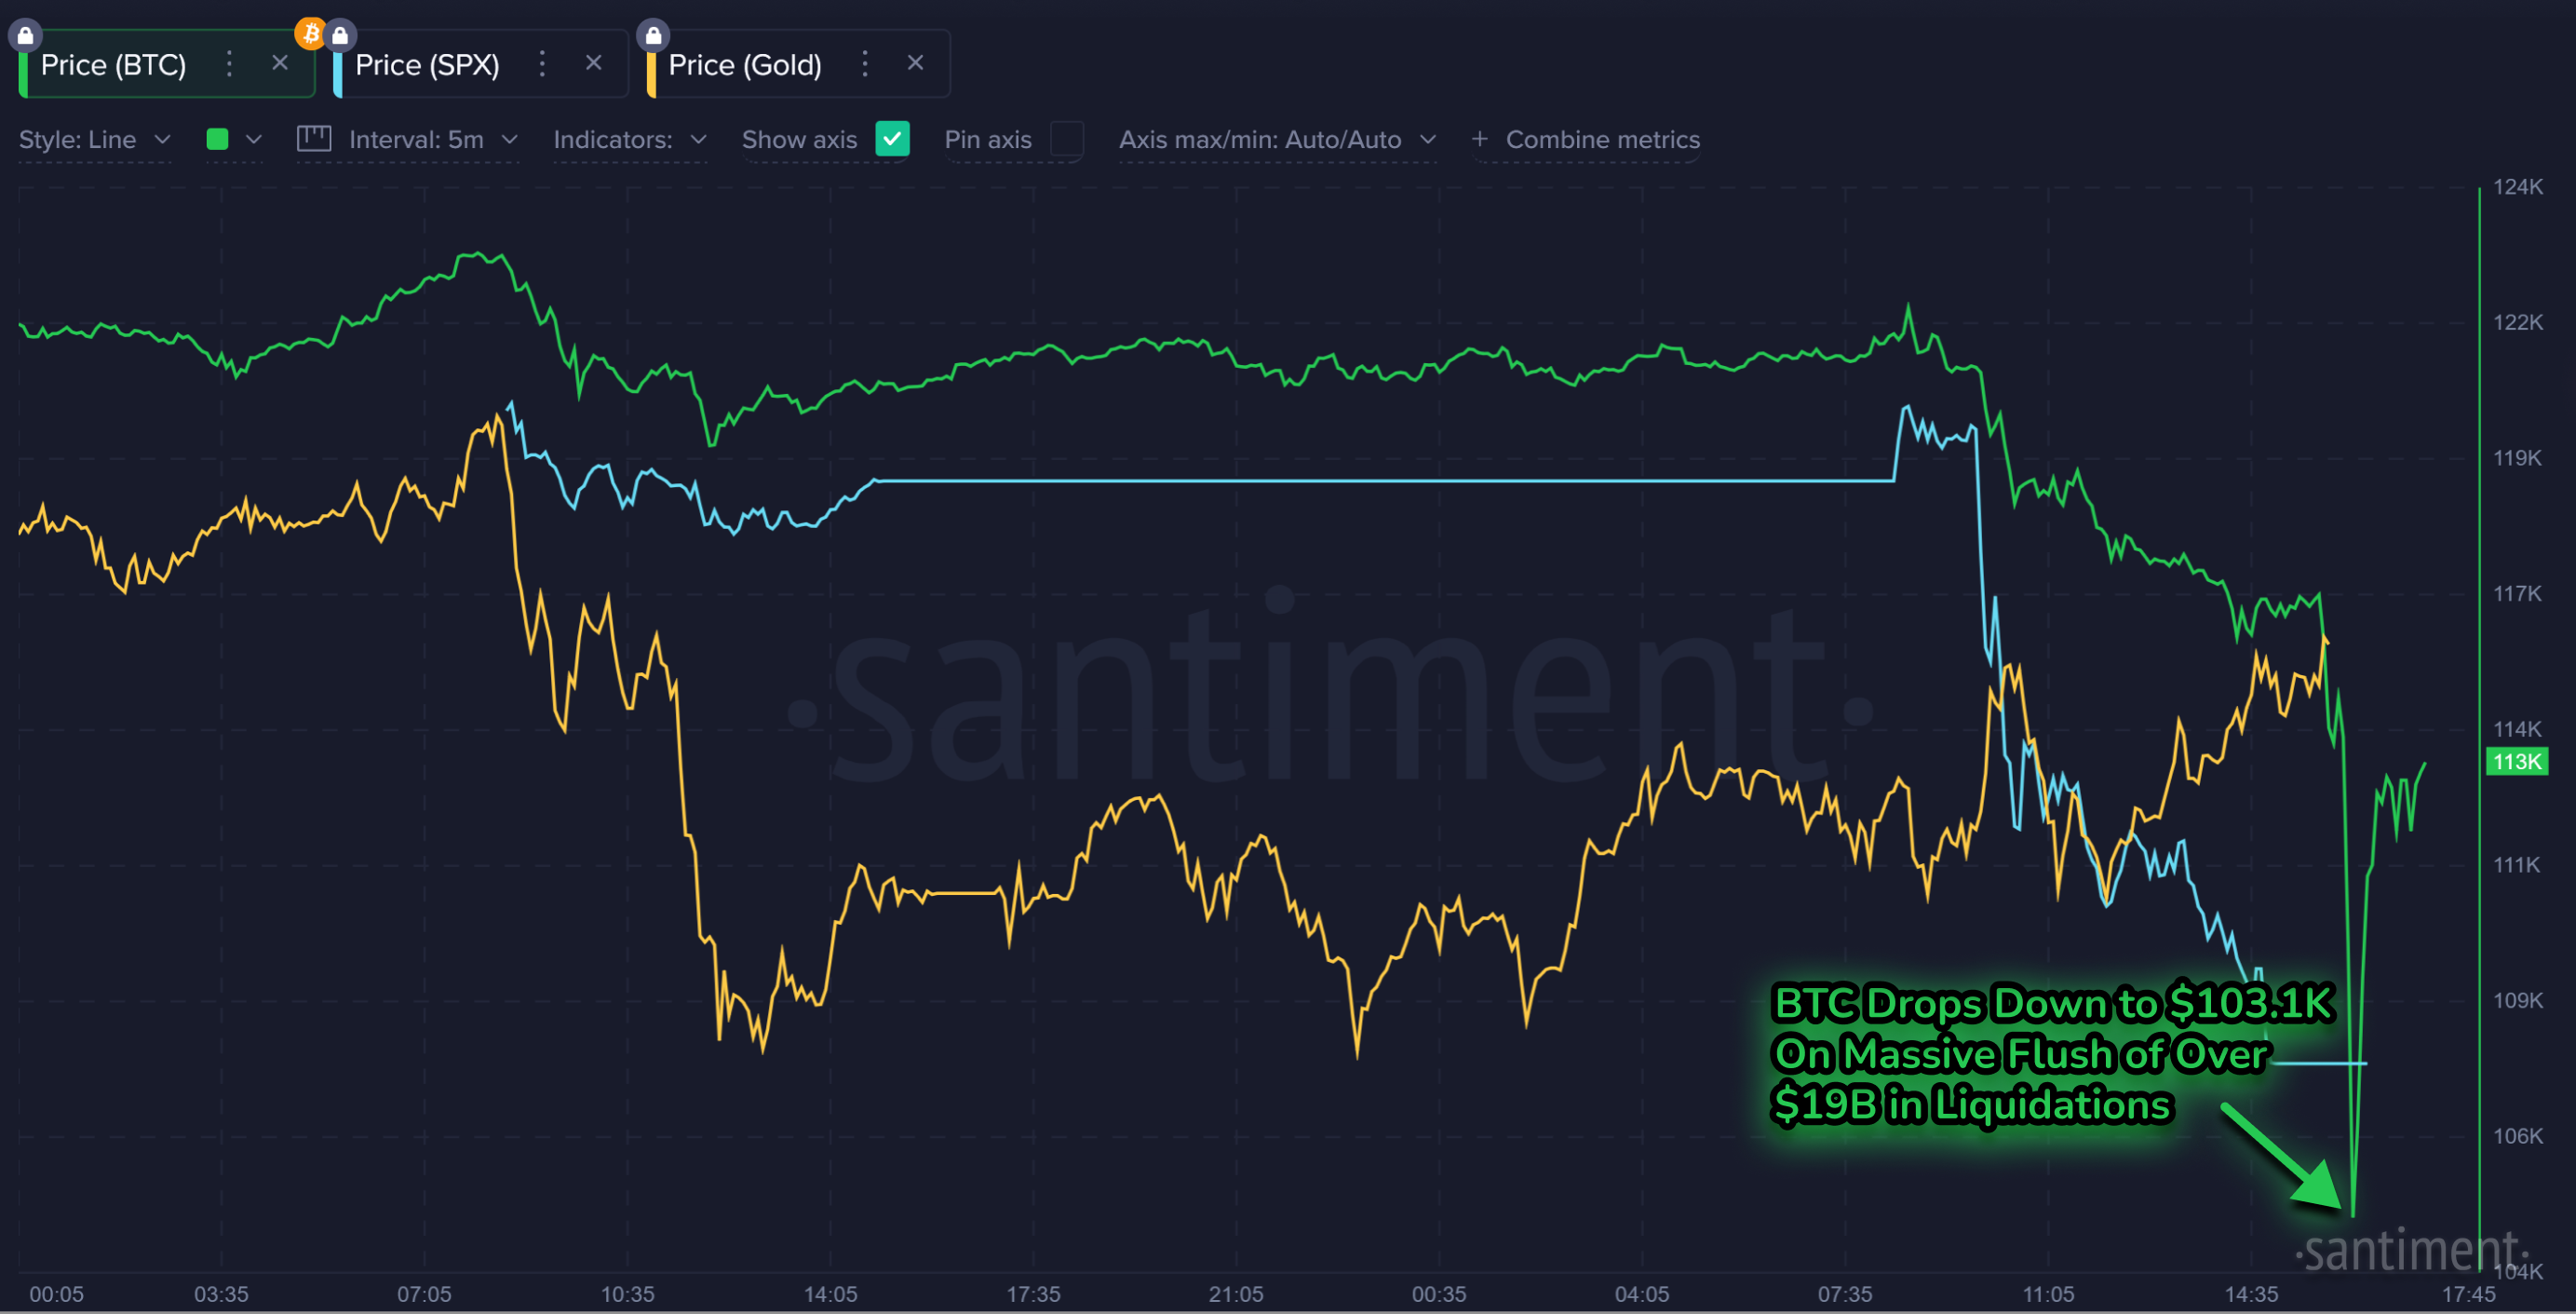
A Rare Anomaly: Bitcoin and Gold's Inverse Correlation
A fascinating and highly unusual trend has emerged: Bitcoin and gold are moving in opposite directions. While gold has been reaching new all-time highs, Bitcoin has been trailing. It looks like some Central Banks of the world are loading up on gold as a hedge against a potential economic crisis. Conversely, investors seem to buy Bitcoin and equities when economic confidence is higher.

- Key Data: Gold and Bitcoin are showing a rare inverse correlation, with gold hitting new all-time highs as Bitcoin corrects.
- Actionable Tip: Observe the relationship between Bitcoin and Gold, as they are both used as a hedge against weakening currencies.
How Trump's Tariff Tweets Crashed the Crypto Market
A primary catalyst for the week's sharp downturn was Trump’s announcement of 100% tariffs on China. Social media volume on this topic exploded on October 10th, coinciding with the market drop. Although the announcement was quickly rescinded, the market still went through a shock. This event shows how sensitive crypto and traditional markets are to geopolitical tensions and trade policy announcements.
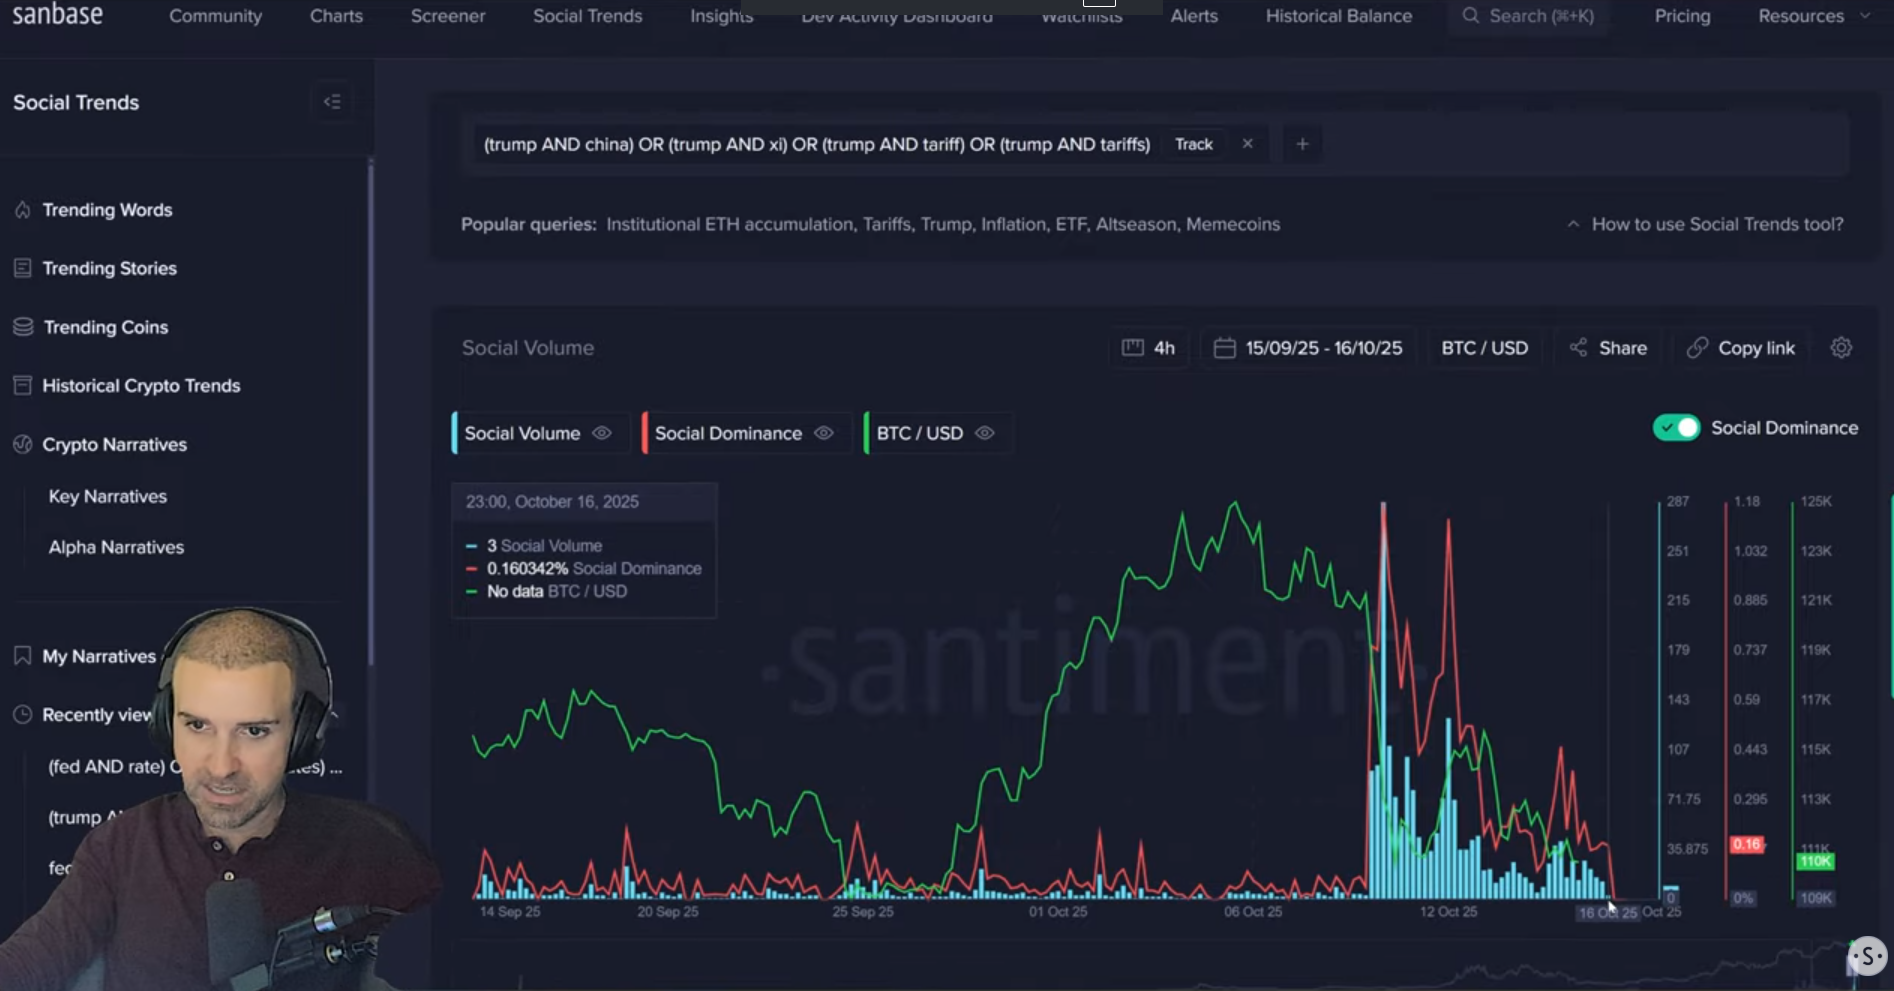
- Key Data: Social volume for terms like "Trump" and "tariff" exploded on October 10th, directly coinciding with the market crash.
- Actionable Tip: Monitor social media trends related to major geopolitical events. Sudden spikes in discussion can be leading indicators of market volatility.
Fed Rate Cuts: Decoding the "Buy the Rumor, Sell the News" Trap
The market is also looking ahead to the next Federal Reserve meeting on October 28 or 29th. The last rate cut in mid-September created a classic "buy the rumor, sell the news" event. The price rallied before the official announcement, only to retrace once the news was confirmed. The real price effects were felt later, leading to the all-time high on October 6th. Brian advises watching price action leading up to the next announcement, as a reversal often occurs right when the news becomes official.
- Key Data: The last Fed rate cut prompted a "sell the news" event, with the price peaking before the official announcement.
- Actionable Tip: When a major economic event is anticipated, watch how the market behaves leading up to it. The price action before the news is often more telling than the reaction immediately after.
Contrarian Signal? Why Mass Fear Predicts a Bitcoin Bounce
Social data reveals a powerful contrarian indicator. Mentions of sub-100k Bitcoin price predictions spiked dramatically just as the market began to bounce. This surge in fearful retail sentiment has historically preceded price rebounds. In the past eight hours, these low price predictions hit their highest point in over a month, followed by another small bounce.
- Key Data: Mentions of sub-100k Bitcoin prices saw their largest spike in over a month, a historically contrarian bullish signal.
- Actionable Tip: Track crowd sentiment through social media price predictions. Extreme fear (many low predictions) can often indicate that a local bottom is near.
On-Chain Data Screams "Buy": Is This the Bottom for Bitcoin?
On-chain metrics provide a compelling case for a potential market bottom. The 30-day MVRV ratio, which measures the average profit or loss of short-term traders, has fallen to its lowest point in six months. Currently at -5.8%, it indicates that these traders are, on average, in pain. Historically, buying when the MVRV is this low has been a less risky strategy.
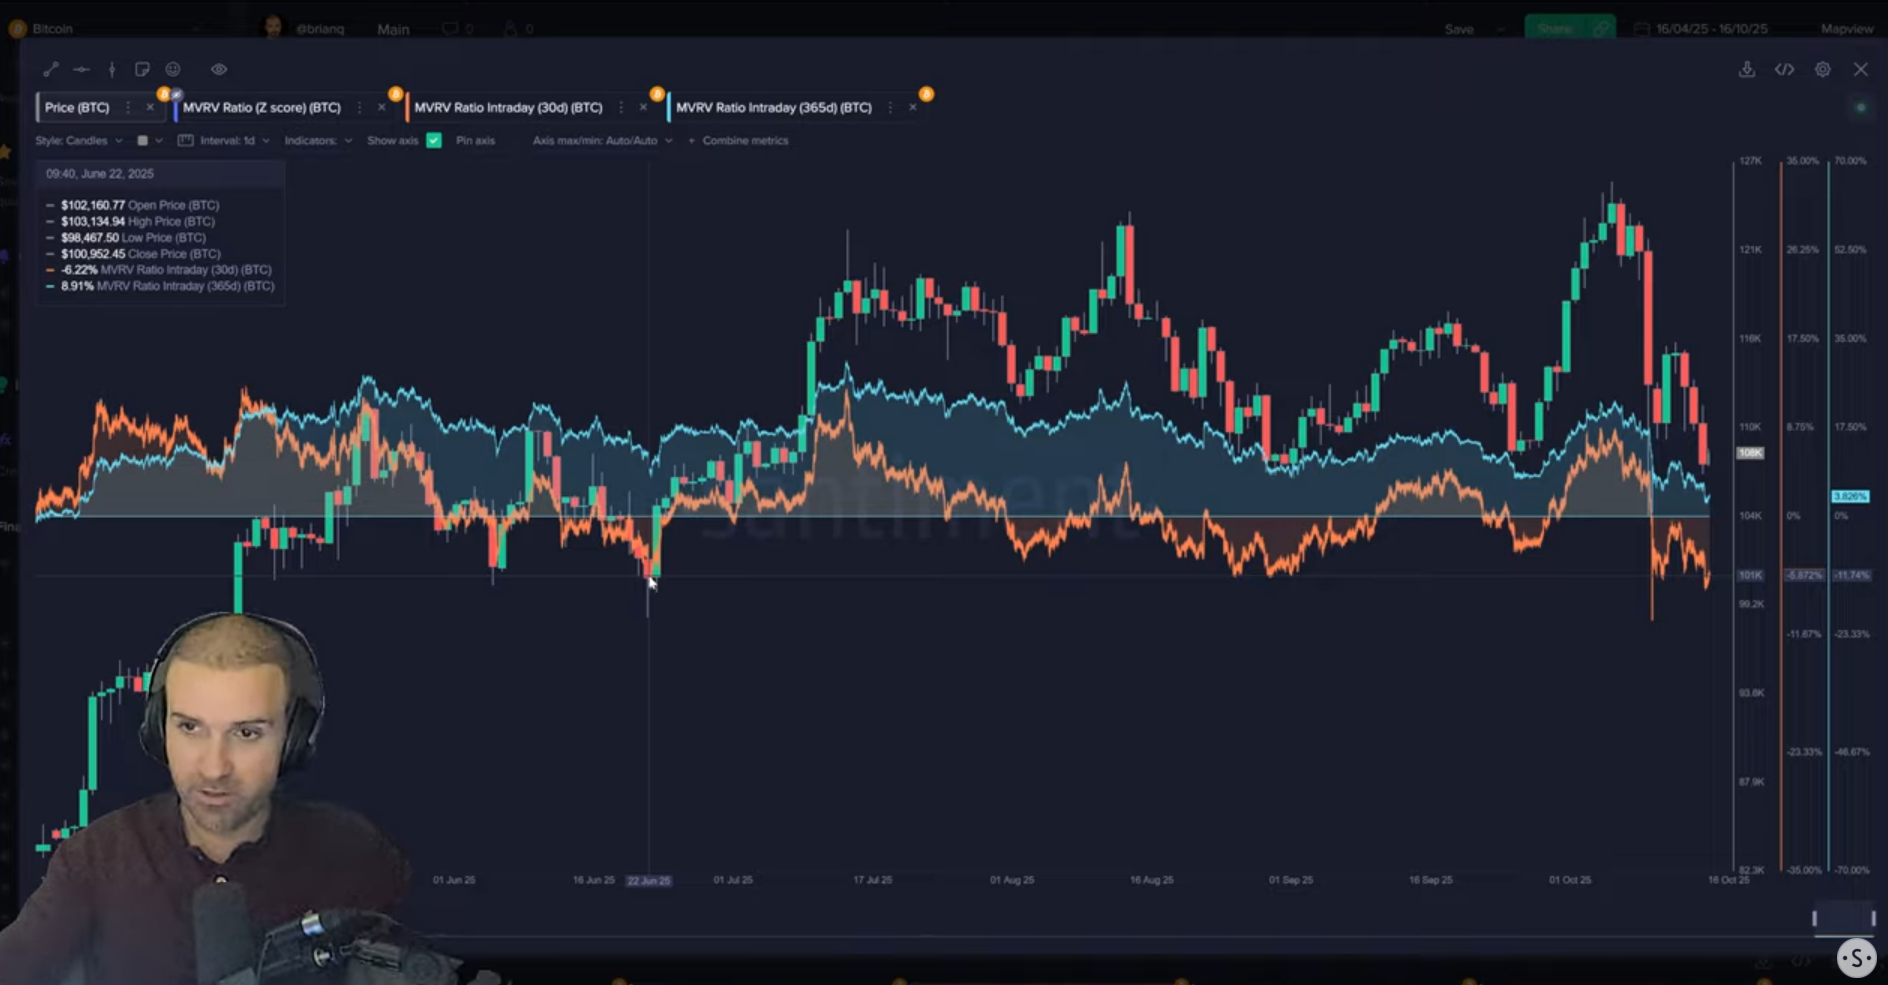
- Key Data: The 30-day MVRV ratio is at -5.8%, a level not seen since mid-June before a major market rally.
- Actionable Tip: Use the MVRV ratio to gauge trader profitability. When the 30-day MVRV is significantly negative, it suggests short-term holders are underwater, which can reduce selling pressure.
Hidden Gems: Uncovering Severely Undervalued Altcoins
For those looking at altcoins, the MVRV divergence chart highlights assets that are in "extreme underbought territory." This model identifies coins whose average trader returns are significantly below their historical norms. Some of the assets currently in this opportunity zone include SingularityNET, Frax Share, dydx, and Maker. However, Brian cautions that investors should always do their own research.
- Key Data: The MVRV divergence model identifies multiple altcoins, including SingularityNET and Maker, as being in a potential opportunity zone.
- Actionable Tip: Explore divergence models to find assets that may be undervalued relative to their historical norms, but always follow up with fundamental research on the specific projects.
Short Squeeze Incoming? Record Bets Against Bitcoin Signal a Reversal
Funding rates on major exchanges like Binance show a significant increase in short positions, with traders betting that Bitcoin's price will fall further. These are some of the highest levels of shorting seen since late April and early May. A large number of shorts can provide "rocket fuel" for a price rally. If the price moves upward, these short positions are forced to close, creating a cascade of buying pressure.
- Key Data: Funding rates on Binance show the largest volume of short positions in nearly six months.
- Actionable Tip: Keep an eye on funding rates on derivatives exchanges. A high concentration of short positions can create the conditions for a "short squeeze," leading to rapid price increases.
Whale Watching: Are the Biggest Players Accumulating or Dumping?
The behavior of large "whale" wallets is a critical long-term indicator. Since late August, these key stakeholders have accumulated an additional 97,300 Bitcoin. However, over the past four days, they have dumped about 12,720 Bitcoin amid the tariff concerns. This recent selling is not yet a major concern, as the broader six-month trend remains one of strong accumulation.
- Key Data: Despite dumping 12,720 BTC in the last four days, large whale wallets are still up by 97,300 BTC since late August.
- Actionable Tip: Focus on the long-term accumulation trends of whale wallets rather than short-term daily fluctuations. A sustained pattern is a more reliable indicator of their sentiment.
Gold vs. Bitcoin: The Great Debate Reignites Amid Market Turmoil
Trending stories this week were dominated by the gold versus Bitcoin debate, fueled by gold advocate Peter Schiff. Another major topic is the growing fear of a credit crisis, with regional bank stocks plunging due to fraudulent loans, sparking comparisons to the 2008 financial crisis.
- Key Data: The Fear and Greed Index plummeted from 64 (greed) down to 22 (extreme fear) in a short period.
- Actionable Tip: Use our trending stories tool to quickly gauge the market's primary narratives and concerns, helping you understand the context behind price movements.
A Contrarian Bottom Signal? Massive Outflows Hit Bitcoin ETFs
Bitcoin ETF flows offer another compelling contrarian signal. Yesterday saw the largest single-day outflow since late July, with over half a billion dollars leaving the funds. This rapid shift in sentiment comes just 11 days after a massive inflow spike that marked the local top. Historically, large outflow days like this have often correlated with market bottoms.
- Key Data: Bitcoin ETFs experienced over $500 million in outflows in a single day, the largest negative flow since July 31st.
- Actionable Tip: Monitor Bitcoin ETF inflow and outflow data. Extreme outflows can signal peak fear and capitulation, often coinciding with market bottoms.
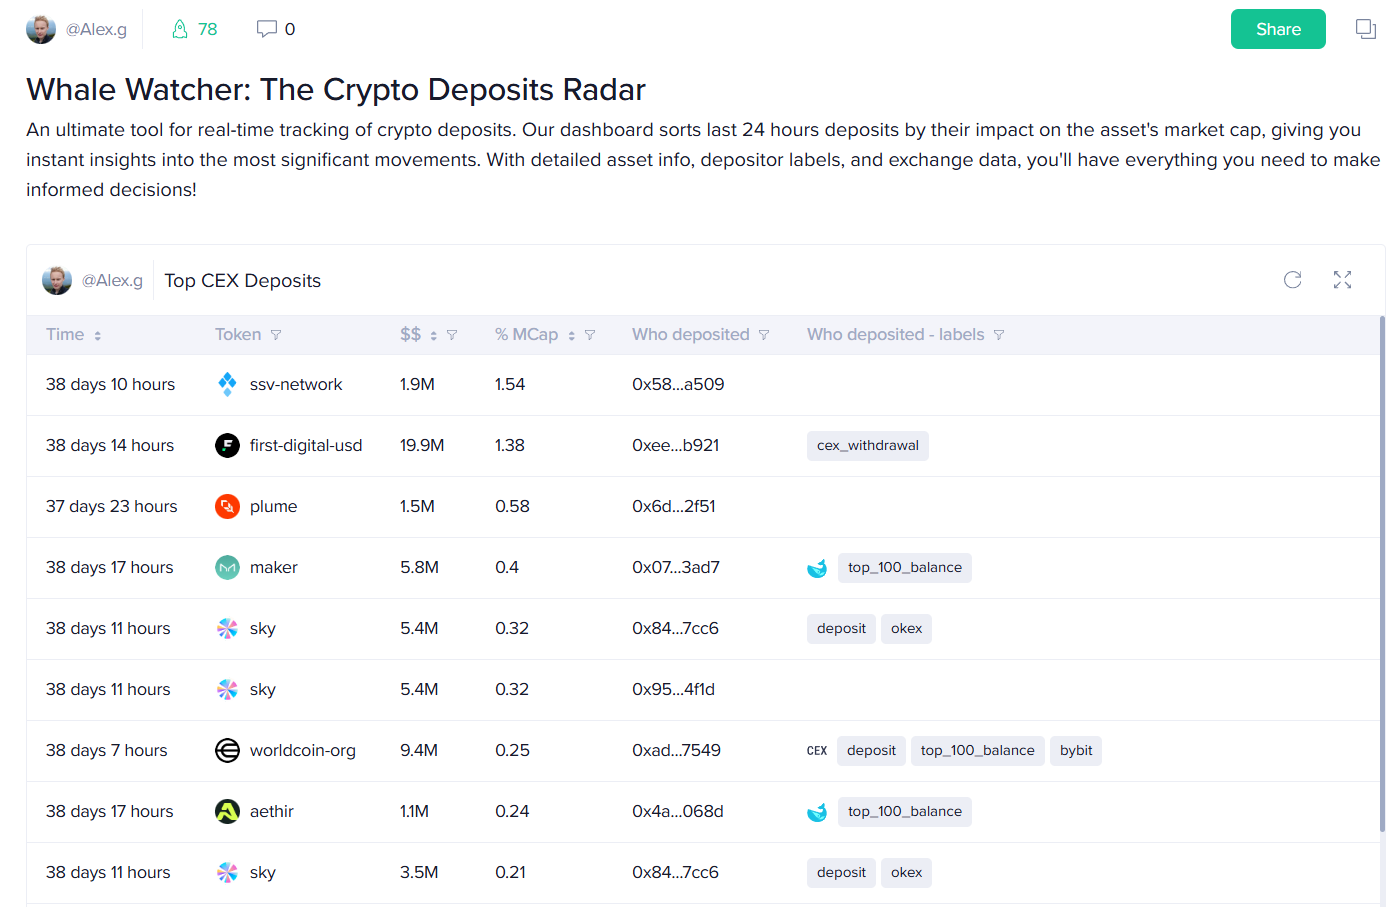
Whale Alert: Tracking Huge Altcoin Moves to Exchanges
The Whale Watcher radar has detected significant altcoin movements to centralized exchanges, which can be a precursor to selling. In the last day, Cyber Connect saw a transfer worth 3.13% of its entire market cap move to an exchange. Pax Gold (PAXG) also saw multiple large deposits. True to form, PAXG’s price dropped about 5% shortly after these transfers.
- Key Data: A single transfer of Cyber Connect (CYBER) to an exchange represented 3.13% of its entire market cap.
- Actionable Tip: Set up alerts for large transfers of specific altcoins to exchanges. This can serve as an early warning for potential sell-offs, especially after a period of high social volume.
Conclusion
This week's market was defined by fear, driven by geopolitical news and economic uncertainty. A closer look at the data reveals the nuance. On-chain metrics, extreme retail fear, large ETF outflows, and a high number of short positions all point toward conditions that have historically preceded market bounces.
Understanding these underlying trends through data-driven analysis is essential for making sense of crypto's volatility. While the future is never certain, the data suggests that the recent pain may be creating a significant opportunity. To get all the details, be sure to watch the full episode of "This Week in Crypto."
Subscribe to our YouTube channel, our Substack, or follow us on Santiment Insights.