
This Week in Crypto, Full Written Summary: W1 February 2026

Crypto's Relief Rally: Real Recovery or Dead Cat Bounce?
Executive Summary
The crypto market is testing investor resolve. After a violent dip to $60,000 followed by a 13% bounce, on-chain metrics are flashing a rare "blood in the streets" buy signal. With over $15 billion in leverage wiped out, funding rates turning negative, and holder profitability (MVRV) hitting 3-year lows, the data suggests this may be a genuine bottom rather than a dead cat bounce. However, sustained recovery depends on Bitcoin holding the $60k support and whales continuing their tentative accumulation.
00:00 - Crypto Market Status: Relief Rally or Dead Cat Bounce?
The market has been intense, with Bitcoin bottoming near $60,000 before a sharp 13% recovery to $68,200. While the bounce erased the last 24 hours of losses, BTC remains down significantly on the weekly timeframe. The Santiment team notes that while peak panic has passed, we are currently observing if the market can sustain key support levels to determine if we remain in an opportunity zone.
Key Data: BTC down 19% in 7 days; 13% bounce from $60k bottom (chart).
Actionable Insight: Watch the $60k support level closely. A hold above this line over the next week is a key data point for judging a larger recovery or shift in trending direction.

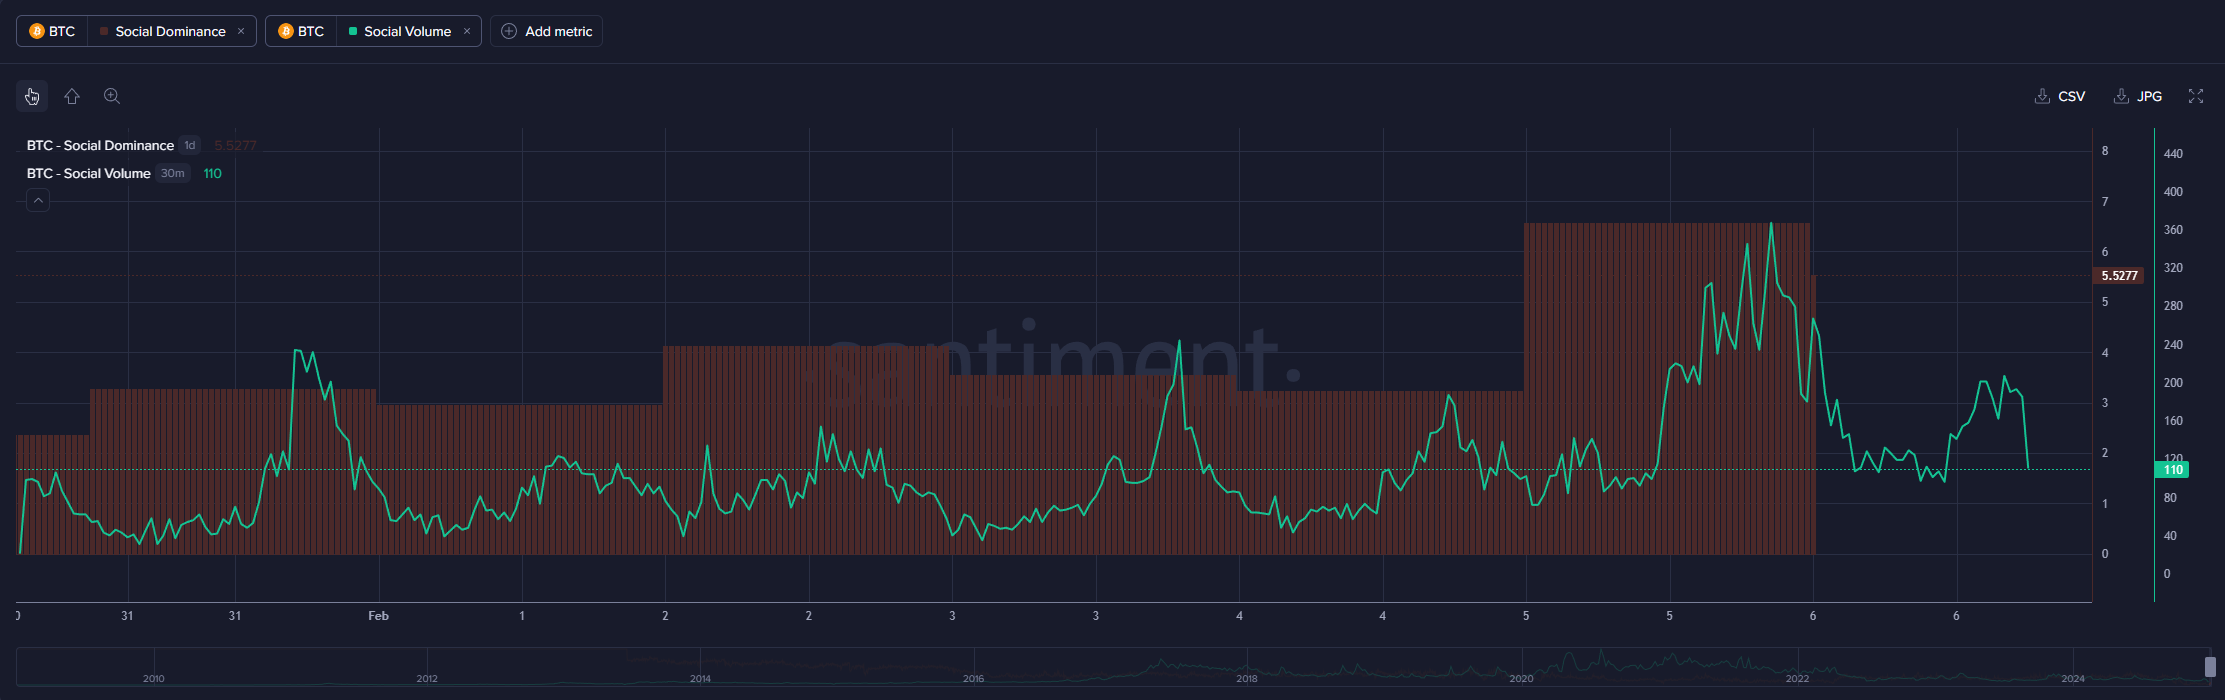
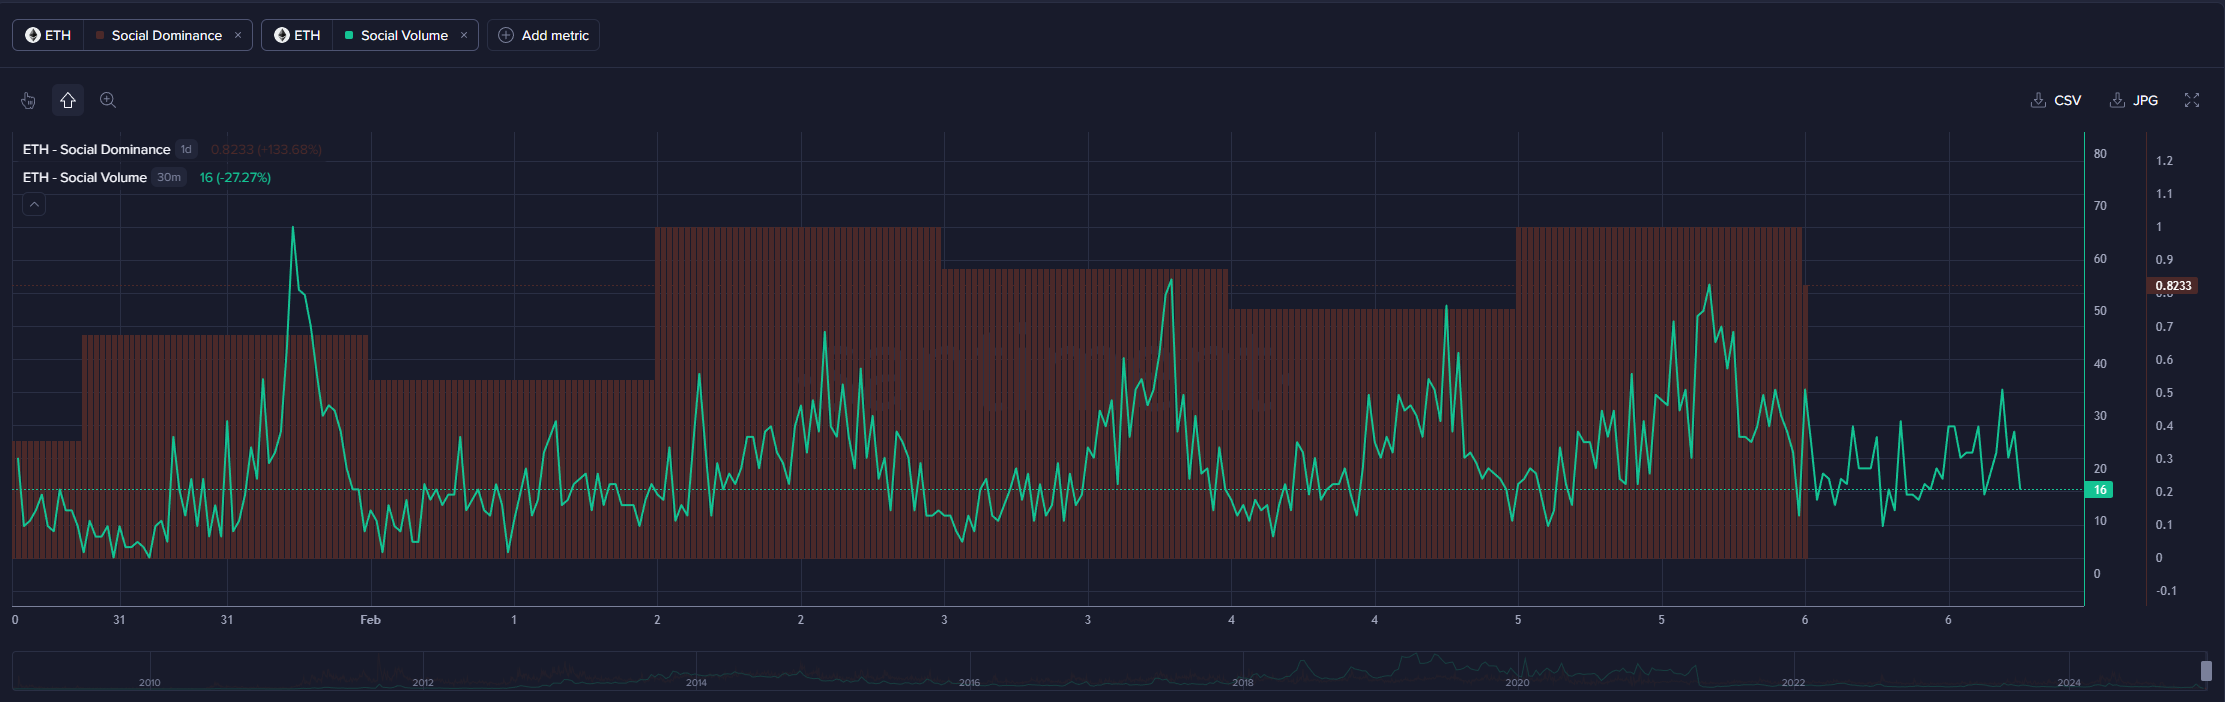
04:33 - Social Trends: Why Ethereum Is Being Overlooked
Bitcoin is dominating media attention with soaring social dominance, while Ethereum social dominance remains low (chart) despite price dropping below $2,000, likely due to being overshadowed by BTC price action. Social volumes are up on both, but significantly more for BTC. This lack of social dominance may be an opportunity; when a top-cap asset is mathematically oversold but socially ignored, it often a buy signal.
Key Data: BTC social dominance +100%; while ETH only +33%.
Actionable Insight: Pay attention to the assets people are not paying enough attention to. Ethereum’s lack of spotlight combined with low prices could indicate it is oversold.
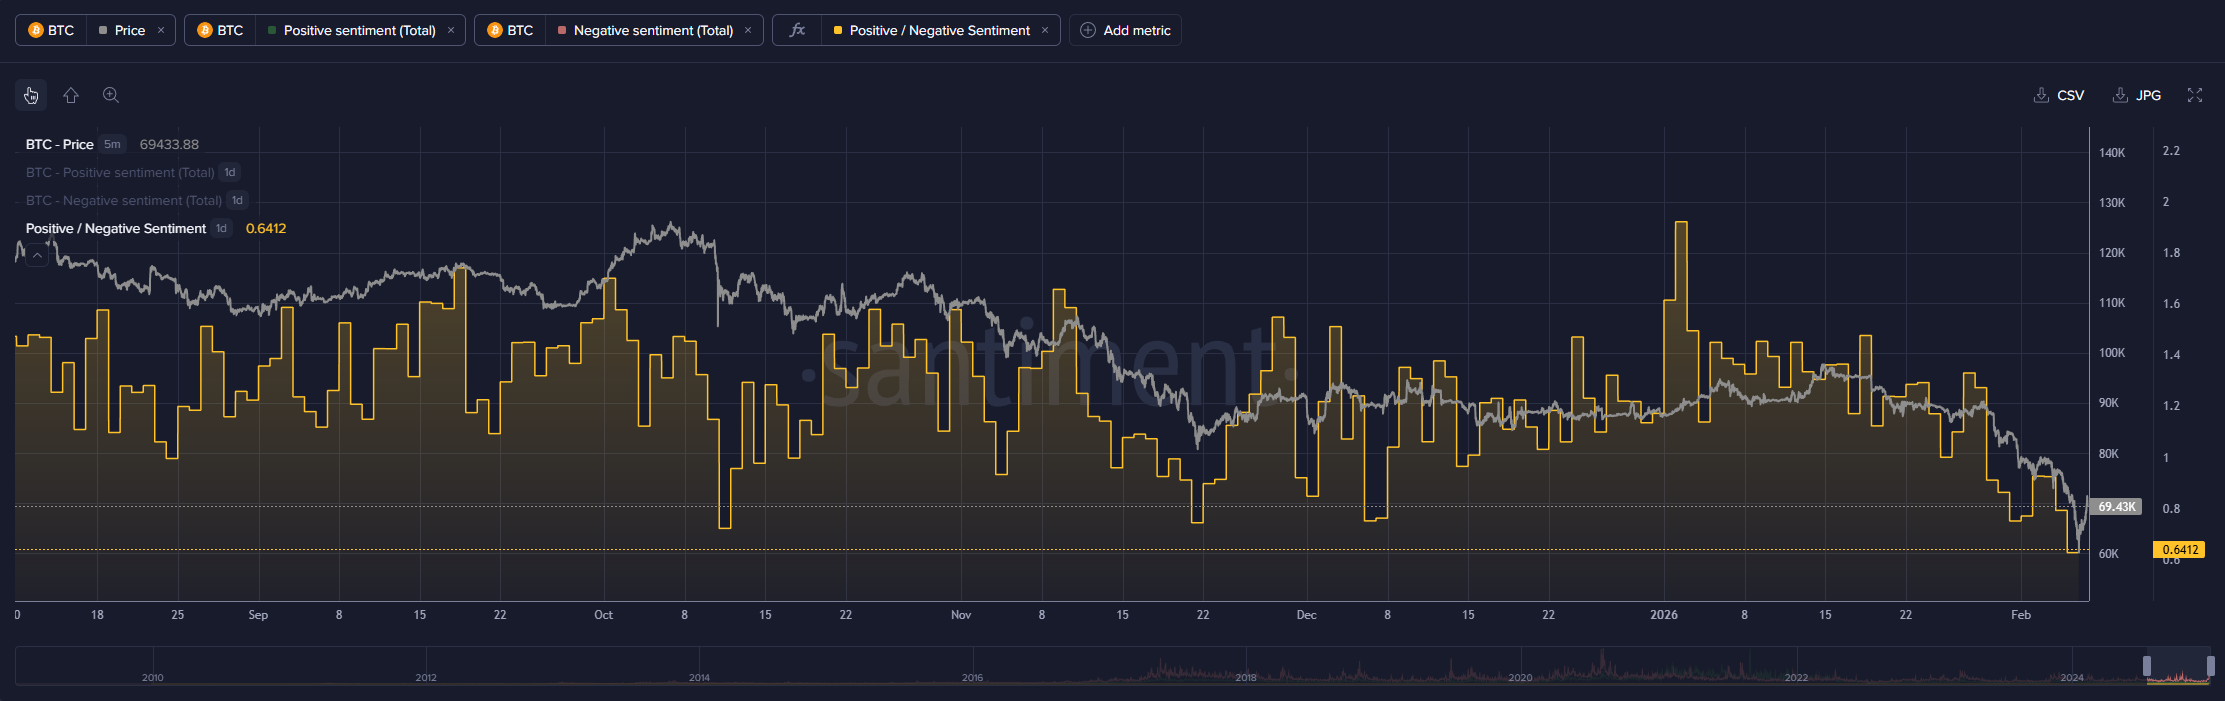
06:52 - Sentiment Ratio: Highest Negativity Since December
Crowd sentiment is fiercely bearish. The ratio of positive to negative commentary has collapsed, with negative comments hitting their highest point since December 1st (chart). Historically, markets tend to bottom and bounce exactly when the crowd becomes convinced prices will fall further, similar to the mid-November crash.
Key Data: 0.86 bullish-to-bearish ratio; highest negative comment spike since Dec 1st. Actionable Insight: High negativity is often a bullish signal. When the crowd is convinced prices will go lower, it is often the time to start looking for long entries.
09:15 - Whale Activity: Are Big Holders Accumulating Yet?
Smart money dumped roughly 89,000 Bitcoin between mid-January and now, but the bleeding appears to have stopped. In the last 24 hours, these key stakeholders added back about 3,800 BTC (chart). While small compared to the sell-off, it signals that the aggressive dumping pressure from whales may be exhausted for the moment.
Key Data: Whales dropped from 68.51% to 68.04% supply held; +3,800 BTC added in 24h. Actionable Insight: Monitor whale wallets for sustained accumulation. One day of buying is good, but a trend of buying over several days would be better for determining whether we are at a bottom.
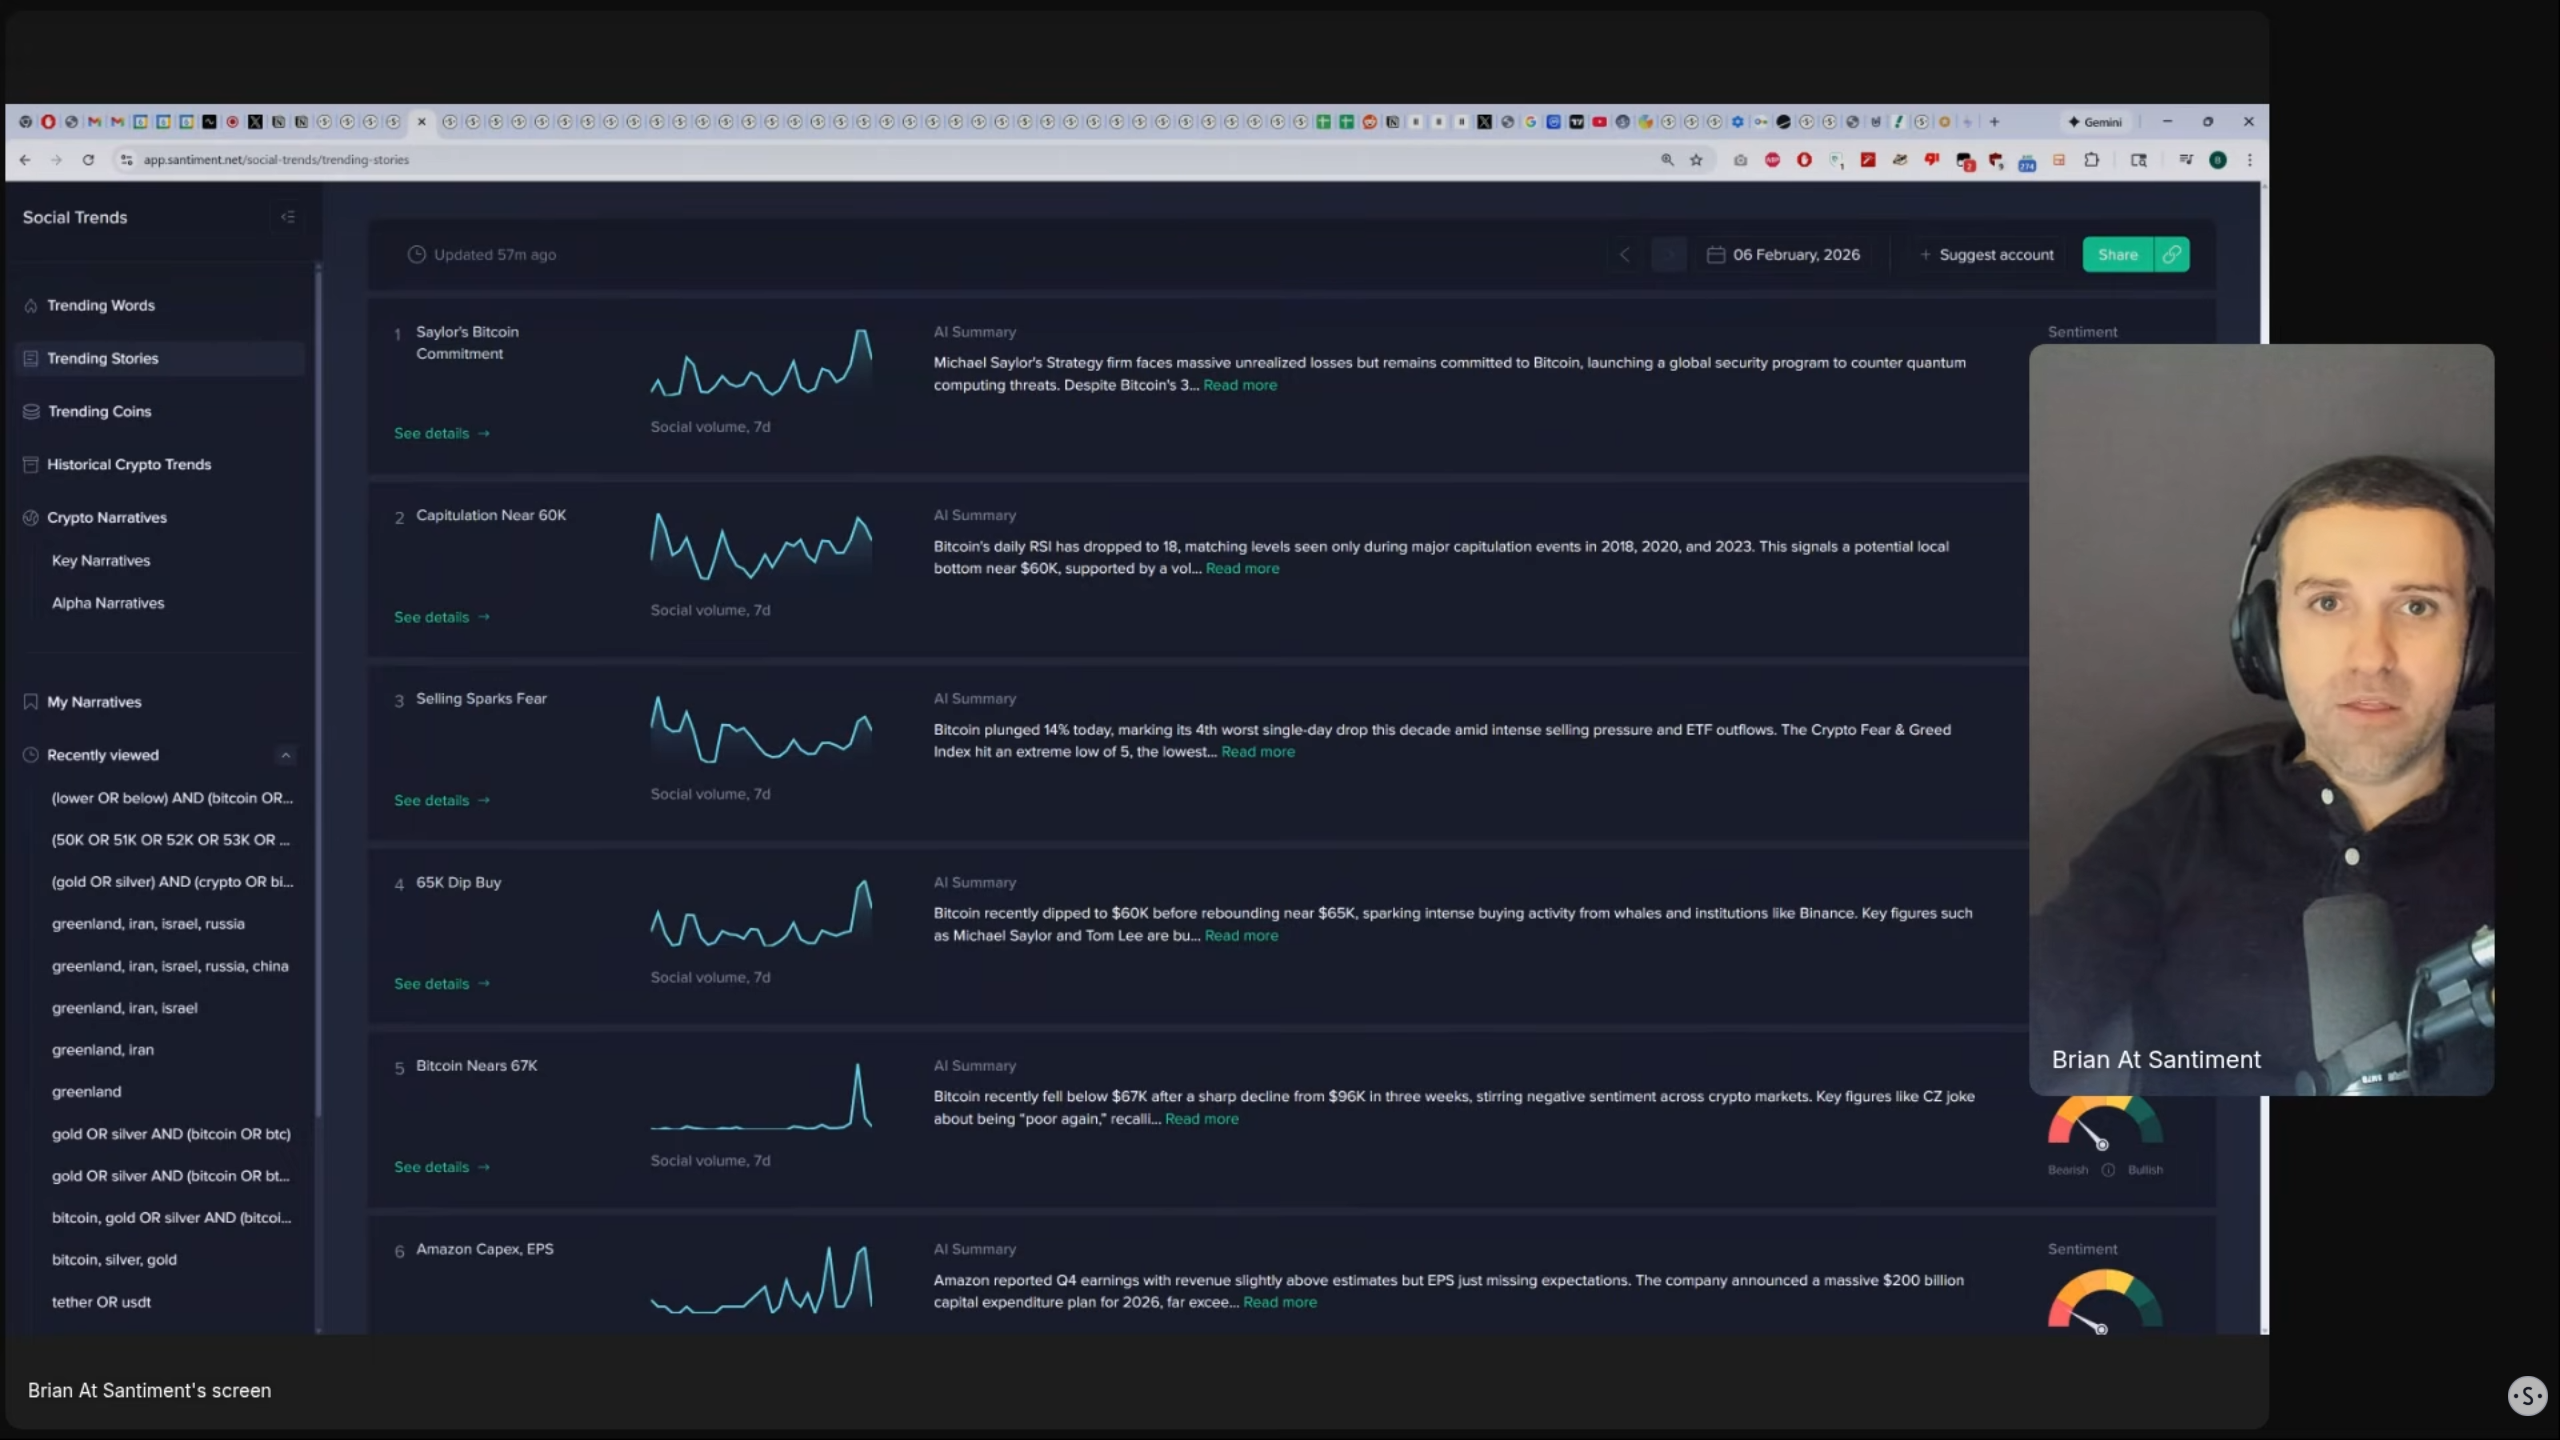
11:44 - Top Narratives: Michael Saylor & Retail Capitulation
Michael Saylor and MicroStrategy are under scrutiny as the stock drops, though they remain committed to their Bitcoin strategy. Meanwhile, "capitulation" is a top trending term. This indicates retail traders are trying to meta-analyze the market, looking for signs of others quitting to time their own entries, which often happens near bottoms.
Key Data: Top trends: "Michael Saylor," "Capitulation," "60k Support."
Actionable Insight: Be wary of popular narratives. If everyone is waiting for "capitulation," the bottom might have already happened while they were waiting for a clearer sign.
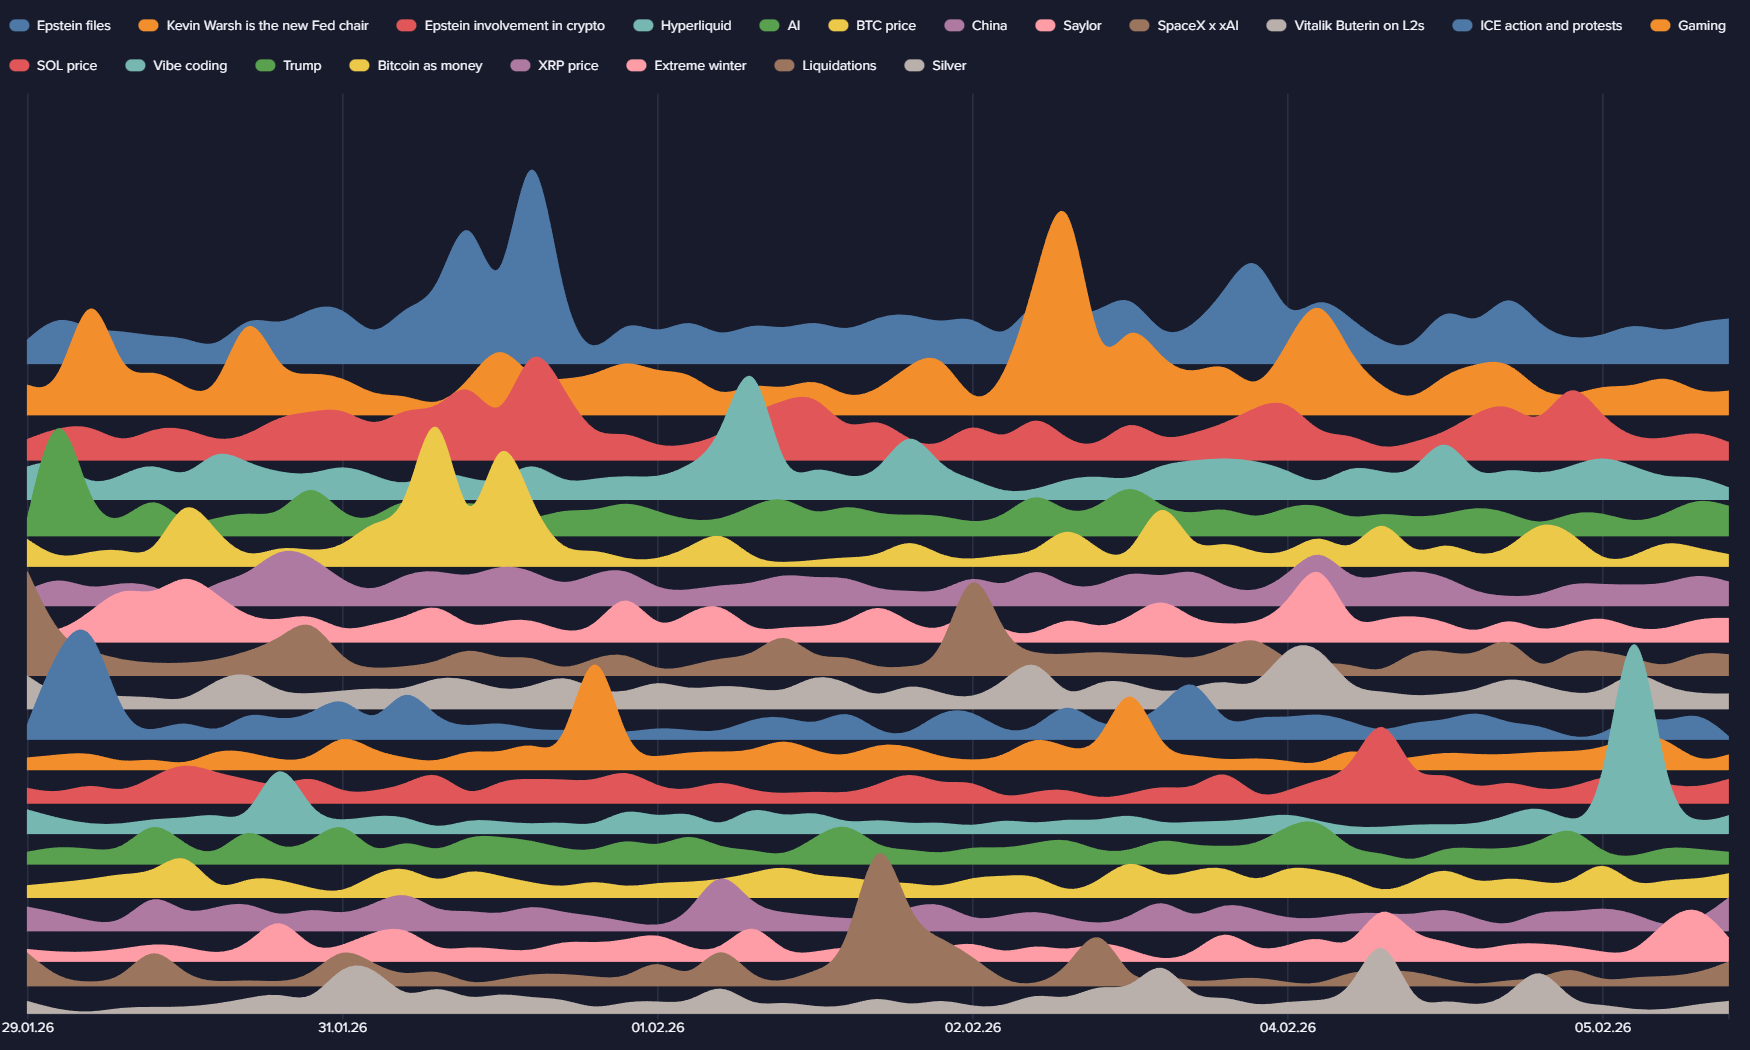
15:25 - Top Weekly Narratives: Trends Impacting Prices This Week
Beyond price, narratives like "Liquidations" and political news regarding Trump and Kevin Warsh are spiking. When specific terms like "Liquidations" trend, and the actual liquidation data confirms that many are occurring, it usually marks a local bottom as over-leveraged traders are washed out. The intense focus on price action above all else confirms fear is the primary driver.
Key Data: Trending topics include "Liquidations," "Hyperliquid," and various political topics. Actionable Insight: Use narrative trends to gauge emotional turning points. When political news overlaps with crypto crashes, volatility tends to be exacerbated.
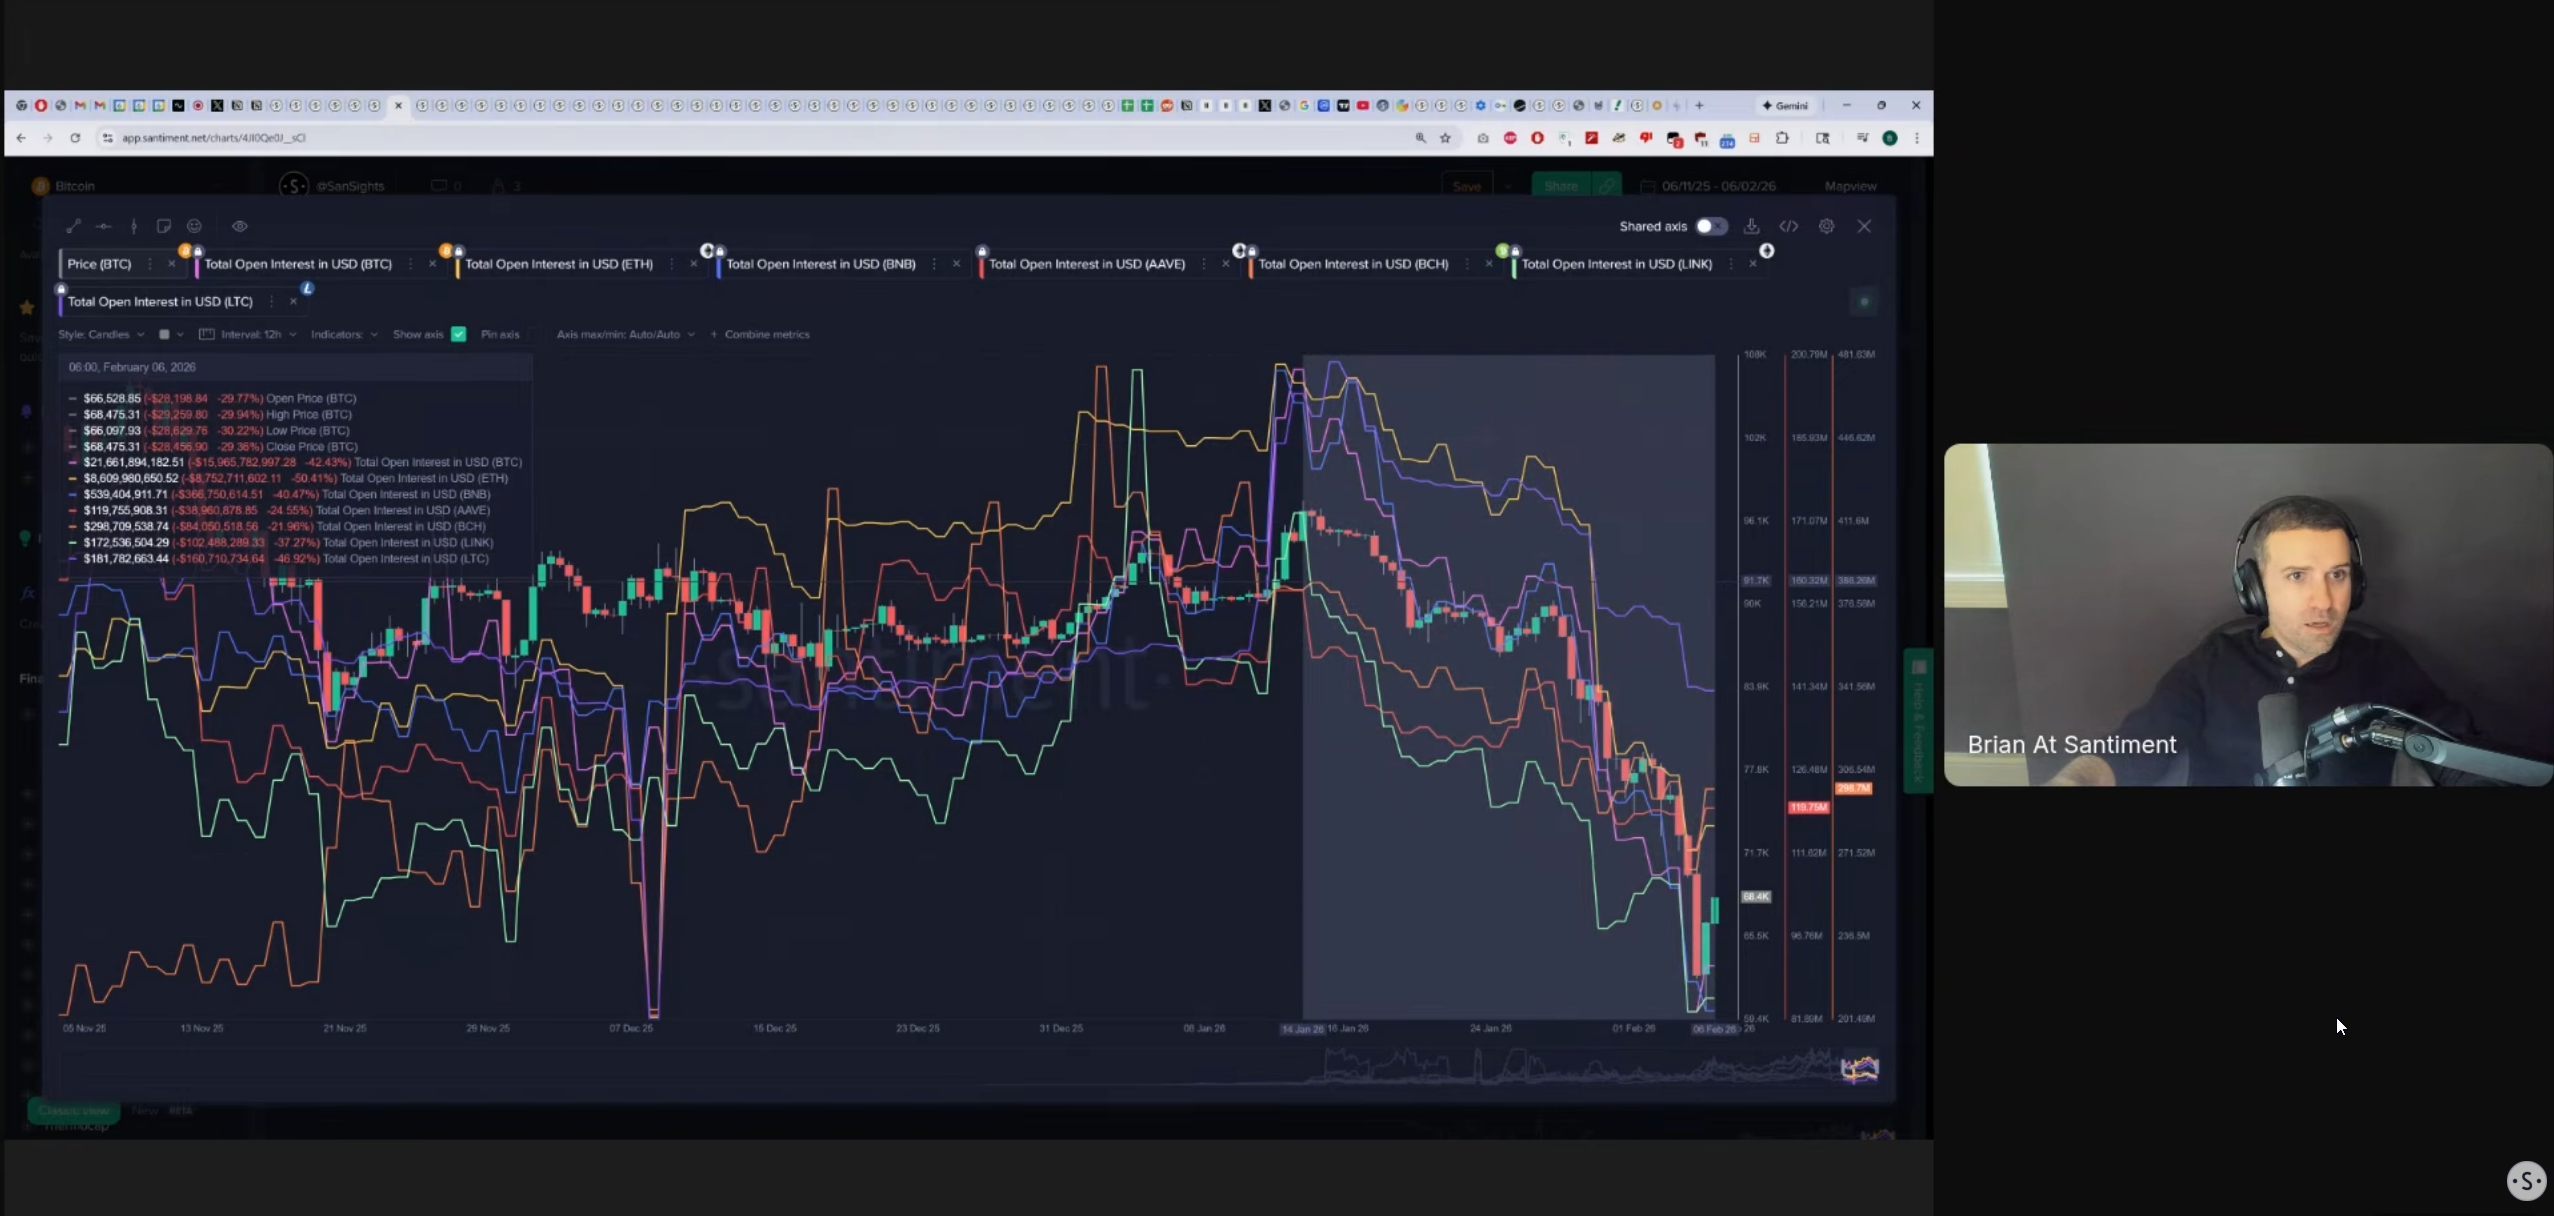
18:33 - Open Interest Data: Leverage Wiped Across the Board
Open interest (OI) has collapsed, with Bitcoin shedding over $15 billion in open contracts (chart). This massive de-leveraging removes "froth" from the system, making the market less susceptible to liquidation cascades. When OI is this low, the market is generally safer for buyers and leads to more organic price discovery phase.
Key Data: BTC Open Interest -42% ($15B drop); ETH OI -50%.
Actionable Insight: Lower Open Interest means less risk of sudden price moves or volatility spikes caused by leverage. It suggests a more organic price discovery phase is starting.
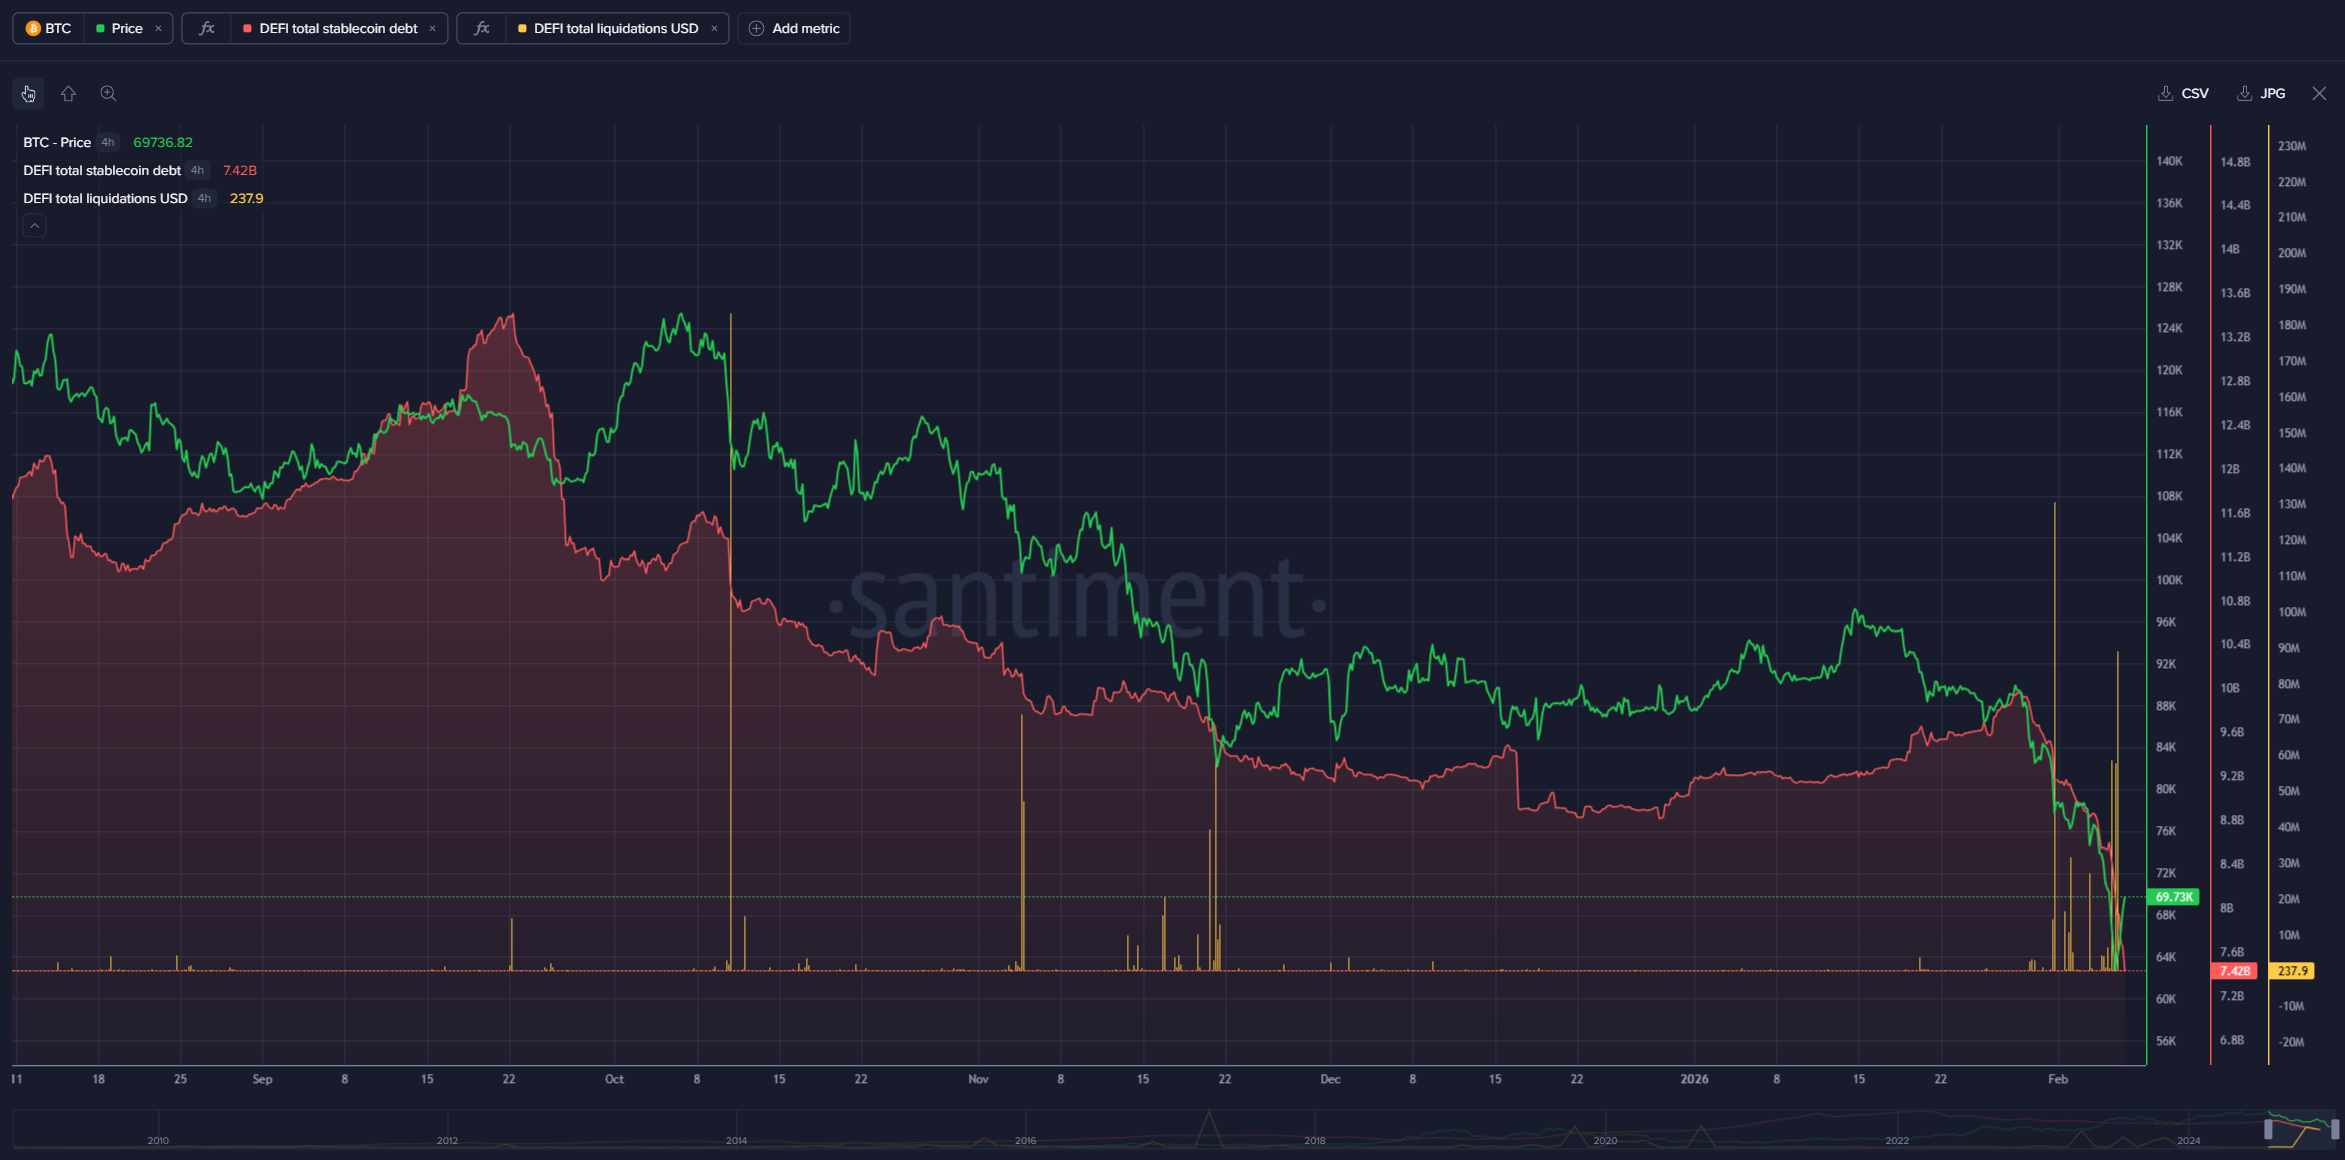
22:17 - DeFi Liquidations & Stablecoin Debt Overview
DeFi saw massive cleanups with back-to-back days of over $125 million in liquidations. Furthermore, stablecoin debt has dropped 44% since September. This indicates a massive systemic de-leveraging where users are paying back loans and exiting risk, resetting the market foundation.
Key Data: ~$260M liquidations in 48h; Stablecoin debt -44% since Sept (chart).
Actionable Insight: The market has de-leveraged. With less debt in the system, selling pressure from forced liquidations should decrease significantly. A complementary metric to look at would be stablecoin debt levels post-crash. Are people borrowing again already? If not, it may indicate there is no strong public perception that this is the bottom.
24:31 - Funding Rates: Signs of a Potential Short Squeeze
Funding rates have turned aggressively negative, reaching a four-month high in shorting behavior. This means shorts are paying longs to keep positions open. Historically, when the crowd piles into shorts after a crash, it fuels a "short squeeze" where prices rapidly reverse upwards to liquidate late bears.
Key Data: Funding rates at 4-month lows (high shorting dominance).
Actionable Insight: Watch for a "short squeeze." If prices tick up slightly, aggressive shorters will be forced to buy back, propelling the price higher quickly.
27:03 - On-Chain Vitals: Transaction Volume & Address Spikes
Volatility is waking up the network. BTC Transaction volume recently hit November highs, and daily active addresses spiked to levels not seen since September, suggesting huge retail activation. This spike in utility suggests that despite bearish price action, fundamental usage and interest in Bitcoin have increased. Price volatility is what causes these big spikes, and whether it's panic selling or dip buying, the polarity is usually a net positive. It's when there is slowly fading active addresses and network growth when we should be most concerned.
Key Data: Transaction vol ~$41B; 845k Daily Active Addresses (highest since Sept).
Actionable Insight: Price drops accompanied by spikes in user activity can be interpreted as bullish divergences.
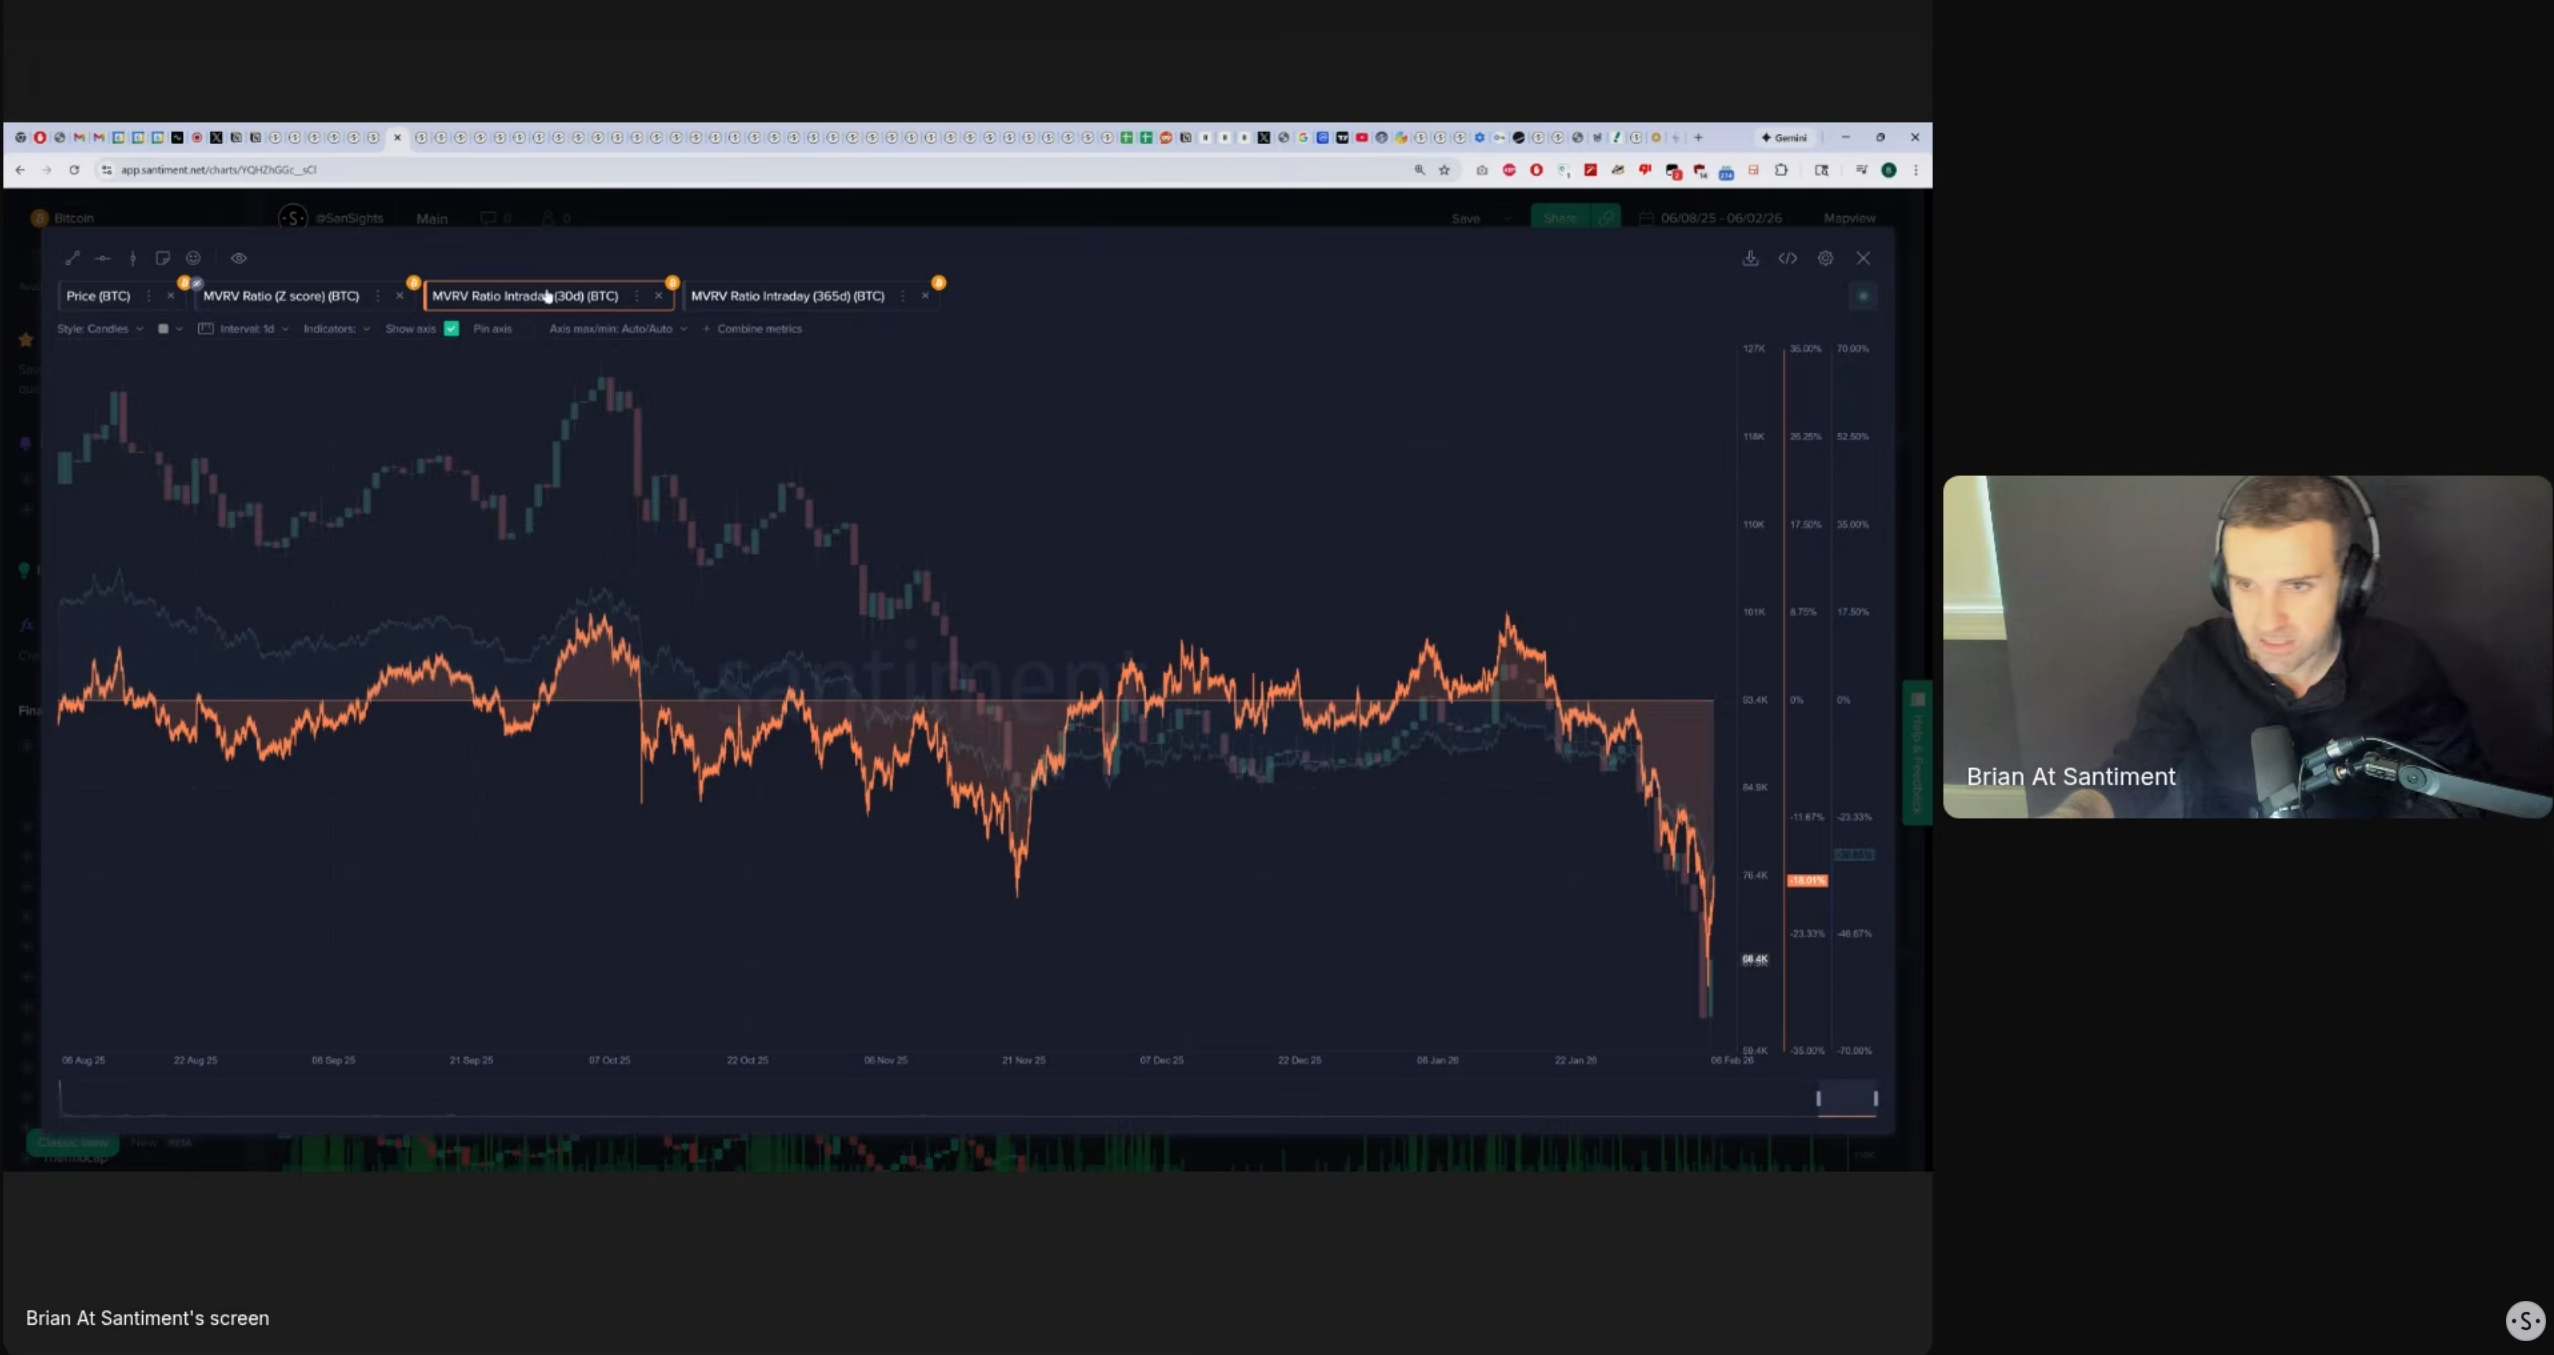
29:56 - Bitcoin MVRV: A Historic Opportunity Signal?
The Market Value to Realized Value (MVRV) ratio, aka the metrics that shows whether the average trader during a certain timeframe is in profit or not, is at its lowest point since January 2023—the bottom of the last bear cycle. This confirms average holders are deep underwater. Mathematically, buying when the 365-day MVRV is this low historically yields the best long-term risk-reward returns.
Key Data: 365-day MVRV at -31%; lowest level in 3 years.
Actionable Insight: When this metric is at a historic low, the risk-reward ratio is heavily skewed in favor of buyers.
33:51 - Ethereum Deep Dive: Network Growth vs "Blood in Streets"
Ethereum shows extreme divergence: prices are tanking, yet network growth is hitting six-month highs with ~380k new wallets daily. With yearly MVRV at -37%, ETH is in "blood in the streets" territory. This combination of high utility and rock-bottom sentiment suggests ETH is severely undervalued.
Key Data: +380k new ETH wallets/day; 365-day MVRV at -37%.
Actionable Insight: Ethereum looks like a coiled spring. The high usage combined with extreme capitulation in price makes it a prime candidate for a reversal.
39:13 - XRP Analysis: Short-Term Risk vs Long-Term Setup
XRP is a mixed bag. Short-term metrics show limited upside compared to BTC due to its recent resilience, but long-term metrics are promising. With a 365-day MVRV of -36.5%, it is as oversold as the rest of the market, offering potential for those willing to stomach the volatility.
Key Data: Short-term MVRV -8%; Long-term MVRV -36.5%.
Actionable Insight: XRP is a riskier play short-term due to recent recovery, but long-term metrics suggest it is just as undervalued as the rest of the market.
Conclusion
The data shows fear is high, leverage is gone, and prices are undervalued. While risks remain, on-chain signals like MVRV and negative funding rates suggest a recovery is likely.
Spotting, analyzing, and understanding the markets is easier with the right tools and a strong like-minded community. Sign up for app.santiment.net and join our discord for more frequent and timely analysis of the crypto markets.
For more data-driven crypto analysis, subscribe to our YouTube channel, our Substack, or follow us on Santiment Insights.