
This Week in Crypto, Full Written Summary: W1 August

Crypto at a Crossroads: Whale Moves, ETF Outflows, and Political Tremors
Introduction
Welcome to your weekly summary of the crypto markets. In this week's analysis from Santiment, we explore a market that is feeling the pull of both internal and external forces. As we step into August, the landscape is shaped by everything from massive billion-dollar whale transactions to new White House policies and shifting institutional sentiment.
This week's livestream offers a data-driven look at the market's health, moving beyond price charts to uncover the stories hidden in on-chain activity. We'll look at why a surge in "buy the dip" chatter could be a trap, how Ethereum's network is quietly hitting major milestones, and what one metric says about XRP's long-term potential. Let's review the key insights.
How Trump's Tariffs & Global Politics Are Driving Crypto Prices
Crypto no longer operates in a vacuum. The market is increasingly connected to global politics and traditional finance. Brian pointed out that recent news, like potential US tariff hikes on Canada and India's trade responses, directly influences market sentiment. As crypto becomes more institutionalized, its price action shows a stronger link to the S&P 500.
- Key Data: Crypto prices are showing an increasing correlation with the S&P 500, reacting to global tariff news.
- Actionable Tip: Pay attention to major geopolitical news and stock market trends, as they now have a direct impact on crypto prices.
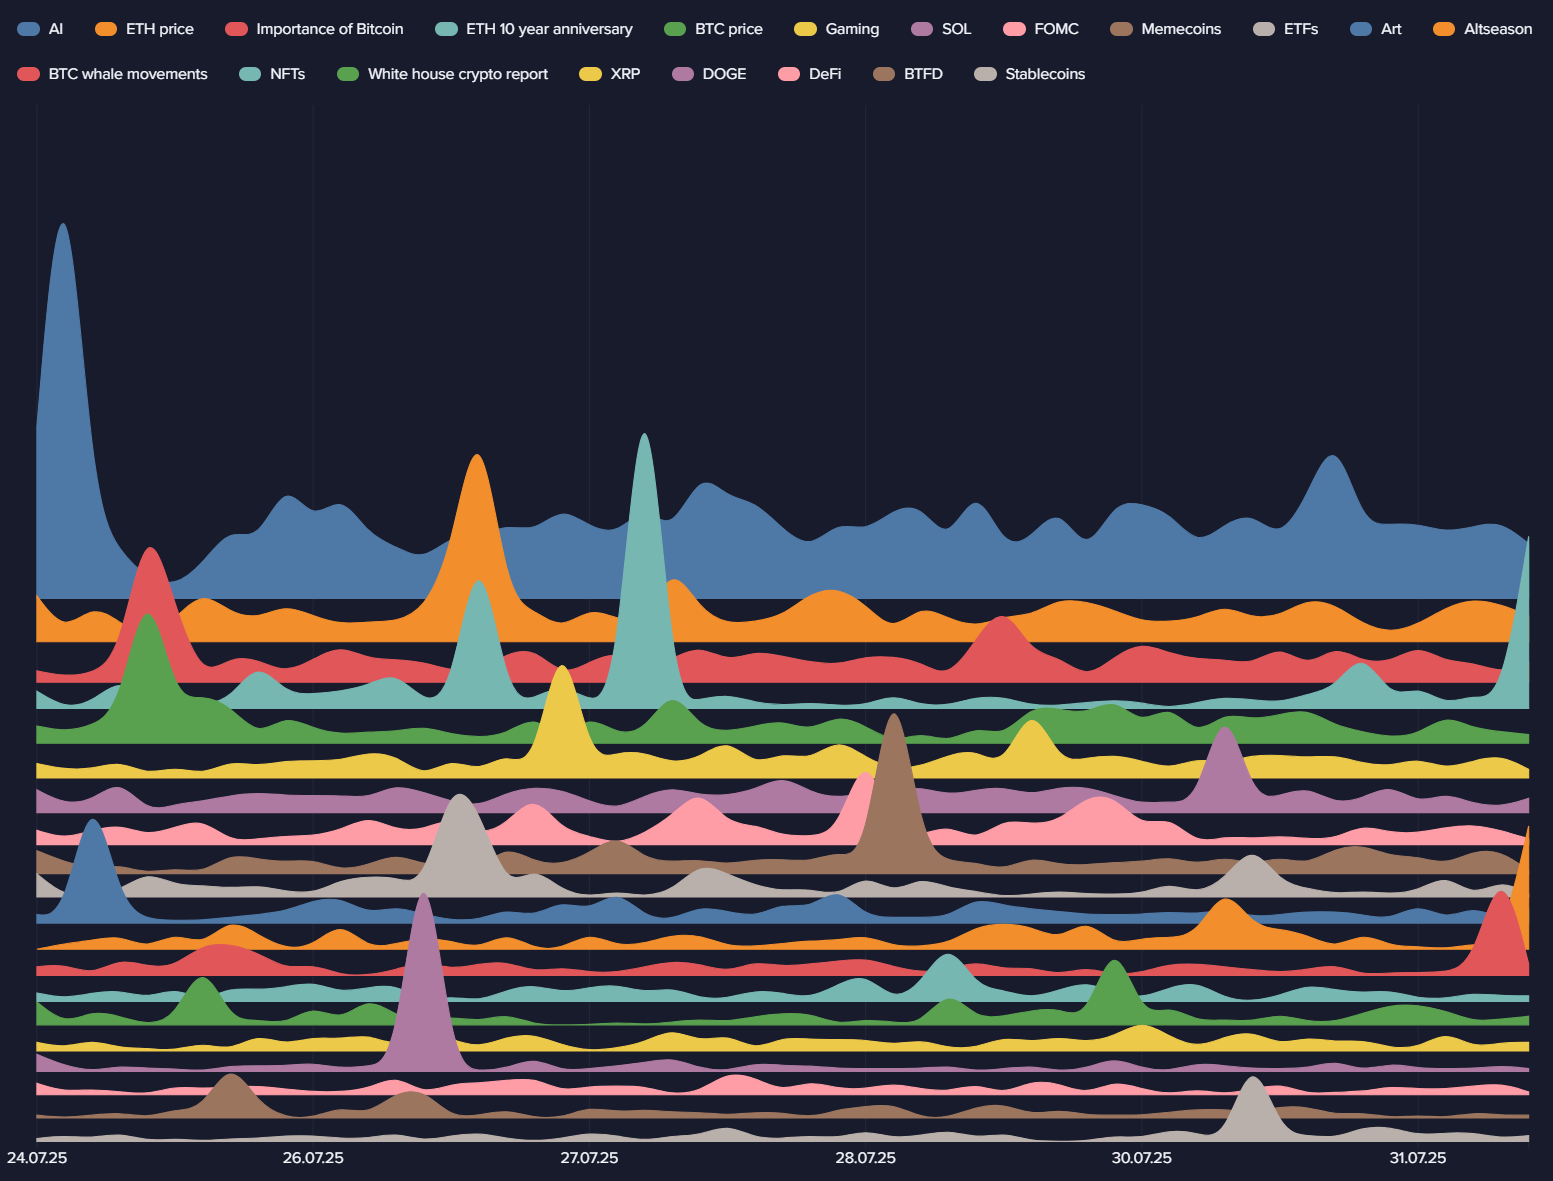
The AI Narrative is Back: ChatGPT-5 Hype & AI-Generated NFTs
The powerful narrative connecting Artificial Intelligence and crypto is gaining momentum again. A significant spike in social media discussion about AI occurred on July 24th, driven by two key topics: the creation of NFTs using AI and the high anticipation for OpenAI's ChatGPT-5. This renewed interest had a tangible impact on the market.
- Key Data: AI-related crypto projects like Render (RNDR) experienced "mini breakouts" following the surge in social media discussion.
- Actionable Tip: Track emerging social narratives on Santiment to spot which sectors might see increased volatility and interest.
A Massive Bitcoin Whale Moves Nearly $2 Billion in a Single Transaction
A colossal on-chain transaction recently put the market on high alert. A single wallet moved 17,228 BTC. This was the second-largest transaction of the past month, following an even bigger move of 77,446 BTC on July 16th that occurred just as Bitcoin hit its all-time high.
- Key Data: A 17,228 BTC transaction was spotted, following a 77,446 BTC move that coincided with the market top.
- Actionable Tip: Use on-chain transaction trackers to monitor large whale movements, especially around key price levels, as they can signal potential tops or bottoms.
White House Crypto Report: What the Trump Administration's Policy Means for You
Regulatory clarity continues to be a major topic, and the White House has weighed in with a new crypto policy report. The document focuses on the tokenization of assets and upcoming regulations, signaling a more structured approach from the government. The report also mentions a "strategic national stockpile" of crypto.
- Key Data: The White House report focuses on tokenization and the feasibility of a "strategic national stockpile."
- Actionable Tip: Keep an eye on official government reports and policy announcements, as regulatory clarity is a major long-term market driver.
"Buy The Dip" Trends: Why This Could Be a Trap for Retail Investors
As Bitcoin's price has seen a minor retrace, social media platforms are buzzing with calls to "buy the dip." On-chain data shows that this sentiment is at a one-month high. However, Brian presented this as a potential counter-indicator, as widespread retail greed often precedes further price drops.
- Key Data: Social volume for "buy the dip" is at its highest level in a month.
- Actionable Tip: Be cautious when social media sentiment is overwhelmingly one-sided. High "buy the dip" chatter can indicate retail greed, providing liquidity for whales to sell into.
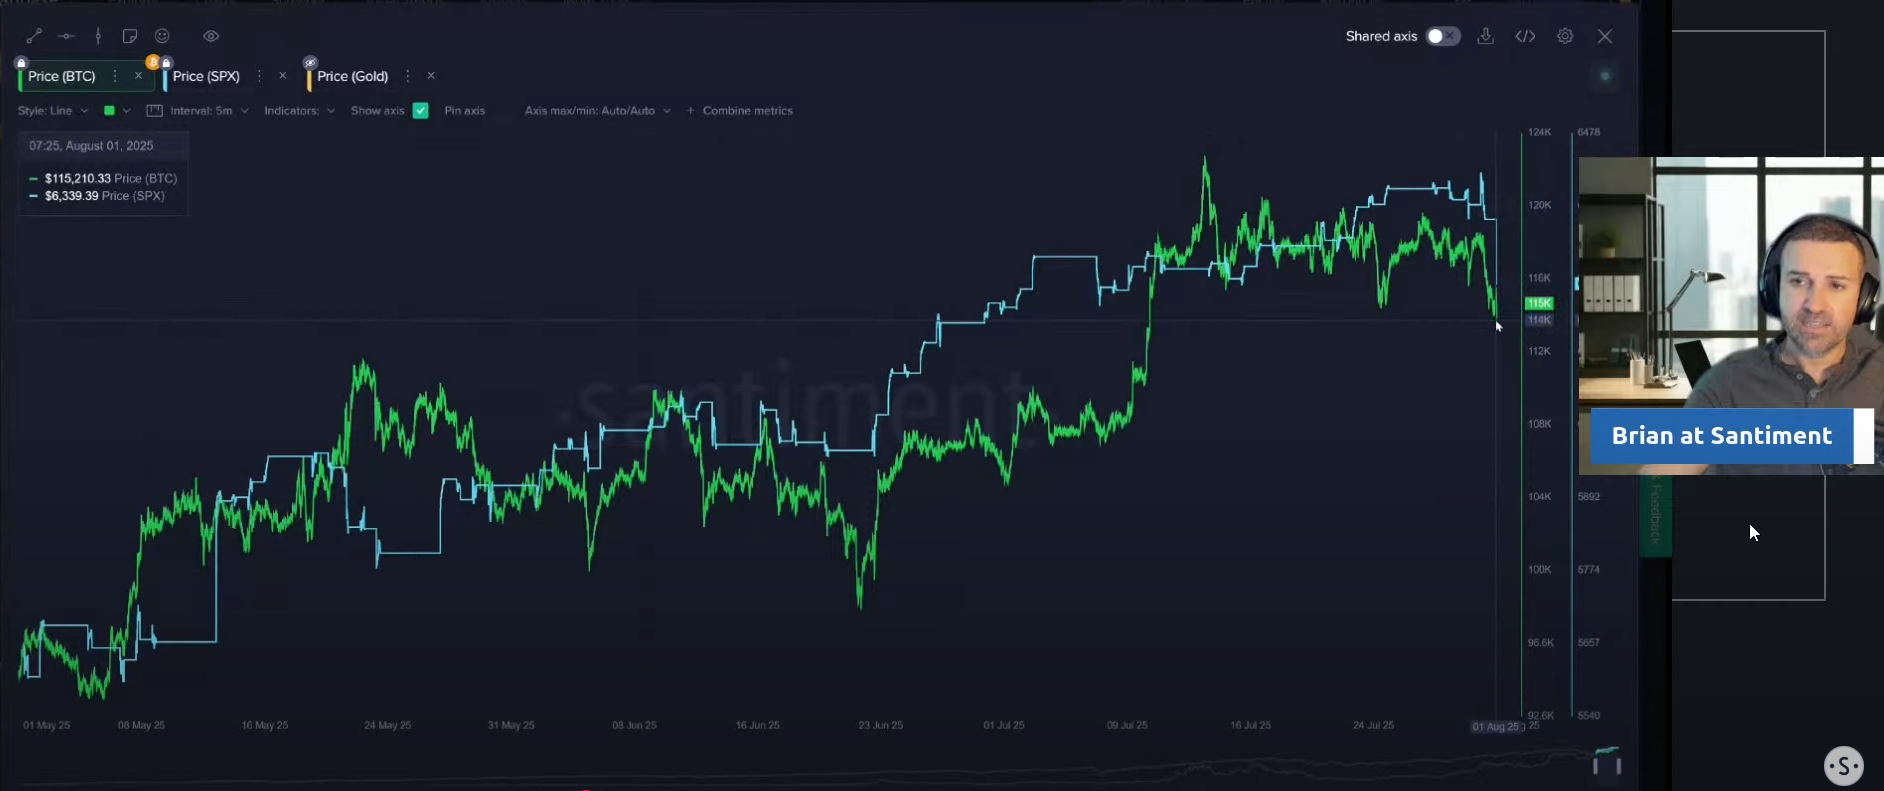
Bitcoin vs. S&P 500: The Tight Correlation You Can't Ignore
The close relationship between Bitcoin and the stock market is undeniable right now. Brian showed a chart where Bitcoin's price movement is tightly mirroring the S&P 500. In a classic flight to safety, gold is moving in the opposite direction of both Bitcoin and stocks, rallying on the back of economic uncertainty.
- Key Data: Bitcoin and the S&P 500 are moving in lockstep, while gold is showing an inverse correlation.
- Actionable Tip: Watch the S&P 500's daily performance and factors of influence to get a better sense of Bitcoin's likely short-term direction.
ETF Outflows Signal Trouble? A Look at Institutional Money Flow
Bitcoin ETFs were a primary engine for the recent rally, but the flow of institutional money may be slowing. After a long stretch of strong inflows, the market just saw a "sizable outflow day." This is a development worth watching closely, as so much of the recent price surge was built on this institutional momentum.
- Key Data: There have been net outflows on four of the last nine trading days.
- Actionable Tip: Follow daily Bitcoin ETF flow data. Sustained outflows could signal weakening institutional demand and a potential headwind for prices.
The Psychology of a Dip: Is This "Disguised FOMO"?
The current market sentiment is a paradox. While overall sentiment appears neutral, the widespread discussion about which low price to buy back in at reveals an underlying bullishness. Brian described this behavior as a form of "disguised FOMO," where traders risk missing opportunities by waiting for a perfect entry that may never arrive.
- Key Data: Traders are publicly targeting specific low prices to buy back in, a sign of underlying bullishness.
- Actionable Tip: Evaluate your own entry and exit targets. Setting price targets based on crowd sentiment can lead to missed opportunities or poor decisions.
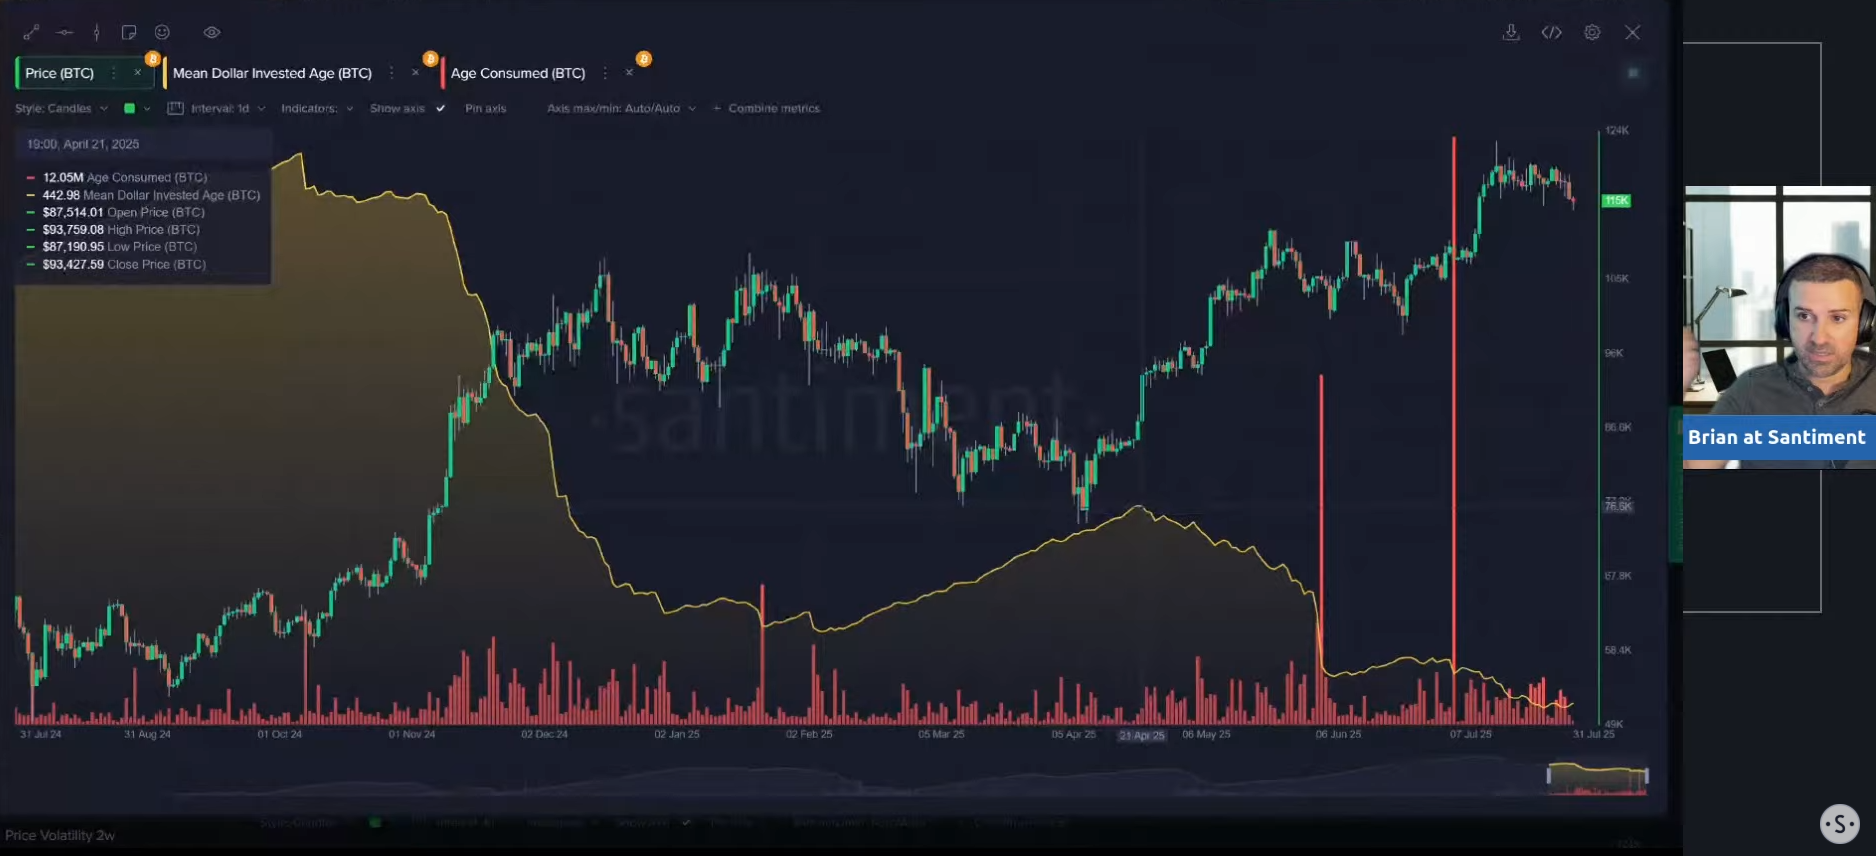
A Key Bullish Signal? Why "Old" Bitcoin Moving is a Good Thing
One of the most encouraging on-chain metrics for Bitcoin is the Mean Dollar Invested Age. This indicator, which tracks the average age of all coins on the network, is currently declining. This is a healthy sign, as it means dormant coins are moving back into circulation, preventing stagnation and providing liquidity.
- Key Data: The Mean Dollar Invested Age is declining, indicating dormant coins are re-entering circulation.
- Actionable Tip: Monitor the Mean Dollar Invested Age trend. A continued decline suggests a healthy, liquid market, while a rising trend could signal stagnation.
Ethereum's Network is Exploding: On-Chain Metrics Hit 1-Year Highs
While Bitcoin's on-chain activity remains stable, Ethereum's network is showing incredible strength. Key metrics are flashing bright green, with Daily Active Addresses hitting a one-year high. In a single week, the network added over one million new addresses, suggesting real and growing adoption.
- Key Data: Ethereum's Daily Active Addresses reached a one-year high, with over 1 million new addresses created in one week.
- Actionable Tip: Look beyond price and track fundamental network growth metrics like active addresses. Sustained growth can indicate strong long-term value.
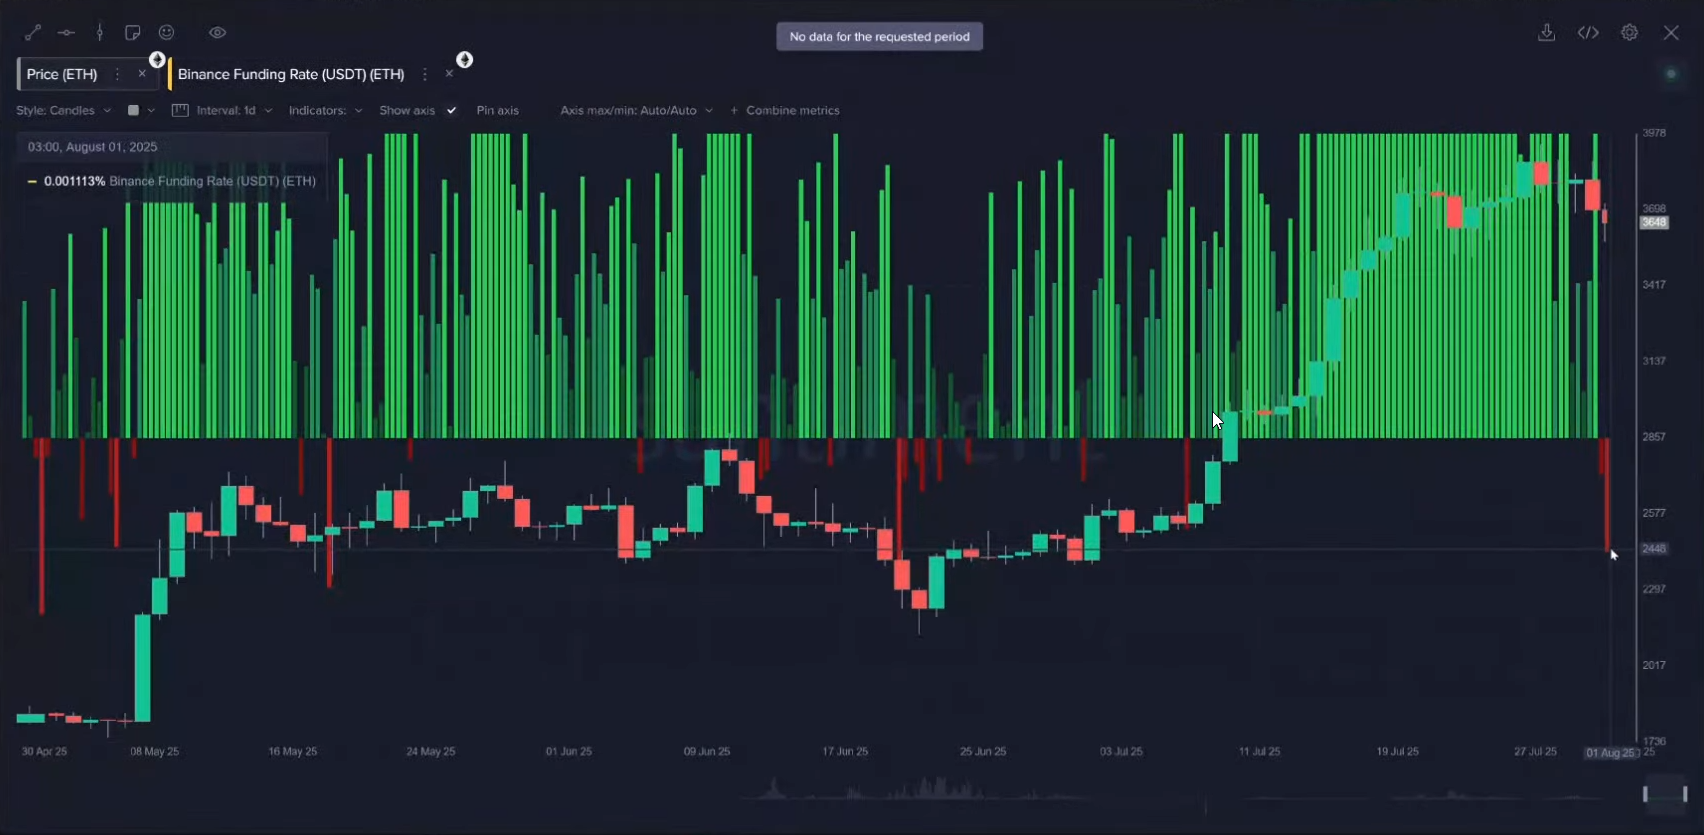
Traders Are Aggressively Shorting Ethereum - What Happens Next?
A fascinating split is emerging in the Ethereum market. While long-term on-chain metrics look strong, derivatives traders are increasingly betting on a price drop. Data from exchanges like Binance shows a significant spike in short positions against ETH, the largest since late June. This could provide "rocket fuel" for a rally if a short squeeze occurs.
- Key Data: Binance saw its biggest spike in ETH short positions since June 20th.
- Actionable Tip: Watch derivatives funding rates. Heavily negative rates (indicating a high volume of shorts) can signal the potential for a "short squeeze" if the price starts to rise.
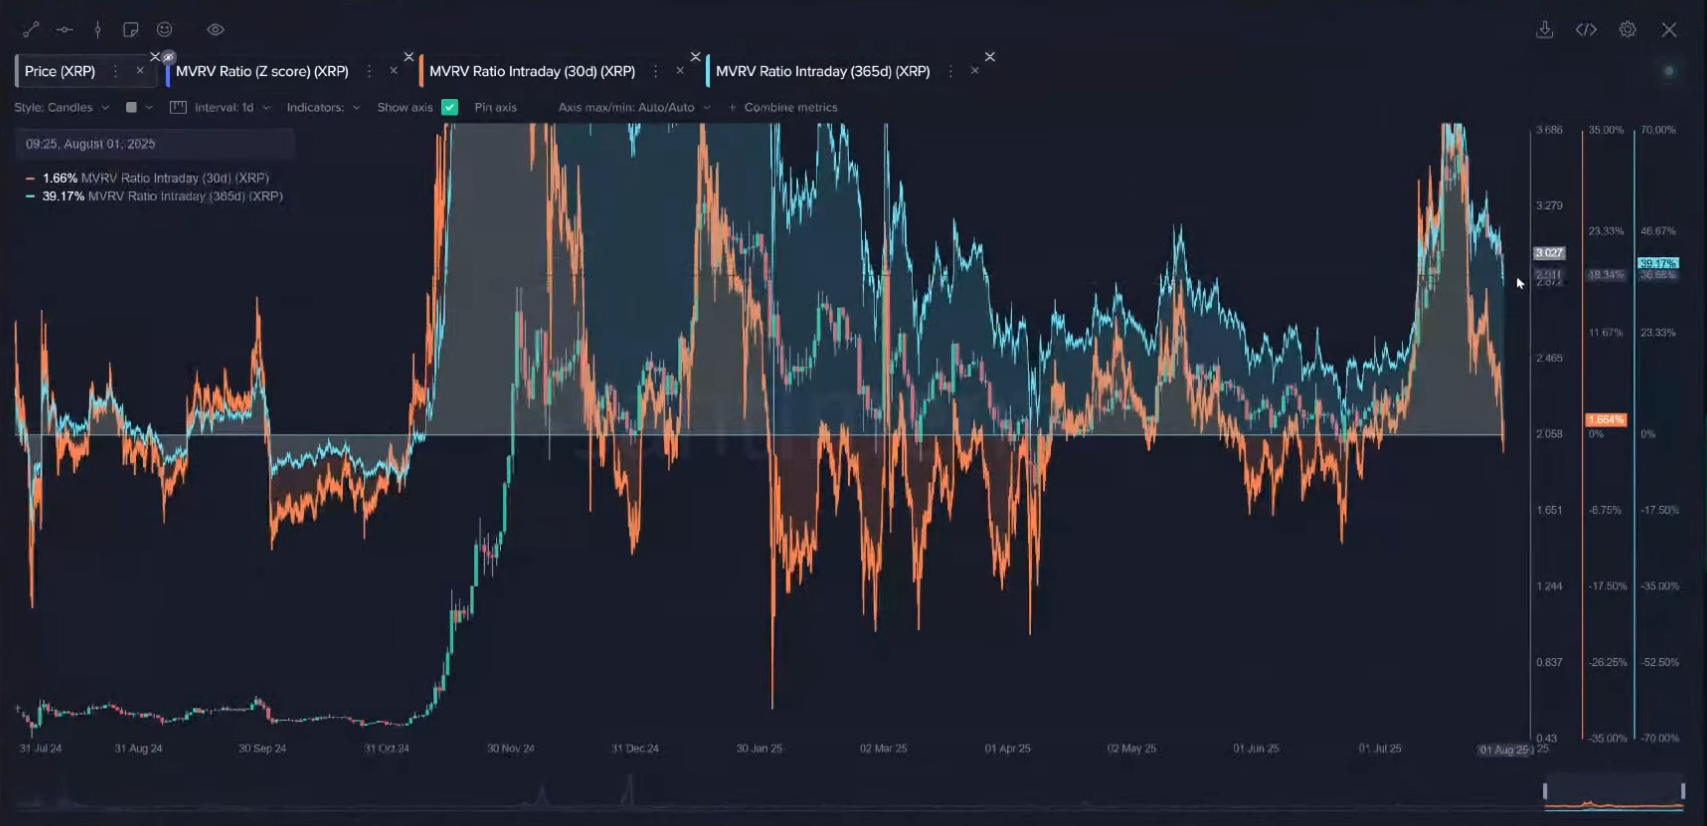
XRP's Massive Rally: The "Massive Red Flag" That Signaled the Top
XRP's incredible 77% price rally was a major story in July, but on-chain data offered a clear warning sign at its peak. The MVRV ratio, which indicates the average profit of all holders, soared to unsustainable levels. At the top, the 365-day MVRV was over +70%, signaling the market was extremely overheated.
- Key Data: At XRP's price peak, the 365-day MVRV was over +70%, a massive red flag for an overheated market.
- Actionable Tip: Use the MVRV ratio to gauge whether an asset is overvalued. Extremely high MVRV levels often signal that a market top is near.
The Most Bullish Long-Term Metric for XRP is at a 4-Year Low
Despite its recent price correction, a powerful long-term indicator for XRP is painting a bullish picture. The Mean Dollar Invested Age, the average age of every dollar invested into the market cap of a coin, for XRP has fallen to its lowest point in four years. This is a sign of network health, showing that dormant coins are consistently being moved and recirculated.
When MDIA moves down, it's because older wallets (especially whale wallets) are moving enough coins to make the overall average age of investment get younger
And when it gets younger, it's typically due to more investors per existing coin, which improves the ability for a network to grow and gain utility. Almost any scenario is better than the majority of tokens just sitting in whale wallets and not being moved... because this leads to network stagnancy and being unable to move forward in the asset's quest for increased adoption and added utility.
- Key Data: XRP's Mean Dollar Invested Age is at its lowest point in four years, a sign of a highly active network.
- Actionable Tip: For long-term analysis, consider metrics like Mean Dollar Invested Age. A consistently declining value suggests a healthy, active network, even if short-term prices are volatile.
MicroStrategy's Shocking 46,000% Earnings Beat & What It Means for BTC
MicroStrategy, the world's largest corporate holder of Bitcoin, just posted a phenomenal second-quarter earnings report. The company announced a 46,000% earnings-per-share (EPS) beat, a stunning figure that underscores the success of its strategy to hold Bitcoin on its balance sheet.
- Key Data: MicroStrategy reported a 46,000% EPS beat in its Q2 earnings.
- Actionable Tip: Follow the earnings reports of major publicly traded crypto holders like MicroStrategy. Their financial performance can influence broader market sentiment toward corporate crypto adoption.
Conclusion
The crypto market is at a fascinating juncture. On one hand, on-chain data reveals underlying strength in networks like Ethereum and XRP. On the other, external factors like global politics and shifting ETF flows are creating uncertainty for Bitcoin. The key takeaway is that a data-driven approach is more valuable than ever. Metrics like MVRV and Mean Dollar Invested Age can help cut through the noise and reveal what is really happening beneath the surface.
To gain your own insights and stay ahead of the market, explore the tools available on Santiment. Thank you for reading, and we'll see you next week for another market breakdown.