
Santiment Market Anomaly Report: W4 March 2026

In-Depth Analysis of Data Anomalies from the Crypto Market
Report window: 2026-03-20 04:00:00 to 2026-03-26 23:00:00 UTC
Generated on: 2026-03-27
Summary
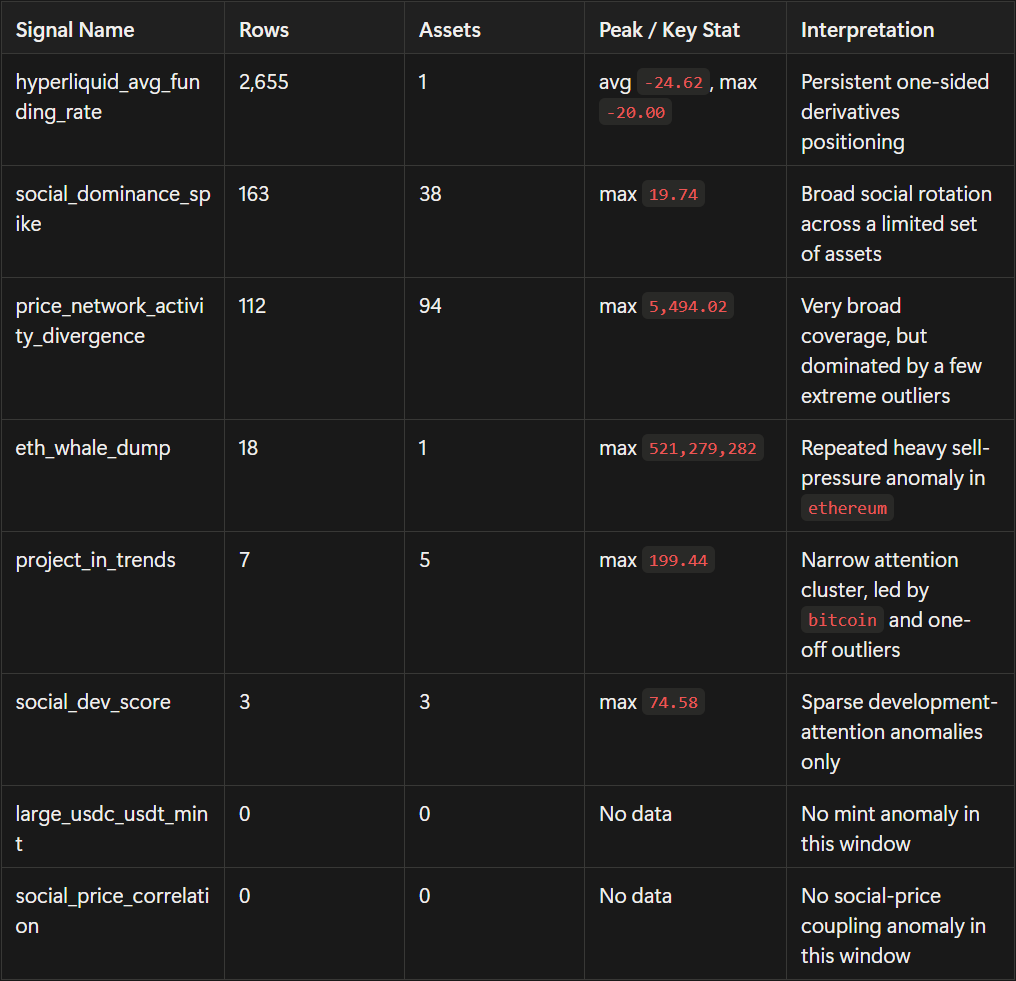
Over the past 7 days, the active signals were hyperliquid_avg_funding_rate, social_dominance_spike, price_network_activity_divergence, eth_whale_dump, project_in_trends, and social_dev_score, producing 2,958 observations across 140 assets. The market structure was dominated by three themes: persistently negative hyperliquid_avg_funding_rate, repeated eth_whale_dump events on ethereum, and a broad but uneven social_dominance_spike rotation across mid-cap and thematic names.
The clearest structural signal was still derivatives stress. hyperliquid_avg_funding_rate alone contributed 2,655 observations with an average of -24.62, while eth_whale_dump printed 18 times with a peak value of 521,279,282. By contrast, large_usdc_usdt_mint and social_price_correlation did not trigger at all in this window, so there was no new evidence of a stablecoin mint shock or a broad social-price coupling anomaly this week.
Signal Coverage
Key Findings
1. Hyperliquid remained the dominant structural anomaly: crowded shorting
hyperliquid_avg_funding_rate was the highest-volume signal in the dataset by a wide margin:
- 2,655 observations
- average
-24.62 - median
-23.21 - p90
-20.61 - active from
2026-03-20 07:39:00through2026-03-26 23:00:00
This was not a noisy burst. It reflected a sustained period of deeply negative funding, which usually means a crowded short or persistently bearish positioning regime. It did not automatically imply lower prices ahead, but it did mean market structure stayed imbalanced through nearly the entire week.
2. Ethereum carried the clearest discrete spot-market risk: whales dumped
eth_whale_dump triggered 18 times and every event was on ethereum. The top cluster was concentrated on 2026-03-22, when the signal printed:
521,279,282at09:46:11521,279,236at09:48:11521,279,226at09:49:59104,278,859at09:55:35
That sequence looked less like a one-off anomaly and more like a concentrated distribution episode. Even though the weekly average was pulled down by smaller events later in the window, the extreme values on 2026-03-22 were large enough to keep ethereum at the top of the risk stack.
3. Price-network divergence was broad, but not uniformly strong
price_network_activity_divergence covered 94 assets, yet the distribution was highly skewed. A few names dominated the top end:
cvault-financeat5,494.02pufethwith 3 observations and a peak of2,320.13chain-key-ethereumat2,147.19makerat1,728.75
After that, signal intensity dropped sharply. Most assets were close to zero. The practical read is that a handful of assets deserved attention, while the long tail was mostly weak background noise.
4. Attention signals were selective rather than synchronized
social_dominance_spike was the broadest attention signal, with the highest values concentrated in:
nervos-networkat19.74usddat15.33thorchainat13.94bittensorwith 19 observations and a peak of12.02ethereum-name-servicewith 17 observations and a peak of10.19
project_in_trends was much narrower. It only covered 5 assets, and the main actionable pattern was repeated bitcoin activity:
bitcoin: 3 observations, peak150.31siren-bsc: 1 observation, peak199.44tether: 1 observation, peak194.03ripple-usd: 1 observation, peak114.69usd-coin: 1 observation, peak109.58
social_dev_score barely triggered at all, with only 3 observations across etherisc, o-worldcoin-org, and worldcoin-org. That was too sparse to support a broad development-led market call.
Cross-Signal Insights
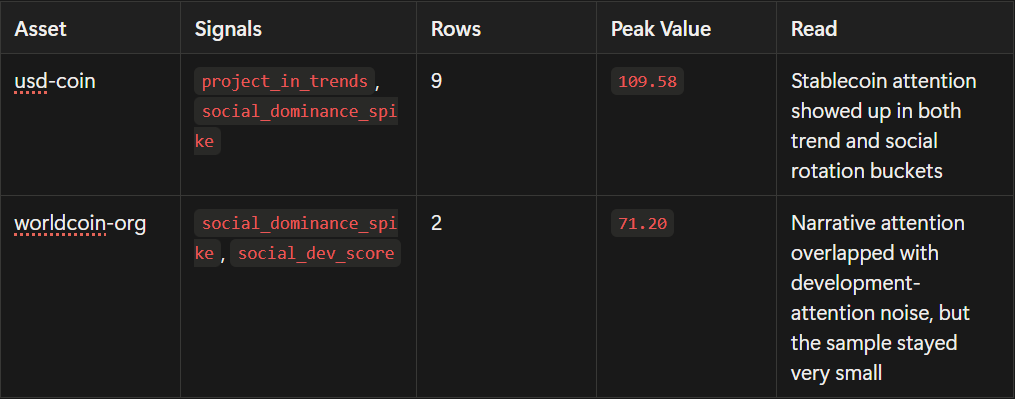
Only two assets appeared across multiple active signals during this window:
Risk Assessment
High priority
ethereumRepeatedeth_whale_dumpclusters, especially the extreme prints on2026-03-22, made it the clearest spot-market risk in this report.hyperliquid_avg_funding_rateSustained negative funding across the full week meant derivatives positioning remained structurally crowded.
Medium priority
cvault-finance,pufeth,chain-key-ethereum,makerThese were the mainprice_network_activity_divergenceoutliers and deserve validation against secondary data before being treated as conviction signals.bittensor,nervos-network,thorchain,ethereum-name-serviceThese led the social rotation basket and are the best candidates for follow-up checks insidesocial_dominance_spike.bitcoinIt was the only asset with repeatedproject_in_trendsconfirmation, which made it more actionable than the one-off names in that signal.
Lower priority
etherisc,worldcoin-orgDevelopment-attention anomalies were too sparse to support a strong weekly read.usd-coin,tetherUseful as context for liquidity attention, but not enough alone to imply directional follow-through.
Actionable Watchlist
- Ethereum first Watch whether
eth_whale_dumpprints another cluster in the next 24-72 hours. A fresh extreme reading would reinforce downside stress rather than mark exhaustion. - Hyperliquid funding normalization Track whether
hyperliquid_avg_funding_ratebegins to normalize toward less negative territory. If not, the market remains vulnerable to either continued pressure or a violent short squeeze. - Validate divergence outliers Check the top
price_network_activity_divergenceoutliers against a second data source before elevating them. - Monitor bitcoin trend persistence Watch whether
bitcoinretriggers insideproject_in_trends. It had the cleanest repeat-confirmed attention pattern in that signal. - Treat the social-rotation basket as tactical Names like
bittensor,thorchain, andnervos-networkneed follow-up triggers before they should be treated as structural calls.
Bottom Line
This week's anomaly set did not point to a single coherent market narrative. Instead, it showed a fragmented market under structural derivatives stress, punctuated by concentrated ethereum whale-selling, scattered divergence outliers, and a broad but uneven social rotation. The most important signals to carry forward are the persistently negative hyperliquid_avg_funding_rate, the eth_whale_dump cluster on ethereum, and the repeat-confirmed bitcoin attention inside project_in_trends.
Spotting, analyzing, and understanding the markets is easier with the right tools and a strong like-minded community. Sign up for app.santiment.net and join our discord for access to real time metrics and analysis.
For more data-driven crypto analysis, subscribe to our YouTube channel, our Substack, or follow us on Santiment Insights.
Disclaimer: The opinions expressed in the post are for general informational purposes only and are not intended to provide specific advice or recommendations for any individual or on any specific security or investment product.