
The Weekly Anomaly Report: May 20th - 27th

Santiment's Weekly Anomaly Report will become its own newsletter soon — join the mailing list!
Crypto markets often move in unusual ways. Most of it is noise, but once in a while there’s a blip that could mean something. A token suddenly dominating crypto Twitter, whales dumping ETH, price spiking while network usage flatlines — you get the gist.
We call these anomalies. They often lead to trading opportunities — and this report helps you find them. In it, we look at signals from the 8 anomaly types we track, tell the bigger story, and details what’s worth tracking over the next week.
This report is for analysts, traders, and anyone curious about what crypto’s on-chain and social data are showing.
Let’s dig in!
Last Week in Brief
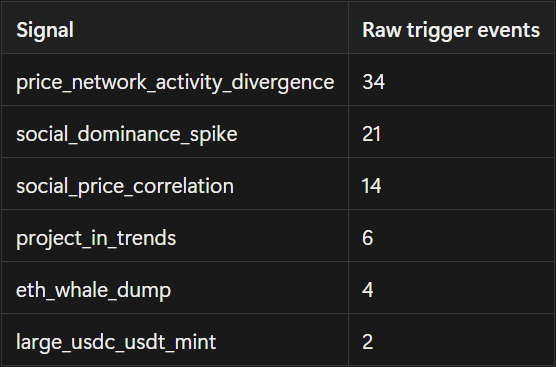
Between 2026-05-20 08:00:00 and 2026-05-26 23:00:00 , we detected 81 signals across 6 of the 8 anomaly types we track.
To keep things short and noise-free, we only talk about assets with $50M+ in market cap, unless otherwise noted.
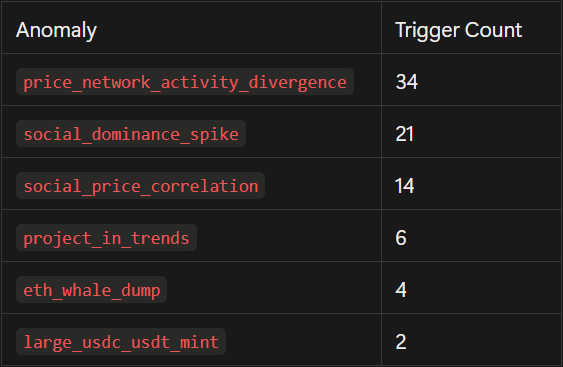
Between May 20 and May 26, we detected 81 trigger events across 6 of the 8 anomaly types we track.
To keep things short and noise-free, we usually talk about assets $50M+ in market cap, unless otherwise noted.
The headline this week: ‘price_network_activity_divergence’ topped the trigger count again, but only 4 of its 34 hits cleared the $50M floor — so the analytical center of gravity sat with the social signals, where a privacy-coin rotation, a stablecoin attention flip, and a single panic print on ‘litecoin’ did most of the storytelling.
- Zcash, $ZEC: violent short-squeeze rally and ETF filing turned spike-day euphoria into post-rally skepticism.
- Decentralized USD, $USDD: TRX rallying near 1.5-year highs dragged the stablecoin into the conversation, then the conversation soured.
- Litecoin, $LTC: highest single peak score in the dataset — a textbook panic print, not organic conversation.
- Ripple, $XRP: sentiment and price finally synced through the IPO-valuation and CLARITY Act window.
Spotlights
Zcash ($ZEC)
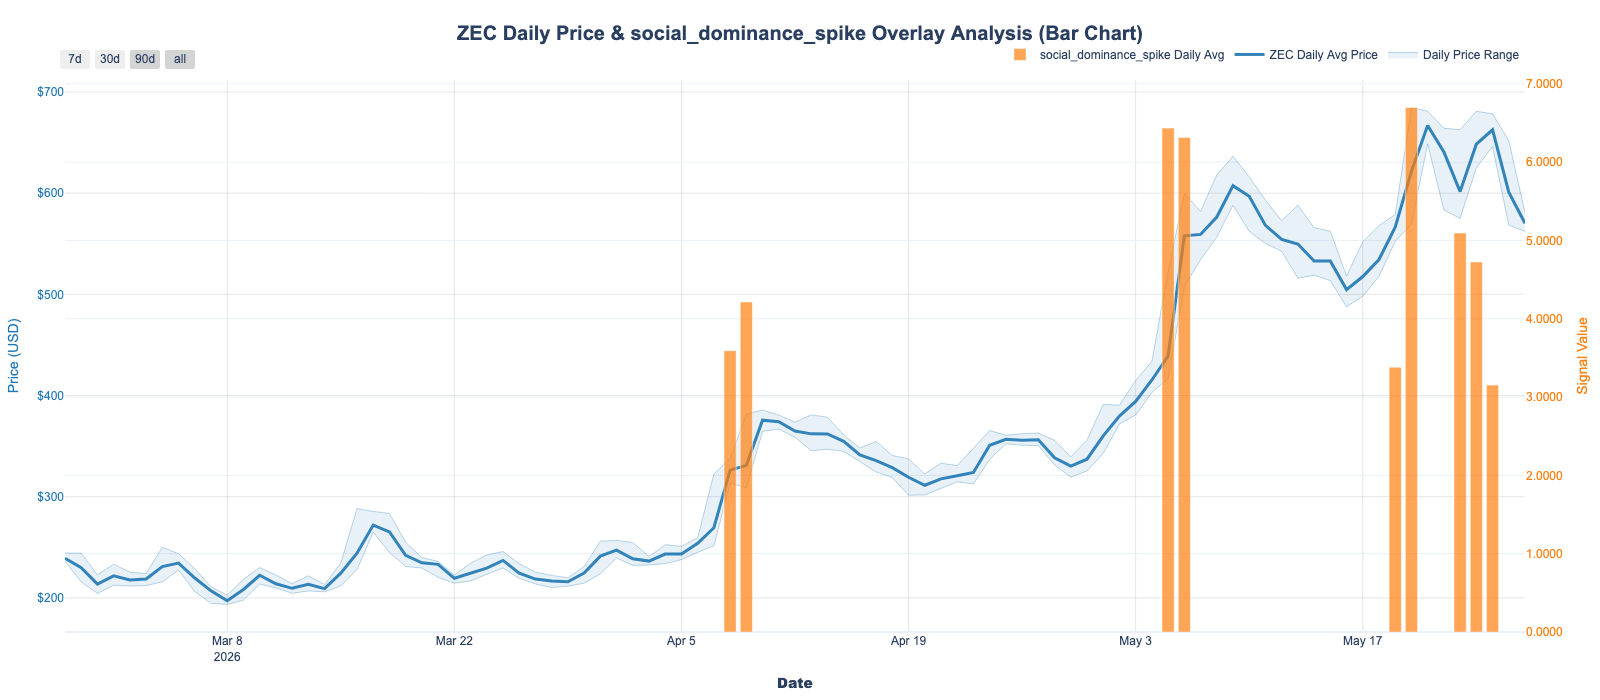
Zcash was the clear leader of the social table this week — seven repeat 'social_dominance_spike' triggers, a peak social-dominance score of 10.02 on May 20, 08:00 UTC, and a sentiment arc that flipped from positive on the spike day to negative by the latest reading. High repeat count plus a sentiment reversal is the signature of a euphoric move that gets reframed mid-rally.
The May 20 spike was driven by a violent short-squeeze: ZEC jumped from ~$568 to an intraday peak of ~$686 in roughly six hours (+17%), triggering ~$28M in liquidations and pushing market cap above $11B. Online conversation was dominated by three threads.
- Ted Pillows’ viral X.com post called it “a coordinated squeeze disguised as organic demand” — “low float + thin liquidity + aggressive perp positioning” — and that framing ricocheted across Crypto Twitter.
- Grayscale’s S-3 filing to convert its Zcash Trust into a spot ETF (ZCSH) hit on May 21, with crypto.news amplifying it: “Grayscale says financial privacy defines the next crypto cycle with $ZEC leading.”
- And the Multicoin Capital privacy-coin thesis (Tushar Jain’s May 6 thread) was still compounding, alongside the narrative that $ZEC had flipped Monero as the largest privacy coin.
Spike-day sentiment was positive (squeeze + ETF excitement), then flipped negative as the rally was reframed as manipulated and traders rotated out — explaining the seven repeat triggers and the eventual sentiment reversal.
The takeaway: asymmetric/volatile — $ZEC has been one of the most repeat-active assets of 2026, and signals around it tend to be tradable in either direction rather than directional on their own.
USDD ($USDD, and potentially $TRX)
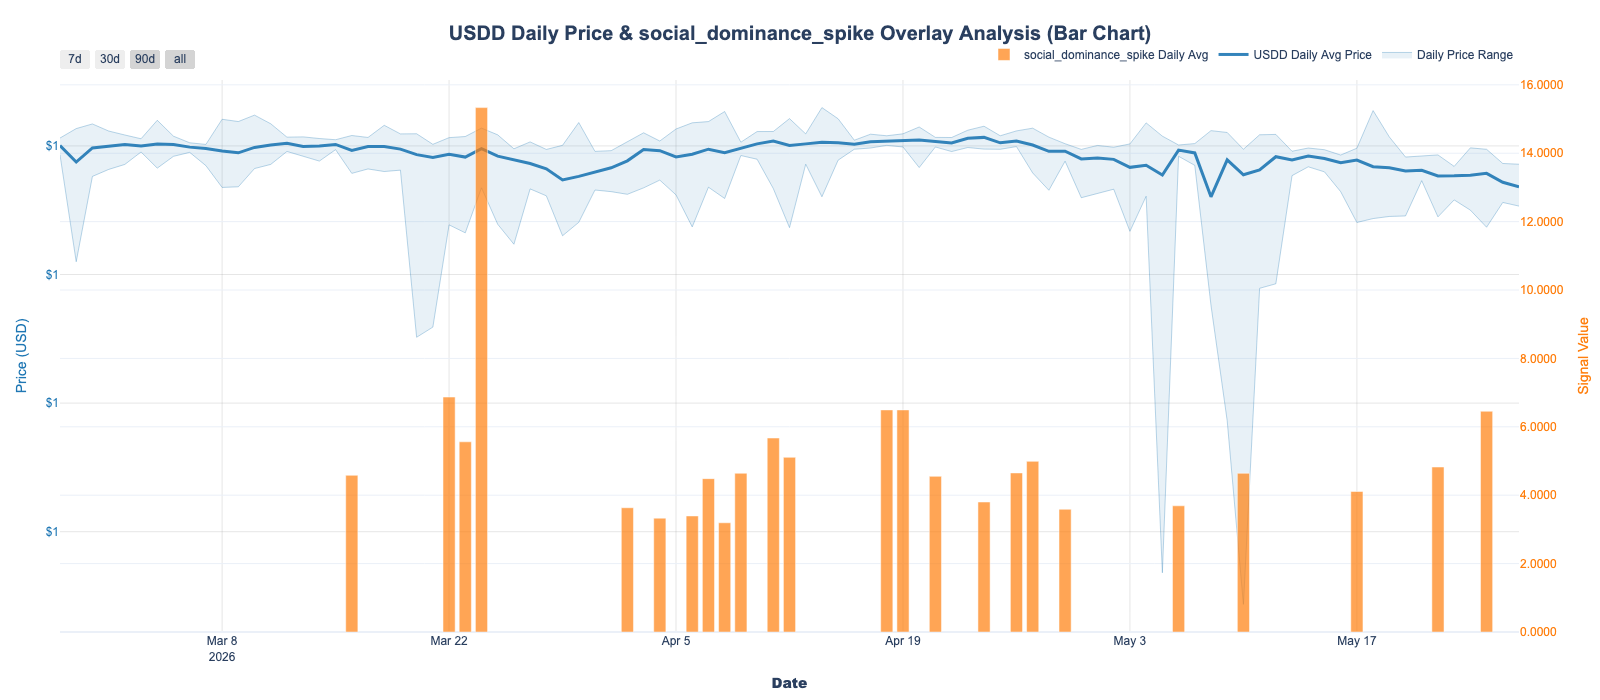
Decentralized USD held the second-highest 'social_dominance_spike' count this week (3 triggers, peak 6.45 on May 25, 00:00 UTC) on the back of two converging narratives in the TRON ecosystem.
- TRX rallied to a 1.5-year high near $0.40 on May 25–26, with derivatives open interest above $381M and dense short-liquidation clusters between $0.38–$0.40. Justin Sun amplified this on X, and USDD — as TRON’s flagship native stablecoin — caught the spillover.
- TRON’s Q1 2026 stablecoin volume report (~$2T transferred, roughly half of all USDT volume) was being widely reposted in the same window, with USDD positioned as the “decentralized choice” inside that ecosystem.
Underneath that, Justin Sun’s ongoing 2026 campaign continued to frame USDD as censorship-resistant, alongside the sUSDD / Pendle integration teasers ahead of the August 27 launch.
Spike-day sentiment was positive, latest is negative — most likely because the X conversation rotated to skepticism about Justin Sun’s track record (the Dubai TUSD freeze, the historical depeg memory) once the TRX-driven hype cooled.
The takeaway: regulatory-worry adjacent — attention here is correlated with concern and trust scrutiny, not enthusiasm. The signal flags that USDD is in the conversation, but the conversation is not bullish.
Chiliz ($CHZ, $SAFA, $SFA)
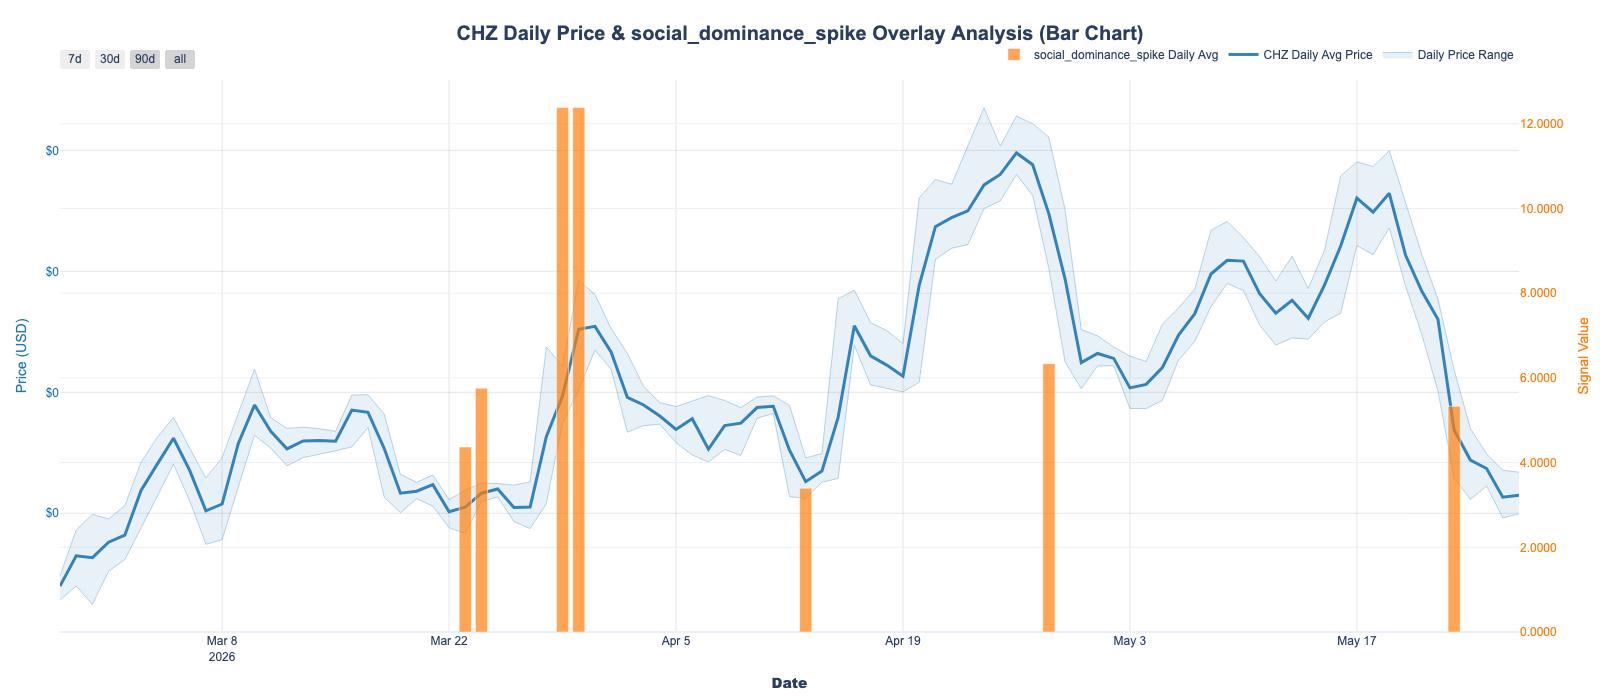
Chiliz posted two 'social_dominance_spike' triggers and a peak of 5.84 on May 23, 12:00 UTC, two days after a clear catalyst pair on May 21:
- Chiliz × South African Football Association (SAFA) partnership — launching the official Bafana Bafana Fan Token ($SAFA) on Socios.com. First African national federation to join.
- Chiliz × Scottish FA partnership — launching the official Scotland Fan Token ($SFA) on Socios.com on the same day.
Both happened as 2026 FIFA World Cup pre-positioning. Despite the volume of attention, sentiment was negative on both the spike day and the latest reading. The X discourse around fan tokens has been persistently bearish (skepticism about utility, the “fan tokens are not investments” disclaimer, CHZ’s price stagnation), so even positive partnership news draws negatively-framed conversation.
The takeaway: attention without alignment — fan tokens have a structural sentiment ceiling, and even genuinely substantive partnership news fails to shift the framing. Worth tracking the World Cup catalyst calendar, but not actionable on positive news flow alone.
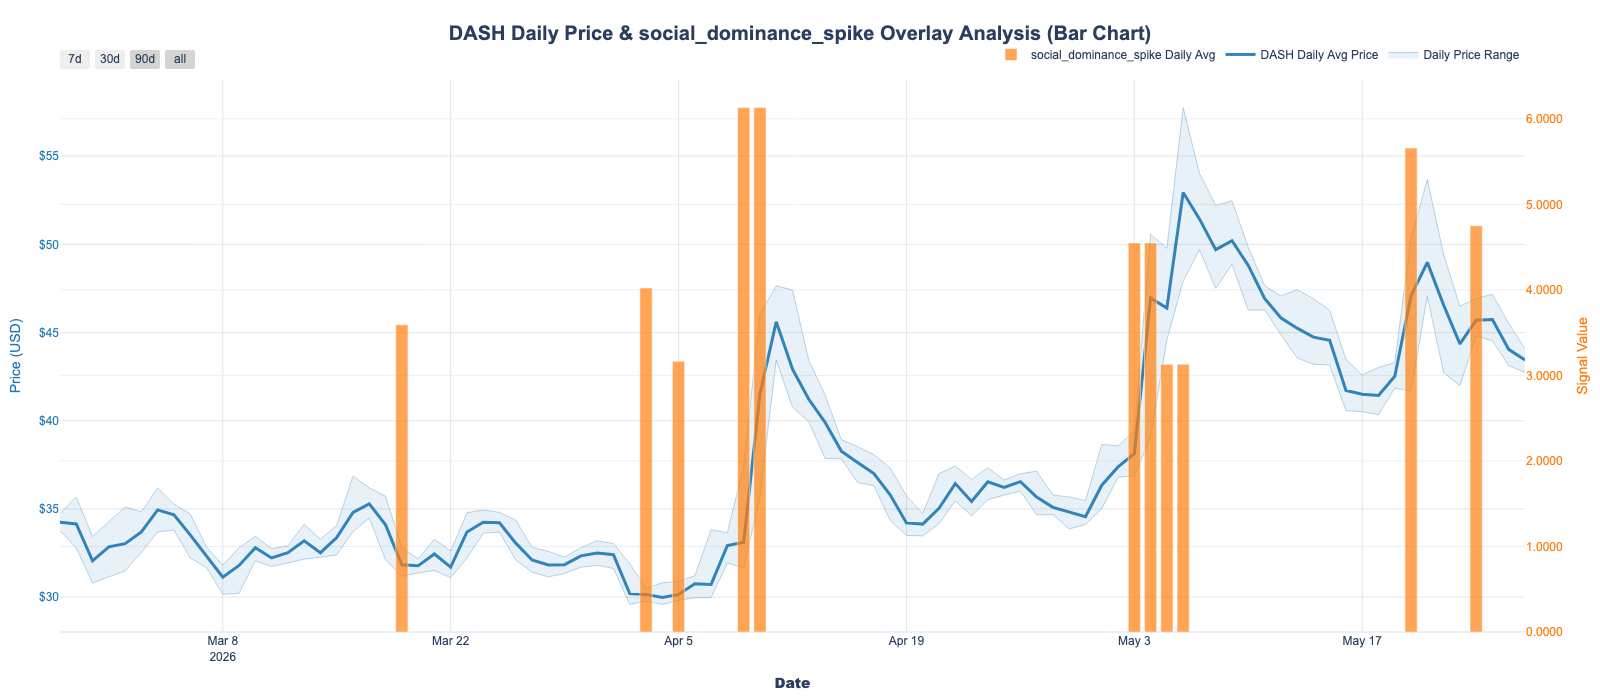
Dash ($DASH)
Dash social dominance spiked on exactly the same timestamp as Zcash (May 20, 08:00 UTC, peak 5.66, two triggers), which is the key tell: $DASH was caught up in the privacy-coin rotation $ZEC kicked off. The specific catalyst was:
- Crypto Patel’s viral X post on May 21 about a THORChain × Dashpay integration — “$DASH From $30 to $500? The @THORChain x @Dashpay Integration Might Be the Catalyst Nobody Is Watching. #DASH is going cross-chain — native swaps with 35+ chains, no bridges, no CEX.” That single post drove much of the X attention.
- Sympathy rally with $ZEC — DASH rallied into double-digit intraday gains on May 20, with traders targeting $55 as the next resistance, and the broader “privacy coin renaissance” lifted the whole sector.
Spike-day sentiment was positive, then flipped negative as the rally faded and the May 22–23 broader market sell-off dragged $DASH back down with its peers.
The takeaway: second-order beta — $DASH traded as the derivative leg of the $ZEC privacy rotation rather than on its own catalyst. The trade is the parent narrative, not the satellite.
Litecoin ($LTC)
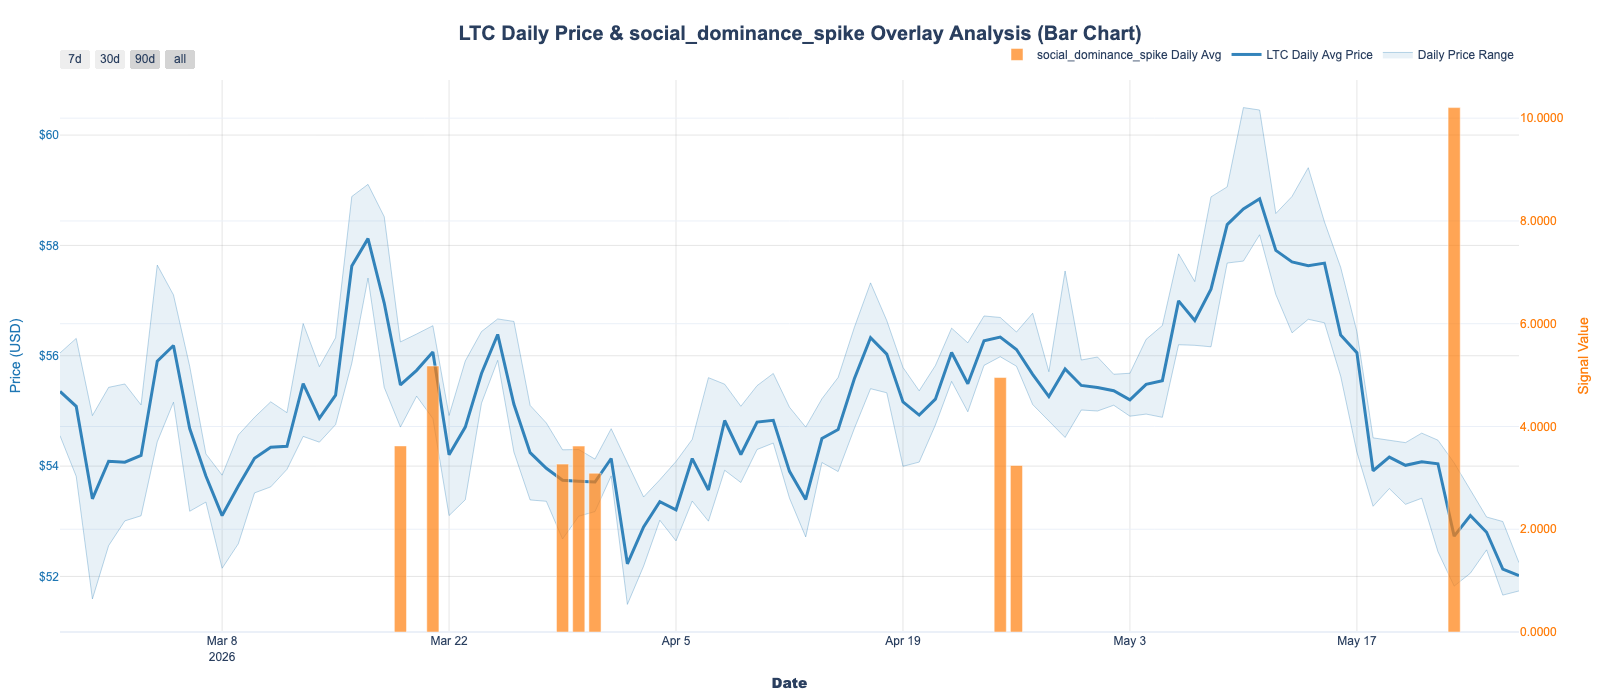
Litecoin produced the highest single peak score in the entire dataset this week (10.21 on May 23, 12:00 UTC) on a single trigger, with negative sentiment on both the spike day and the latest reading. That combination — one sharp print, no repeat, sentiment already negative — is the textbook signature of a fear-driven spike, not an organic attention build.
The driver was the broad crypto sell-off of May 22–23:
- ~$575M+ in long liquidations across the market, with bullish traders accounting for ~$525M of the wipeout, as Bitcoin dropped ~8% from above $81K toward the $75K support zone.
- The X conversation layered macro fear (delayed Fed rate cuts) on top of the lingering aftermath of the April 25 MWEB zero-day post-mortem (the David Burkett write-up was still circulating), reinforcing the “Litecoin has lost its narrative” thread that has been a persistent bearish drumbeat throughout 2026.
The takeaway: capitulation print — extreme negative sentiment readings on a single sharp spike often mark short-term pivot points. Worth monitoring for the recovery setup rather than chasing the downside.
Ripple ($XRP)
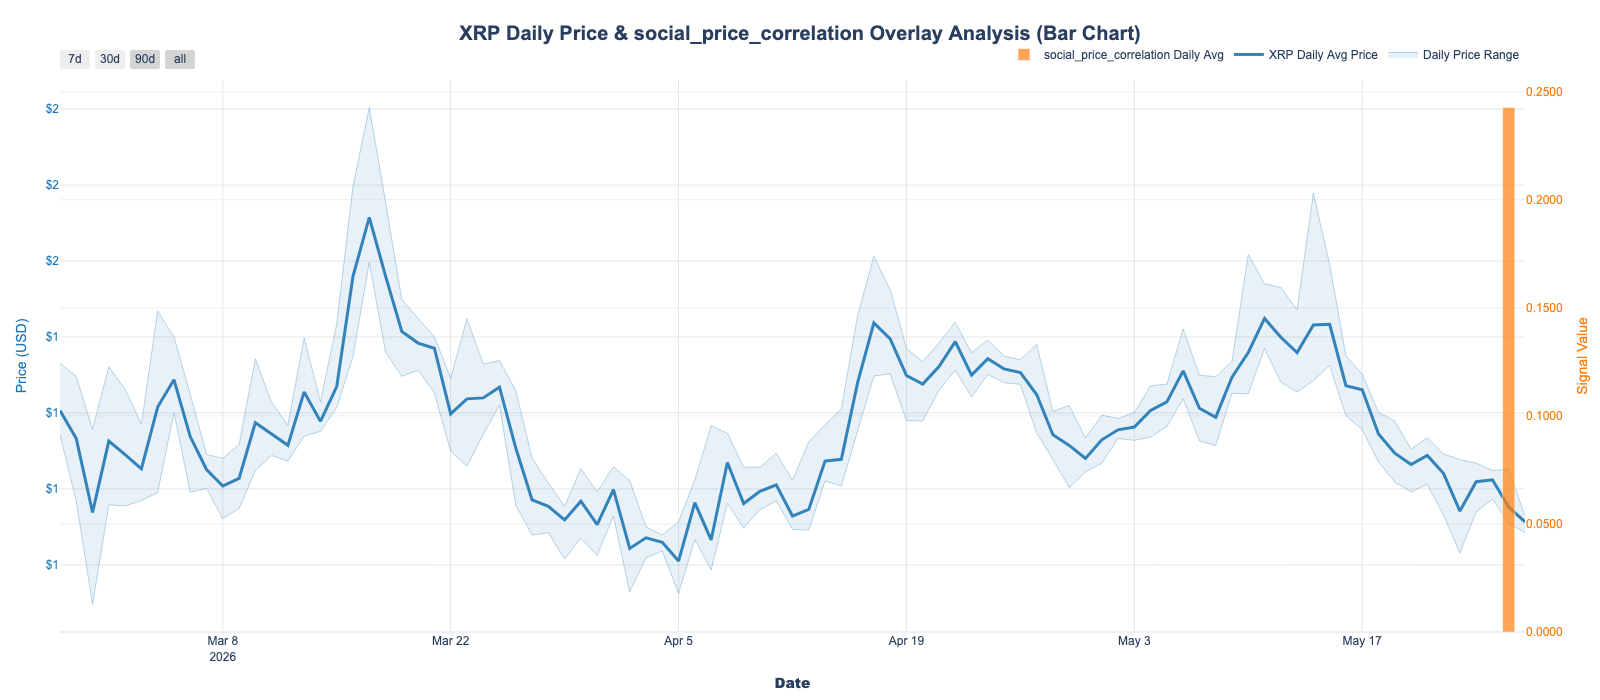
Ripple's $XRP was the sole asset to trigger 'social_price_correlation’ this week — 14 triggers, an average value of 0.24, and a peak of 0.26 on May 26, 19:00 UTC. A modestly positive reading sustained over two weeks is qualitatively different from a single-day pump: it tells you the crowd’s mood was tracking price action coherently. That’s notable now in 2026, since $XRP has been notorious for sentiment-price decoupling (institutional wins not translating to price, whales accumulating into a flat tape).
Four converging drivers explain the alignment.
- First, Ripple Labs’ private-market valuation: crypto.news posted on May 26 — the exact peak date — that Ripple Labs shares had reached $136.90 on secondary markets, up 376% all-time, with institutions positioning ahead of a potential 2026 public debut. The IPO narrative is the kind of story that lifts price and sentiment in the same direction, which is precisely the alignment this signal picks up.
- Second, the XRPL Lending Protocol amendment entered its two-week activation window in early May, with the activation landing on May 27 — the day after the peak — and the XRPL Foundation’s @Vet_X0 posting validator-upgrade warnings through the period kept the conversation technical-but-bullish.
- Third, the CLARITY Act: the Senate Banking Committee advanced it 15-9 on May 14, classifying most non-stablecoin crypto (XRP included) as digital commodities under the CFTC, with Standard Chartered’s $4–8B $XRP spot-ETF inflow projection being widely circulated. ETF flow data backed the narrative — XRP ETFs took in $12.57M for the week ended May 22 while BTC and ETH ETFs saw outflows.
- Fourth, network growth: @SantimentData posted on May 21 that 4,300 new $XRP wallets had been created in 24 hours, the fourth-largest spike of 2026, and that post was quoted by U.Today, MEXC, CoinCentral, and others, putting Santiment’s data inside the bullish narrative loop the signal was reading.
One nuance worth flagging: 0.26 is meaningful but still a modest positive correlation, not a screaming one. $XRP trades near $1.39–$1.47 in late May 2026, down roughly 26% year-to-date despite multiple institutional catalysts that historically would have driven significant appreciation. The crowd and the chart agreed more than usual for $XRP — a low bar given how decoupled 2026 has been — but they weren’t agreeing on a moonshot; they were agreeing on a tentative reversal setup.
The takeaway: narrative-and-price syncing — not euphoria, but the first coherent two-way alignment $XRP has produced in months. The IPO narrative is the cleanest forward catalyst to trade against if the alignment holds.
Price-Network Activity Divergence: The Sub-$130M Long Tail
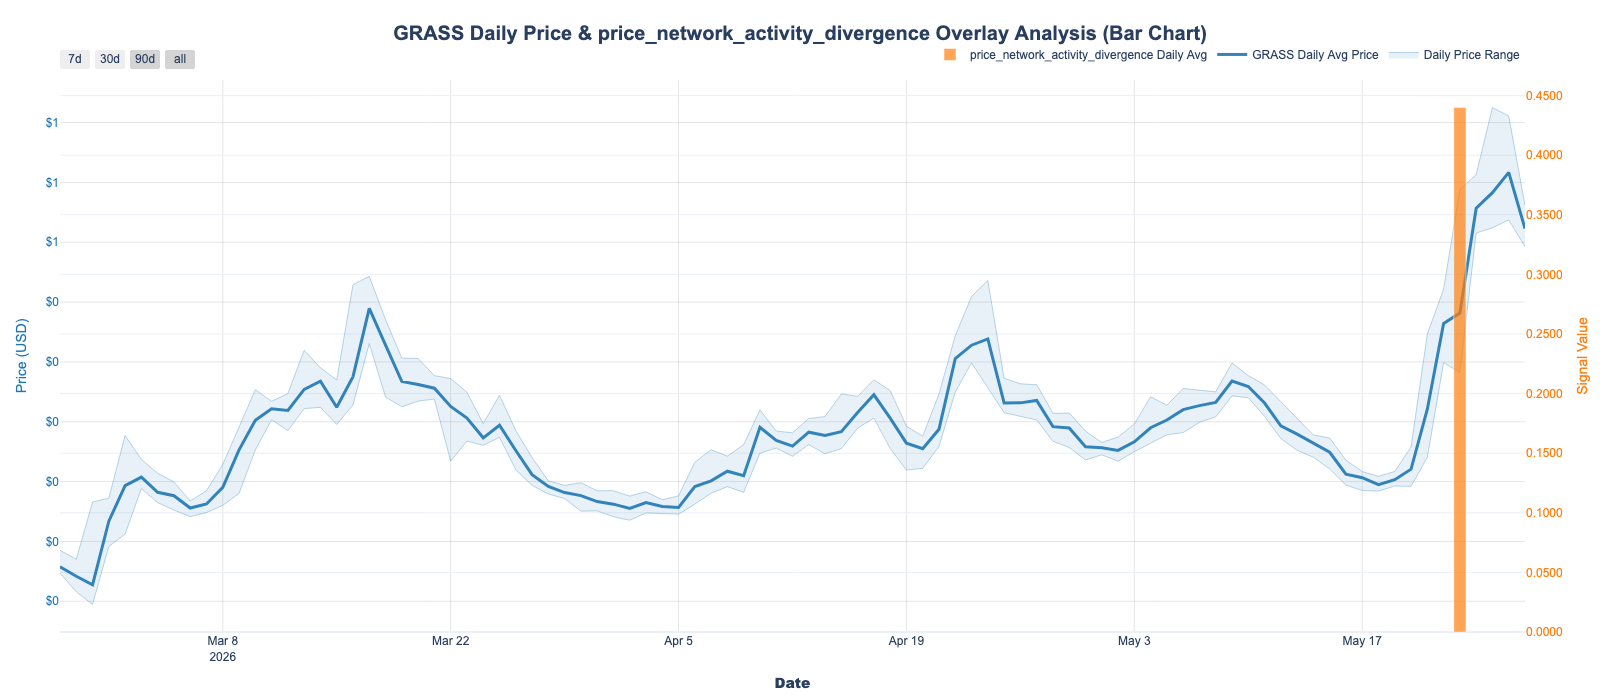
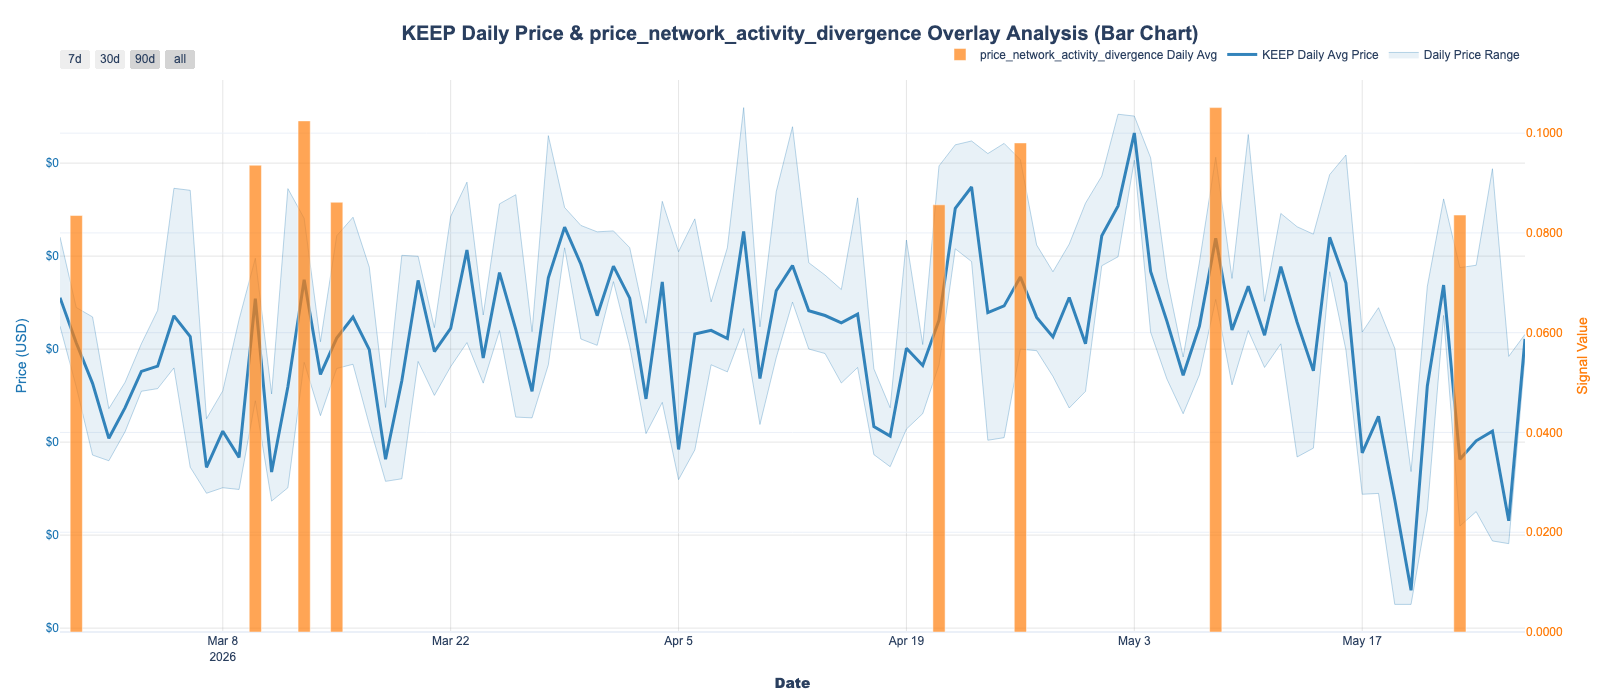
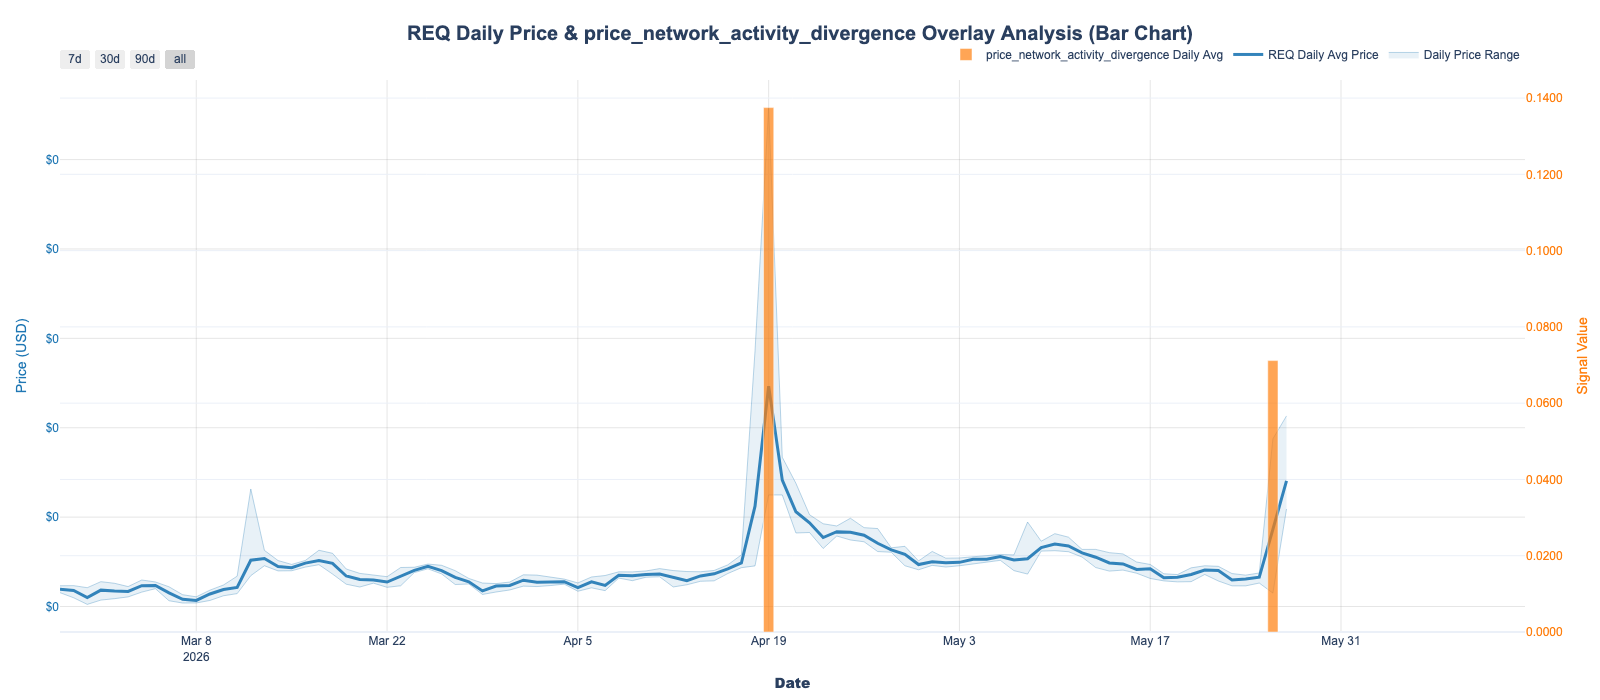
‘price_network_activity_divergence’ fired 34 times this week but only four assets cleared the $50M floor — and the four that did all sit below $130M, all triggered once, and all posted small peak scores (0.06–0.44). These are the kind of divergences that show up when a project’s network is doing something but the token isn’t pricing it in (or vice versa). They’re not spotlight-grade individually, but the structural reason behind each one is worth a paragraph.
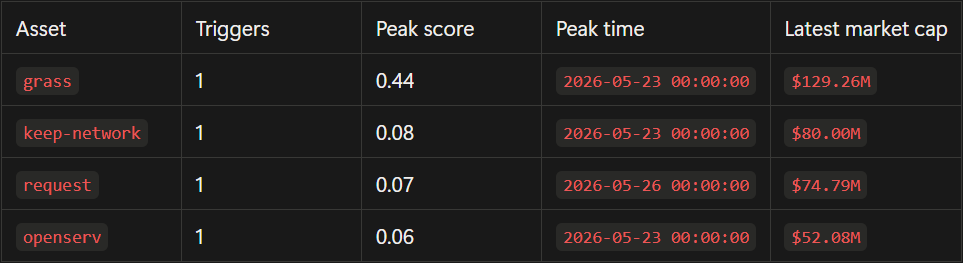
Grass ($GRASS, peak 0.44, ~$129M cap) is token-supply overhang muting network signal. The fundamentals are strong — ~$33M in verified revenue selling web data to AI clients, throughput past 1 PB/day, OKX listing on April 24 — but the 181M token unlock (~$80M) that hit in October 2025 and the Season 2 airdrop supply flooding the float through Q2 2026 have been absorbing the upside. The network is monetizing real AI demand; emissions are eating the price action.
Keep Network ($KEEP, $T, peak 0.08, ~$80M cap) is the residual heartbeat of a token whose product migrated. Keep merged with NuCypher in January 2022 to form Threshold Network, and tBTC v2 — the flagship product — runs on Threshold (T), not KEEP. tBTC crossed $1B in cumulative cross-chain volume on Wormhole in February 2026, and the Threshold DAO reintroduced a 20-bp tBTC mint fee on April 15 — but all of that fee revenue accrues to T stakers, not KEEP holders. The divergence is structural and permanent until conversion completes.
Request ($REQ, peak 0.07, ~$75M cap) is a real-world-usage versus illiquid-token mismatch. Request Finance has processed $1B+ in invoicing volume historically, with the Aleo private-payroll integration becoming a top payment option within two months of its 2025 launch. Each transaction burns a small amount of REQ — but only ~582,000 REQ have been removed since the burn began in 2024 against a circulating supply of ~797M, or roughly 0.073% of supply. The deflationary mechanism is mathematically real but practically irrelevant to price.
OpenServ ($SERV, peak 0.06, ~$52M cap) is the inverse case and the most interesting of the four. SERV ripped ~70% in 24 hours in mid-May (and as much as ~170% on the longer move), breaking out of a seven-month falling wedge into the autonomous-AI-agent narrative on the back of founder Tim Hafner’s claim that SERV Nano matches GPT-5.4 at 20× lower cost and 3× the speed, alongside the assertion of enterprise and UAE-government deployments. Exchange balances dropped during the run. The May 23 divergence here is the post-pump cool-off: price ran ahead of measurable network usage, and network activity is failing to catch up.
The takeaway: four divergences, four different reasons — three are price-stuck-below-fundamentals (emissions, severed value accrual, burn-mechanism scale), one is price-ran-ahead-of-network-usage. Treat the first three as patience setups (the unlock pressure on ‘grass’ is the cleanest of them) and the fourth as a mean-reversion candidate.
What Else Happened
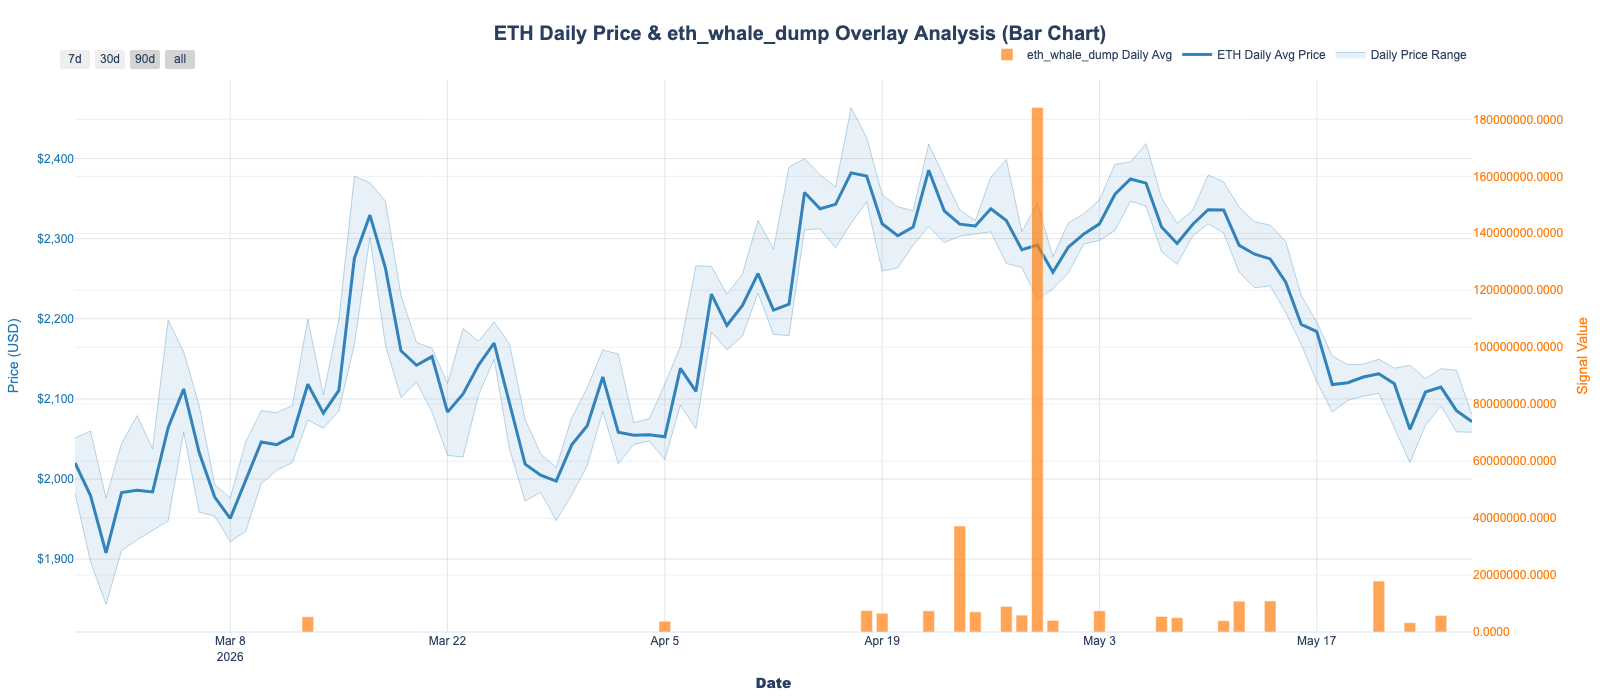
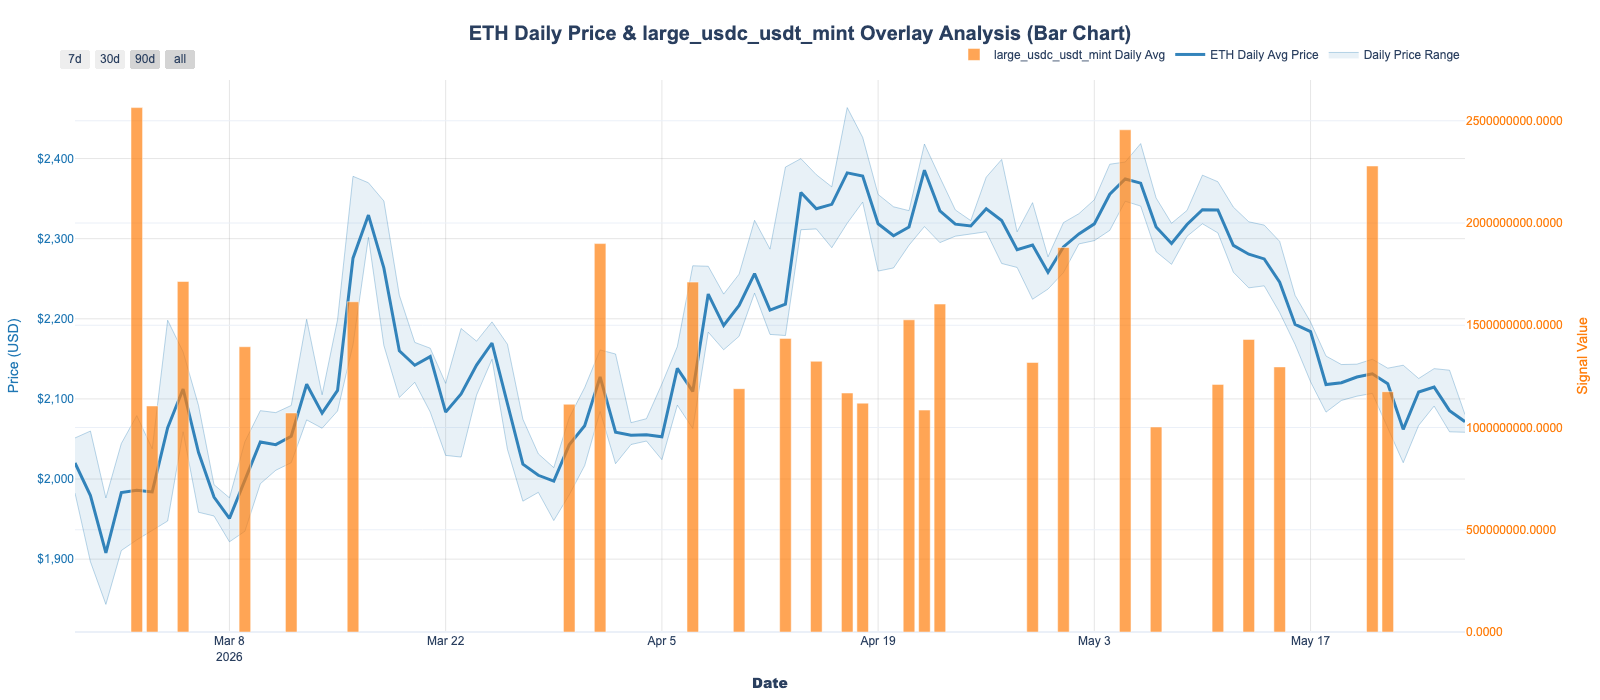
‘eth_whale_dump’ triggered four times on ‘ethereum’, with an average movement of ~11.2M and a weekly peak of ~25.1M on May 21, 09:43 UTC. The signal is ETH-only by design, so the read here is persistence and timing rather than cross-asset comparison: four hits in a week is consistent with active distribution, but absent a corresponding price break it’s a positioning observation rather than a directional call.
‘large_usdc_usdt_mint’ triggered twice, with the larger event at $2.28B on May 21 and another mint on May 22. Large in absolute terms but routine in current market conditions — worth tracking as a market-liquidity datapoint, not actionable on its own.
Worth Watching
- Zcash: strongest social attention this week, with the kind of volatility and liquidity that makes both directions tradable.
- XRP: the IPO narrative is the cleanest forward catalyst; track whether the sentiment-price alignment holds into the Ripple Labs valuation news cycle.
- OpenServ: short-term mean-reversion candidate after the ~70%–170% run, with network growth failing to validate the move.
- Litecoin: extreme negative sentiment on a single sharp print often marks short-term pivots — worth monitoring for a recovery setup.
Total Triggers
The Anomalies We Track
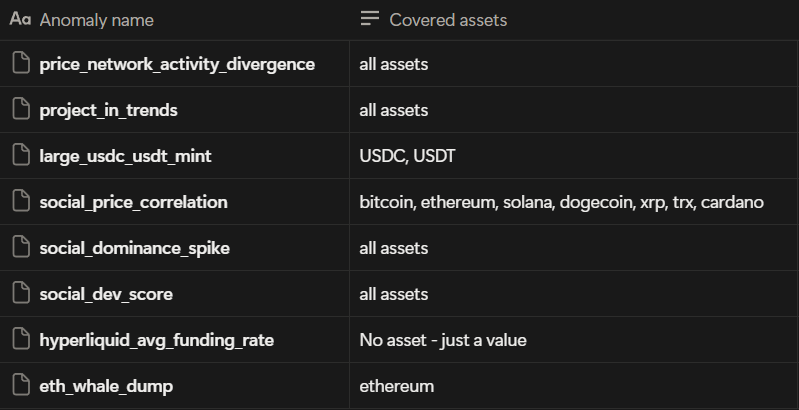
Network Activity & Price Divergence Anomaly — detects price surges that are not accompanied by a corresponding rise in network activity (real growth). Triggered only if the price growth exceeds 3% on the same day, ensuring the alert is relevant for significant bullish moves.
Project in Trends Anomaly — detects when a specific crypto token gains significant traction in online discussions, placing it among the top 10 most-mentioned words in crypto-related conversations.
Large USDC-USDT Mint Anomaly — detects daily combined $1 billion or larger minting events of USDC and USDT stablecoins on the Ethereum blockchain.
Social Price Correlation Anomaly — detects whether social sentiment and price are behaving in an unusually aligned or unusually decoupled way. Currently runs on 1h X.com social data for bitcoin, ethereum, solana, dogecoin, xrp, trx, and cardano.
Social Dominance Spike Anomaly — detects abnormal spikes in social dominance metrics. Alerts when values exceed a statistical significance threshold of 3 standard deviations over 30 days.
Social-Dev Score Anomaly — detects unusual activity compared to recent 30-day history of social media metrics and development activity. The score is weighted 60/40 for social and dev activity.
Hyperliquid Average Funding Rates Anomaly — detects when rates exceed predefined high/low thresholds of +40% and -20%, measured hourly.
ETH Whale Dump Anomaly — detects potential large-scale ETH dumps by monitoring whale wallet behaviors. Uses a 500 ETH threshold and a 30-day holding period to distinguish normal trading from potential dump scenarios.
—
Thanks for checking out this week’s Santiment Anomaly Report. For real-time anomaly alerts and the underlying data, head to Sanbase.
See you next week!
Anomalously yours,
Santiment
Disclaimer: This report is for reference purposes only and is not intended as financial or investment advice. Always DYOR.