Which Networks Are Quietly Heating Up as 'Buy the Dip' Opportunities Arise?

We thought it would be a good time to check in on Santiment's Activity Matrix for the first time in a while. If you're unfamiliar with this revolutionary model, we have put some comprehensive articles together about it to help get you started.
Here is an introduction to the model
Here is a video walkthrough where you can see it being used
We commonly see cryptocurrencies fluctuating closely together. It's completely normal for altcoins to go up together and down together. However, what is going on beneath the surface is a much different story.
In short, we are trying to find which coins are seeing hotter than normal activity, and which are seeing colder than normal activity. Those with high on-chain movement right now could be a fantastic buy signal, considering nearly all of crypto has been retracing over the past week... and the concept behind high on-chain activity is that it causes price reversals. So when it comes to buying the dip, there is a higher probability of success in scooping up coins that are seeing heavy network growth, whale activity, social dominance, or even exchange outflows (to name a few).
Let's take a look at where things stand, as of the close of October 15, 2025:

This array of different rainbow colored boxes above provides quite a bit of information, and probably looks incredibly overwhelming at first glance. But it's actually quite simple by design.
- Each coin is represented by a large label with its name and market cap rank in parentheses
- The color of the coin's top label represents how hot (dark red), medium (yellow), or cold (dark blue) the network is in its most recent day compared to its 3-month average
- Below each coin's label are the price percentage changes (from left to right) representing its 1-day, 7-day, 30-day, and 90-day price changes. These price changes are also auto color-coded, where red means they're performing worse than most other coins, yellow means they're about average, and green means they're performing better.
- The eight boxes below are represented by: the vertical axis showing the last 7 days of data, and the horizontal axis showing (from right to left) how hot or cold the coin's active addresses, network growth, whale transactions, positive/negative sentiment ratio, social dominance, exchange flow, mean dollar invested age, and age consumed were on each of those days
With all of this said, we can now eyeball a few coins on the above screen, that are currently auto-labeled in:
- Dark red (indicating a very "hot" network), like: FTX Token and Synthetix
- Dark blue (indicating a very "cold" network), like: Maker, MX Token, Nexus Mutual
But with all of the colors and tiny squares, it can be a bit overwhelming. That's why we have also created the Leaderboard tab, which is arguably where you'll end up spending more of your time. Here, you can find the coins that are seeing the highest anomalies in each category, or just the overall hottest or coldest networks.
Intuitively, on the below snapshot of this Leaderboard page, you'll see the coins seeing some of their highest days in each category on the green top half... and the lowest days in each category on the red lower half. The "Rank" next to each coin name shows what rank the previous full day of, for example Network Growth was, for that specific coin. So seeing a rank of "1" next to PAX Gold means it has just had the highest day of Network Growth in the past three months. A rank of "2" next to Ankr under Network Growth, means it just had its 2nd highest day in that category.
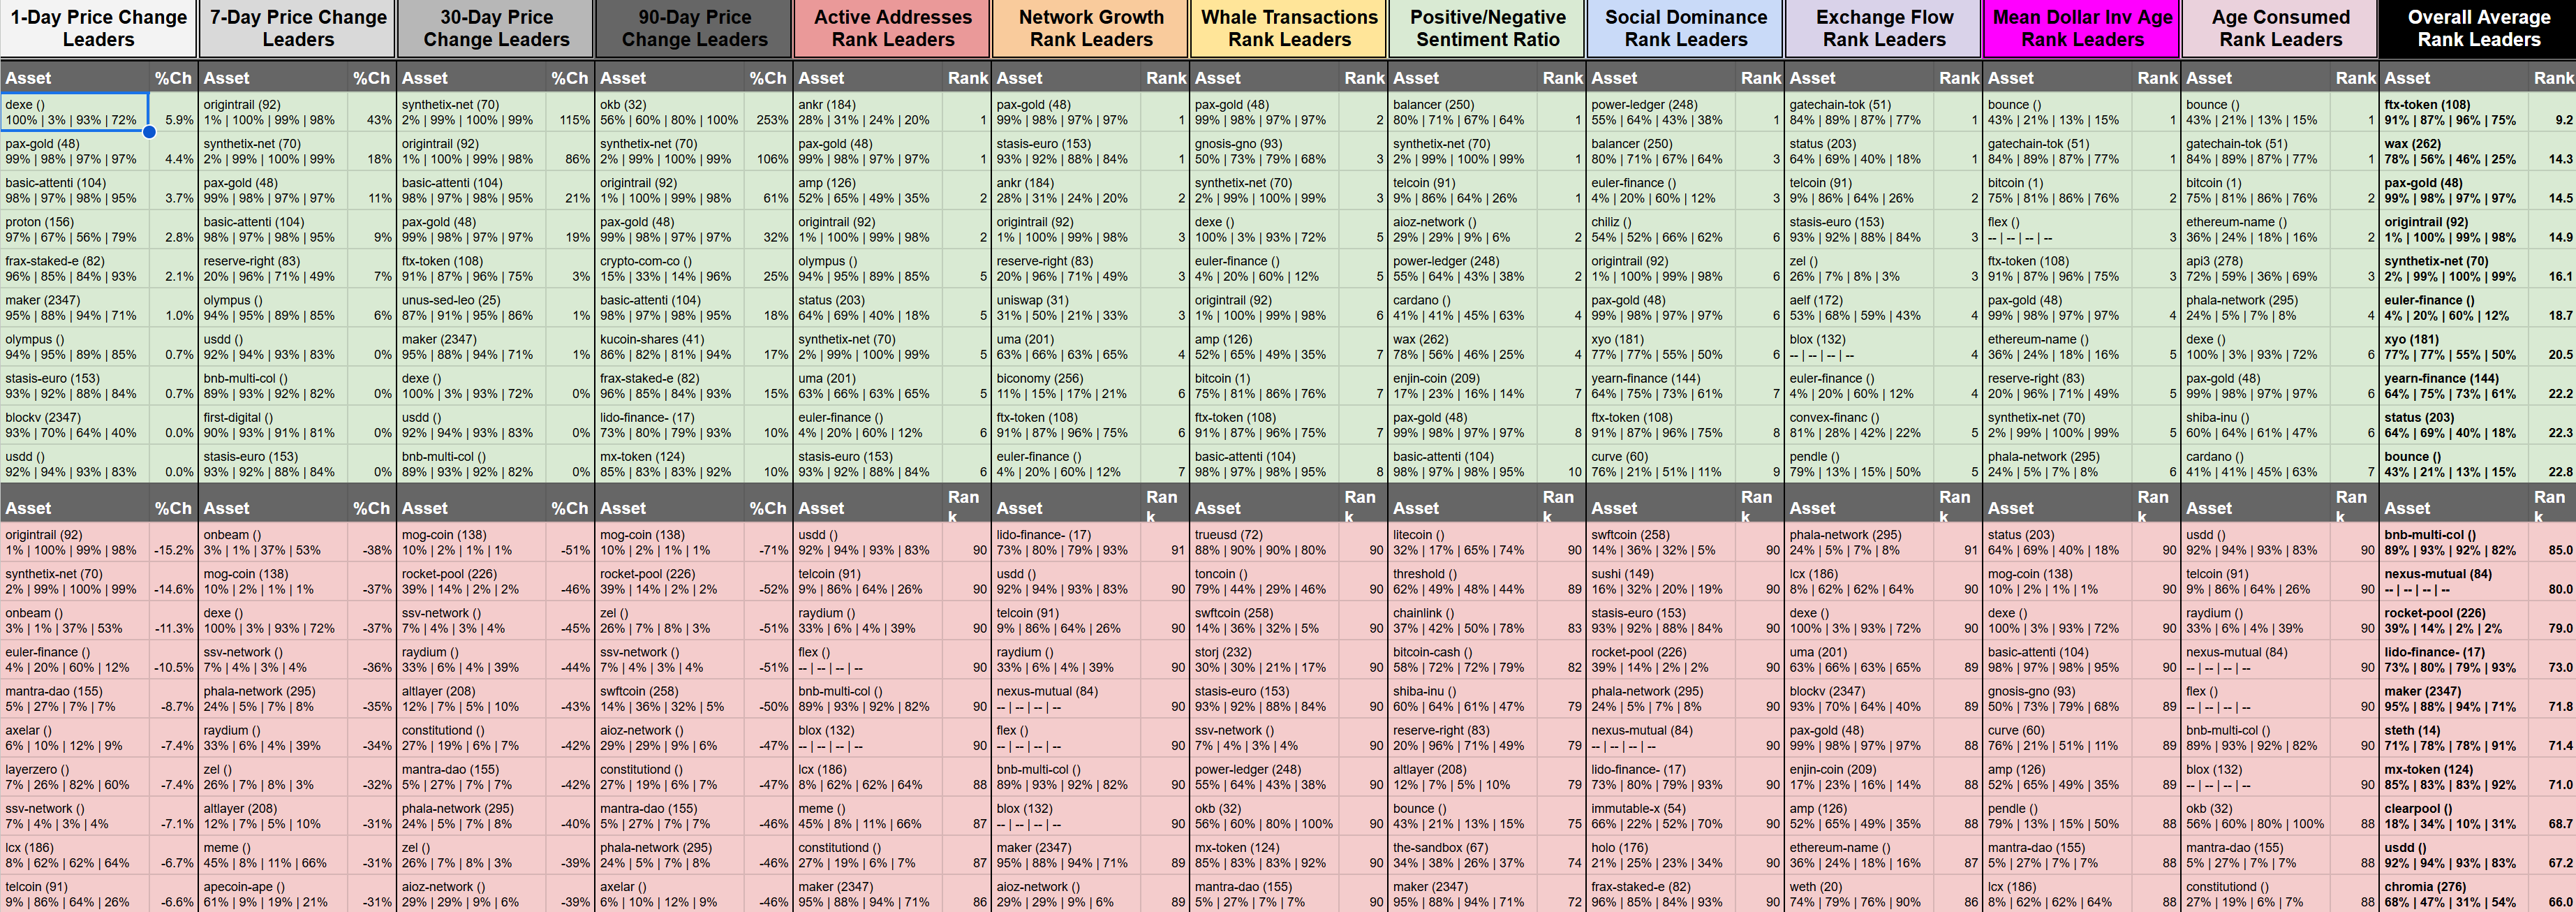
If you just want to see all eight categories averaged together, just move your eyes straight to the far right column, where you can see the "Overall Average Rank Leaders". To get to the point of where we are now:
Hottest Networks (Compared to normal averages):
- FTX
- WAX
- PAX Gold
- Origintrail
- Synthetix
- Euler
- XYO
- YFI
- Status
- Bounce
Coldest Networks (Compared to normal averages):
- Multi Collateral DAI (On BNB)
- Nexus Mutual
- Rocketpool
- Lido DAO
- Maker
- Staked Ethereum
- MX Token
- Clearpool
- USDD
- Chromia
Now remember that it's a common misconception that "hot" networks are the ones are associated with the coins that are about to go up in price, and "cold" networks are associated with the coins that will go down. This is not always the case.
Look at it this way instead:
- If a coin is seeing a hot network, it has a high probability of seeing a turnaround. If prices have been outperforming the crypto market, a correction is very likely... but if prices have been underperforming, or just going down with the rest of the market, this is a sign of it being a buy signal.
- If a coin is seeing a cold network, it has a high probability of seeing the same direction. If prices have been outperforming the crypto market, it isn't getting a lot of FOMO yet, which is a good sign it can continue to outperform. But if prices are going down, the probability of a sudden turnaround/bounce is very low.
Give it a look for yourself, and let us know what kind of information you were able to pull from it! We're always open to feedback.
Once you have your Sanbase PRO account (or if you already do), you'll then want to check out either Activity Matrix link below and go to File - Make a Copy:
Asset Activity Matrix FULL (For Paid Google Sheets users): https://docs.google.com/spreadsheets/d/1XSYTrBAY6b5oLO5btRRh40I7CftN76gJ1bKU_owHHeA/view
Asset Activity Matrix FULL (For Free Google Sheets users): https://docs.google.com/spreadsheets/d/1o3WJQCVn5wz66c33B8NZHQPf7epOSwHVAaf9iN3SrFk/view?gid=903925887#gid=903925887
Then:
1) Ensure that your Google account email is logged in with the same email as your Santiment email
2) Download Sansheets: https://academy.santiment.net/sanshee...
3) Plug in your API: https://academy.santiment.net/sanshee...
4) If you're having trouble getting the data to load on a model, head to the 'Data' tab on the far right of the spreadsheet, and go to the yellow cell. Then delete the cell formula, then hit Undo. This should manually refresh the data.
5) If data still won't load, copy the URL of your model, close the tab, and then paste the URL in a new tab and hit enter
-----
Free two-week trials to Sanbase PRO (to access all mentioned Santiment data in this article, and plenty more) are AVAILABLE HERE!
-----
Disclaimer: The opinions expressed in the post are for general informational purposes only and are not intended to provide specific advice or recommendations for any individual or on any specific security or investment product.