Using Price Range Mentions to Capitalize On Crowd FUD and FOMO Emotions

Markets move the opposite direction of the crowd's expectations. It's a simple rule of thumb to follow in theory... but it's often much harder to gauge what those "expectations" actually are at any given time, than we anticipate. Most retail traders lose money when swing trading cryptocurrencies. And the vast, vast majority of social posts you see are coming from retail. Therefore, the free information they provide to the masses gives you a perfect opportunity to capitalize on being a contrarian to them.
There are many ways to gauge when there is a shift in mood. You can sometimes just see a few major posts on your X timeline, Reddit front page, or Telegram groups, and assume that their all-caps "BUY NOW" or "SELL ASAP" posts are representative of the majority. But with small samples, we can sometimes become misled.
One of our favorite approaches at Santiment is to actually hone in on how price mentions and speculations are flowing in on a given coin on a day to day basis. You won't be surprised to see that the crowd typically begins rumbling about much, much lower prices after a major dip (such as September 25th). Conversely, they begin discussing very ambitious prices when a coin breaches a new all-time high (like we saw on October 6th).
Bitcoin
Check out the below chart of Bitcoin price mentions that are substantially higher or substantially lower than current price levels. You can explore and bookmark yourself here.
🟦 bars represent all mentions of 50K-100K (or the full numbered 50,000 to 100,000 irrelevant of commas)
🟥 bars represent all mentions of 150K-200K (or the full numbered 150,000 to 200,000 irrelevant of commas)
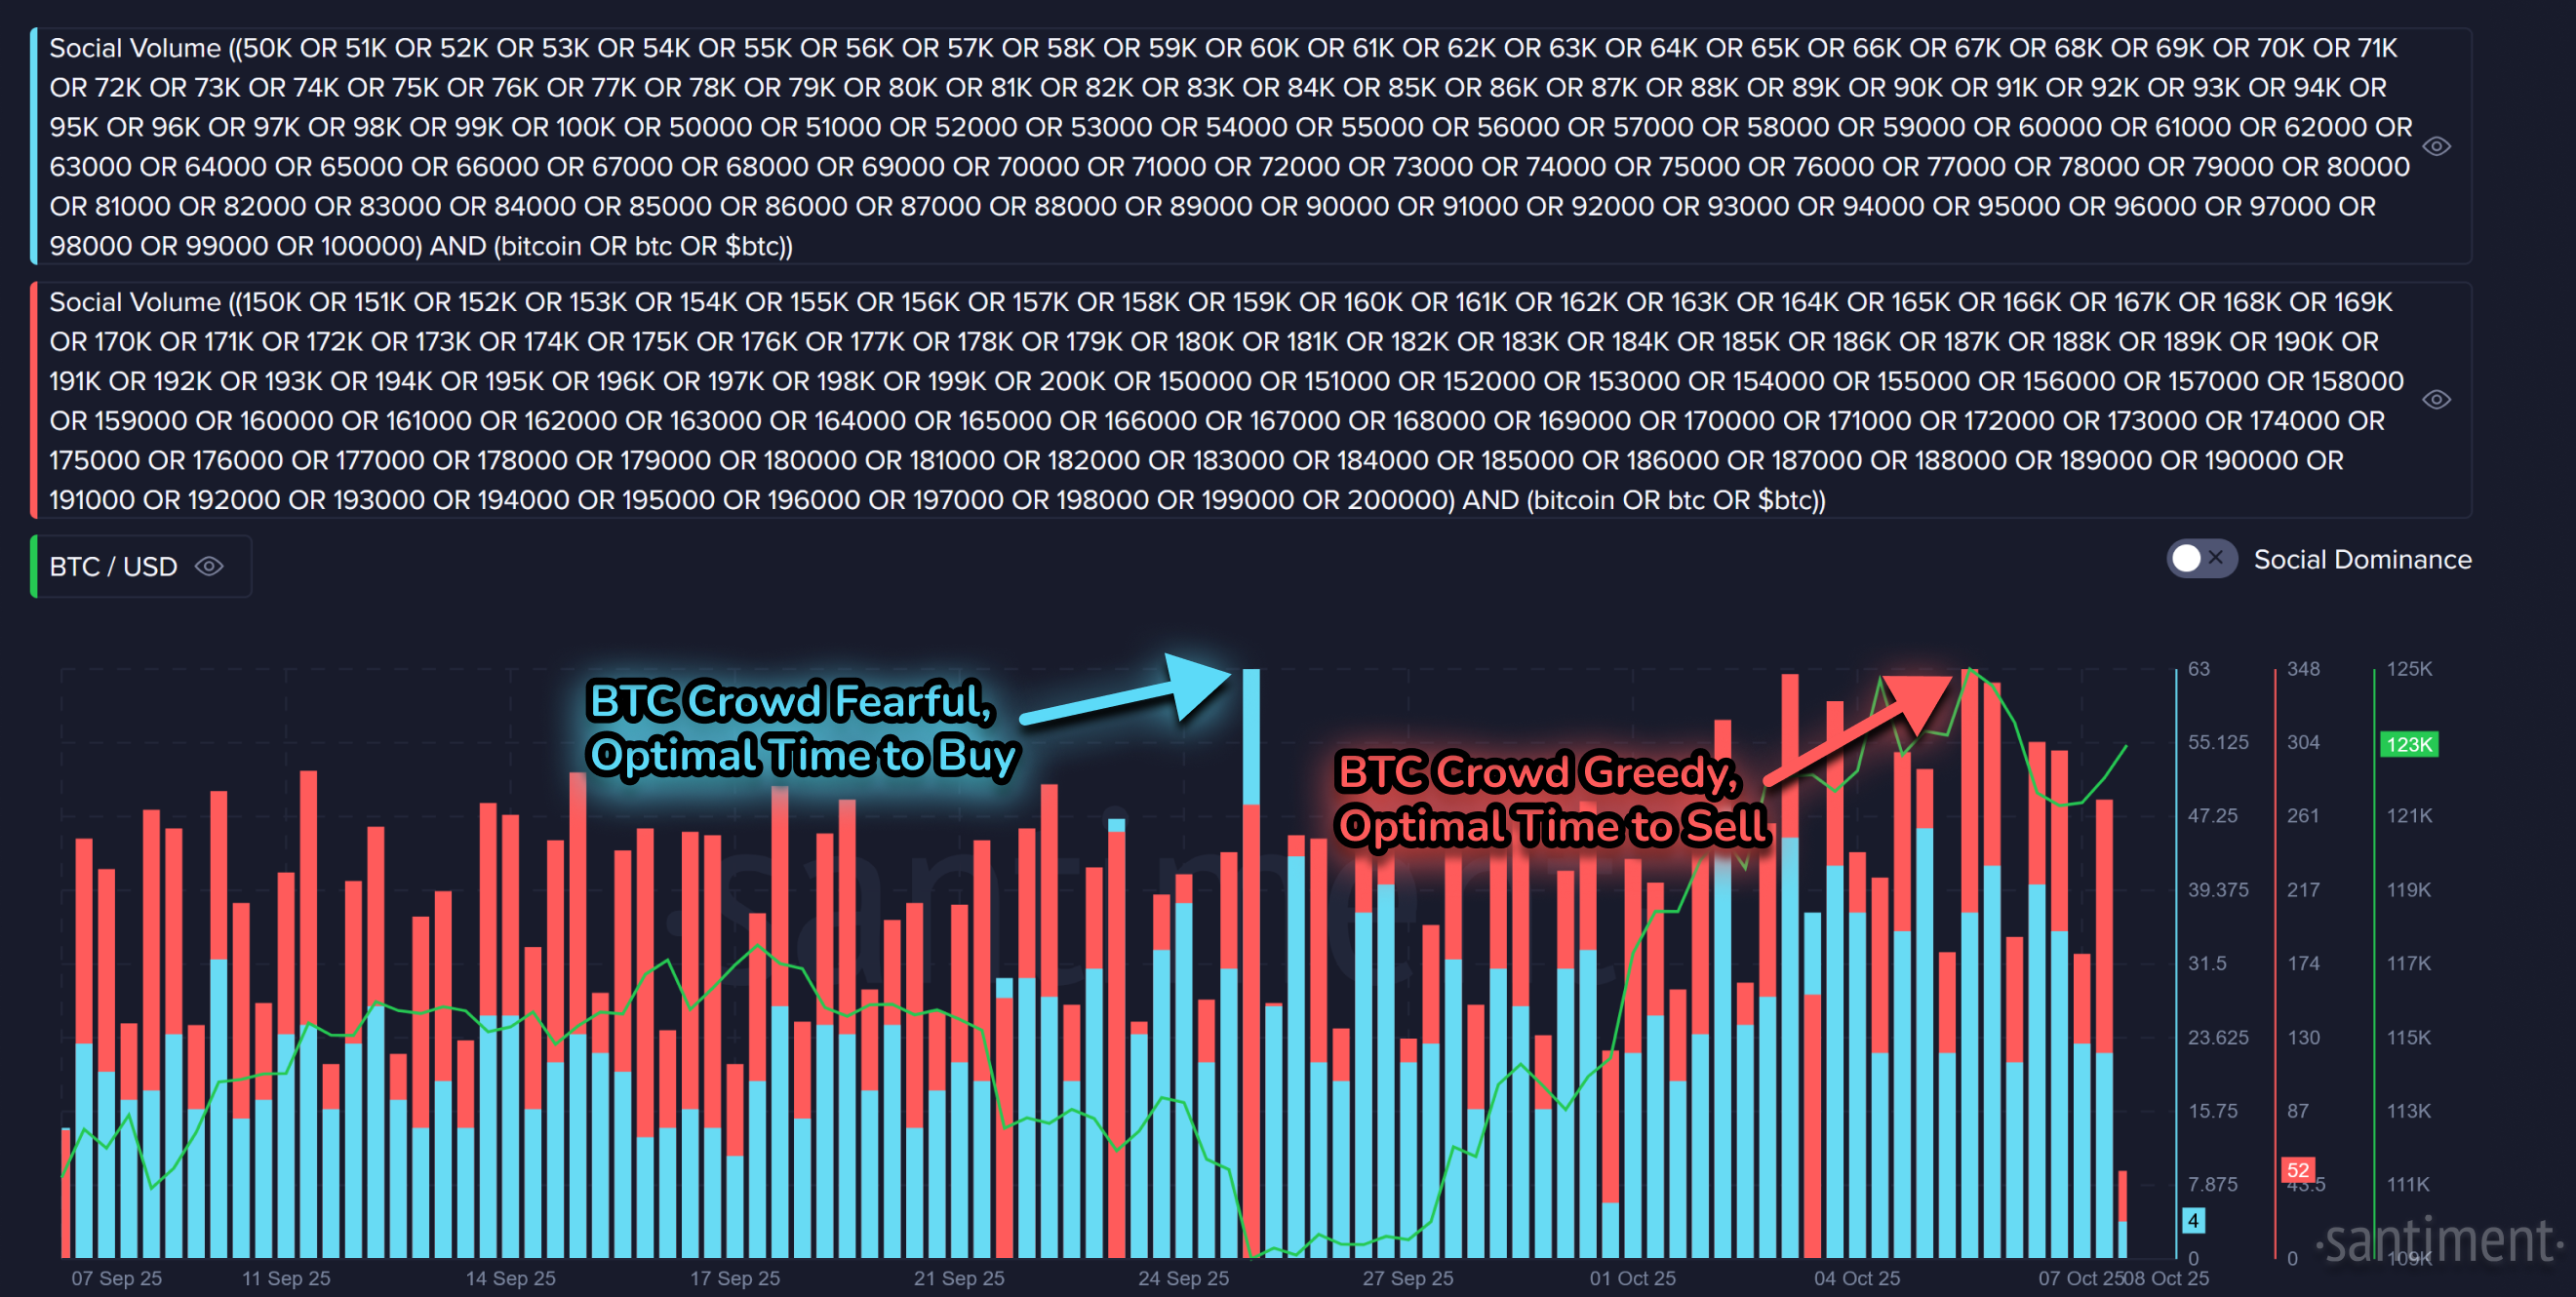
It's not a coincidence that the highest blue bar (representing crowd fear) perfectly hit right at the perfect time to buy Bitcoin. And the highest red bar (representing crowd greed) perfectly hit at the perfect time to sell.
Ethereum
Just like with Bitcoin, we can plot higher or lower values for Ethereum as well. Here is what we see for it below, with the associated link that you can bookmark here.
🟦 bars represent all mentions of 1K-4K (or the full numbered 1,000 to 4,000 irrelevant of commas)
🟥 bars represent all mentions of 6K-8K (or the full numbered 6,000 to 8,000 irrelevant of commas)
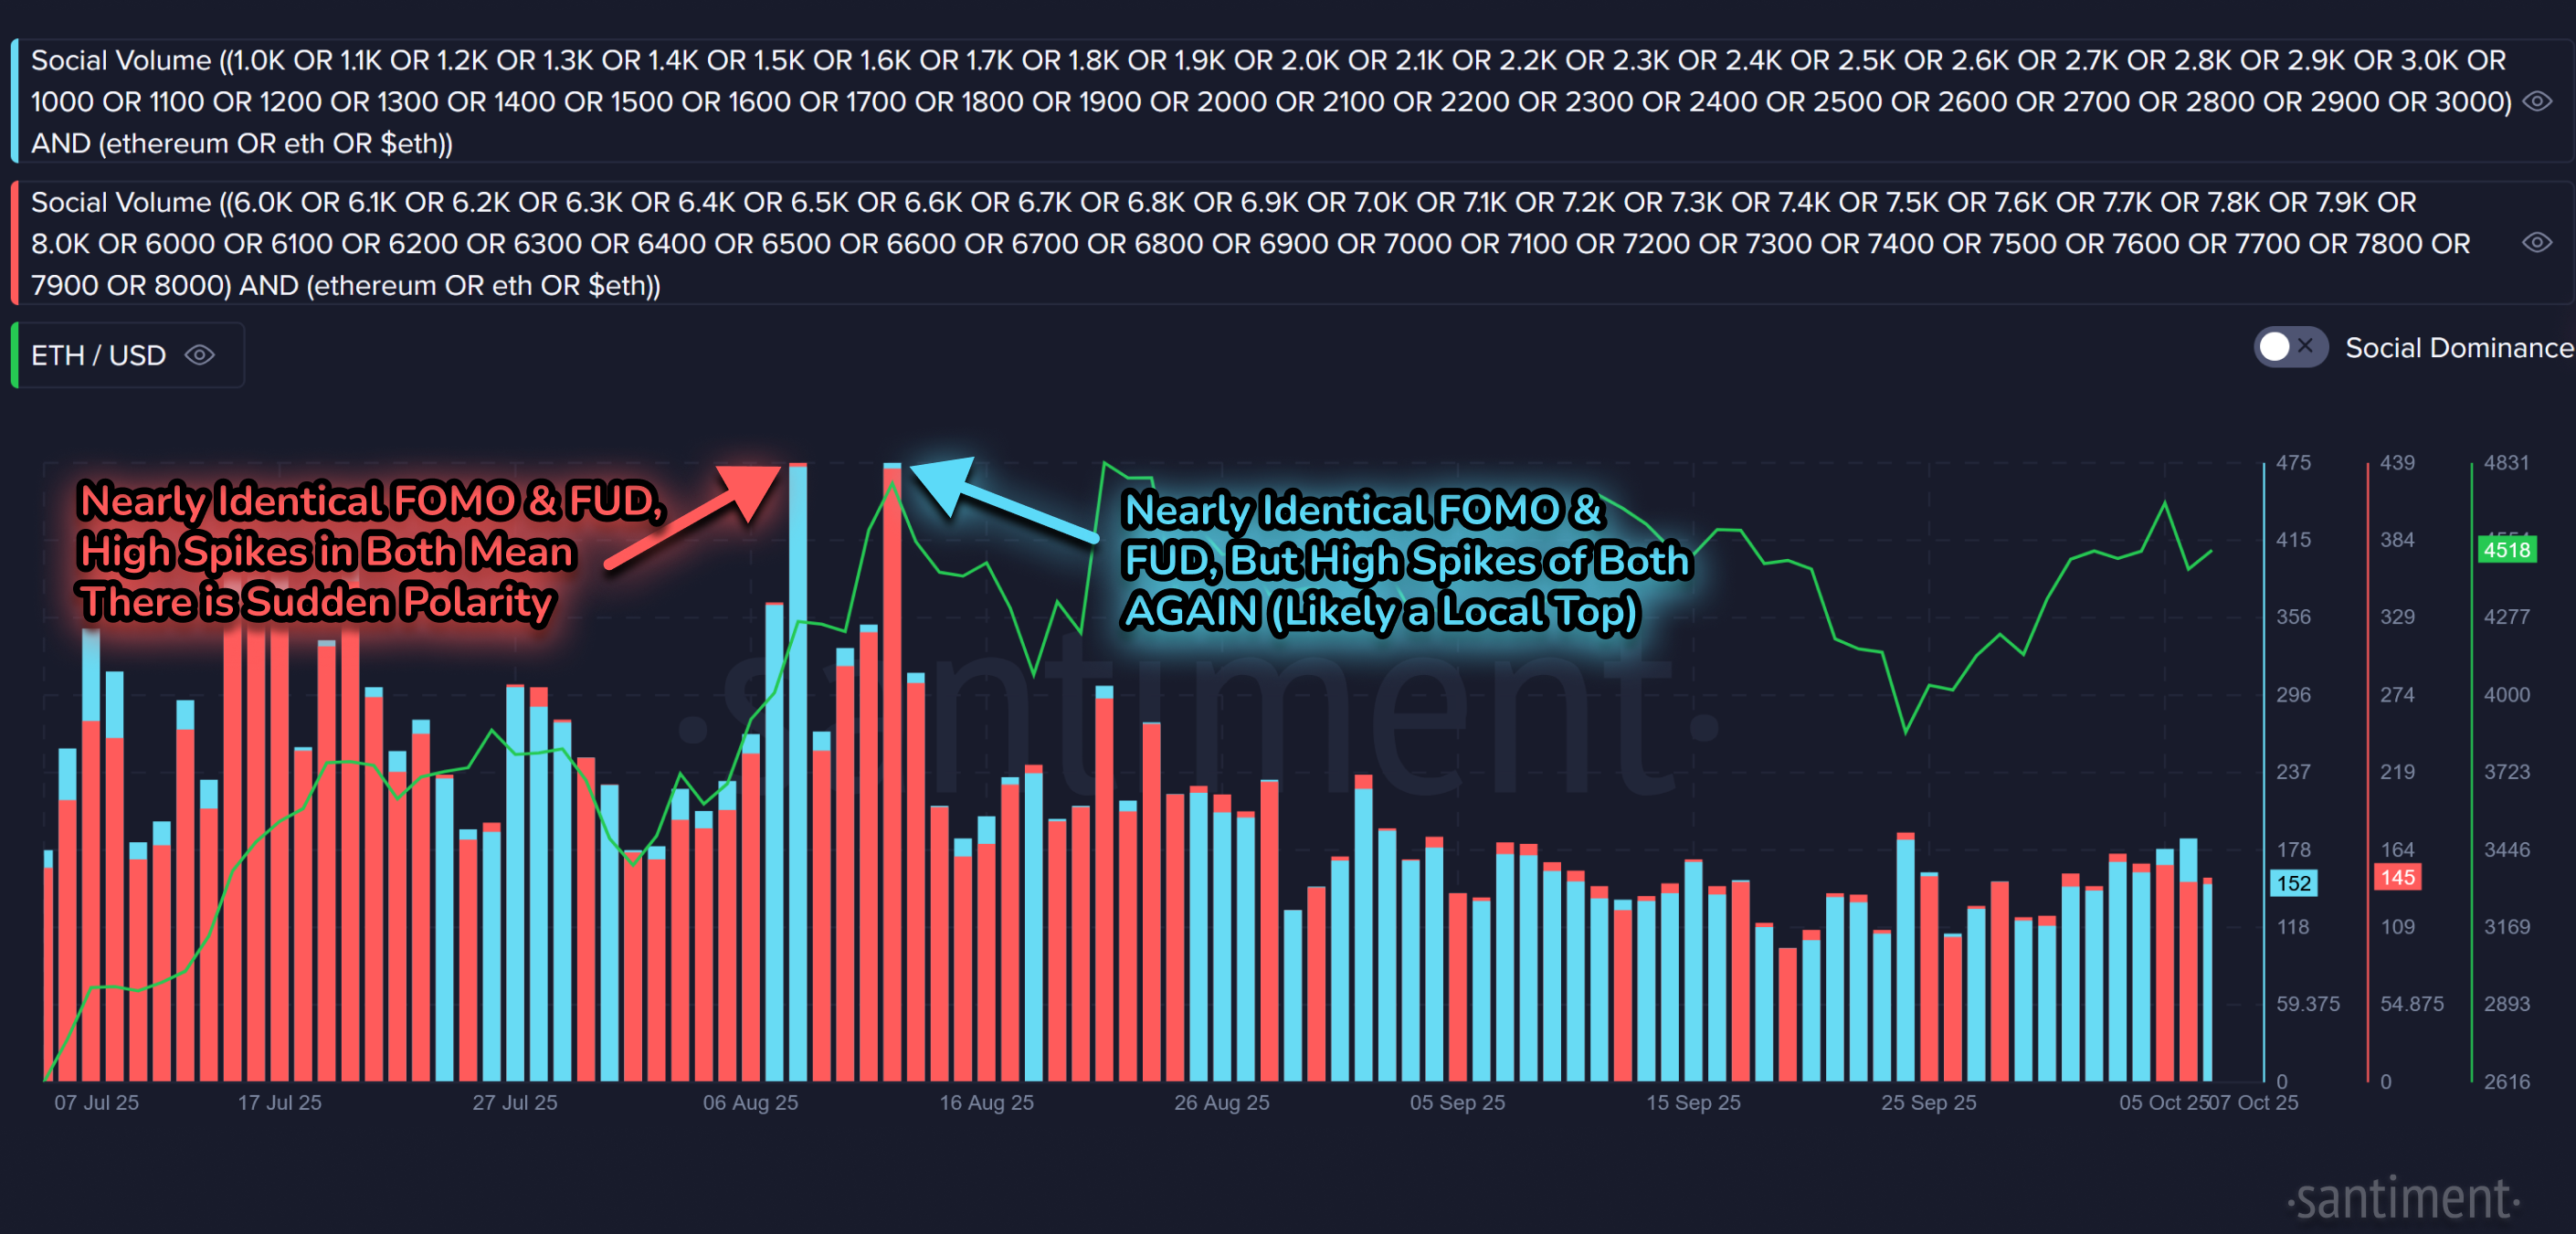
This one is a bit trickier than Bitcoin. Obviously, no coin gets quite as much discussion as crypto's #1 market cap, so even Ethereum will fall victim to a smaller sample size of data. To remedy this, we've zoomed out to daily candles over 3 months.
In doing so, we see two prominent spikes much higher than the rest. And they occurred during the August rally. We can see that both the lower and higher price mentions spiked in unison two separate times. Essentially, there were many bulls and bears that simultaneously became vocal about ETH. On the first time, it was in the midst of the rally. But the second time around, the social interest contributed to a top. When there is a sudden prominent spike in social interest overall, without much of a bullish or bearish bias, it's typically the second spike you need to watch out for.
Conclusion
We will be the first to admit that finding consistently reliable patterns with this "price mention" approach sometimes takes a bit of maneuvering through candle granularity and zooming in/out. But once you find nice consistency with a coin, it can be like discovering the holy grail of indicators.
Regardless, these Bitcoin & Ethereum examples are just a couple of the fun possibilities of Santiment's Social Trends queries. Interested in having us dive further to look at coins like XRP, Solana, and more? Let us know!
-----
Free two-week trials to Sanbase PRO (to access all mentioned Santiment data in this article, and plenty more) are AVAILABLE HERE!
-----
Disclaimer: The opinions expressed in the post are for general informational purposes only and are not intended to provide specific advice or recommendations for any individual or on any specific security or investment product.