This Week in Crypto, Full Written Summary: W4 October

Whales Are Selling and the Market is Scared

Executive Summary
For those short on time, here are the key takeaways from this week's crypto market analysis:
- Major Bearish Signal: Bitcoin whales are in a distribution phase, having sold off approximately 24,300 BTC in the last 18 days. This is historically a strong indicator of potential price declines.
- Fed-Induced Volatility: Federal Reserve announcements continue to create "fakeouts," trapping retail investors who trade the news. The market's reaction is often the opposite of what is logically expected.
- Retail Sentiment May Indicate Trap: Optimism is returning to retail traders. Historically, this shift in sentiment after a price drop can be a contrarian signal, often preceding further downside.
- Ethereum Shows Potential: While Bitcoin's metrics are concerning, Ethereum's short-term MVRV ratio has dropped into an "opportunity zone," suggesting it may be undervalued and poised for a potential bounce.
- The Path to the Next Rally: The next major bull run may be signaled by two key events: whales resuming their accumulation and retail investors showing signs of capitulation (selling).
Introduction
In crypto, emotions can run high, but data tells the real story. This week we joined forces with the Thinking Crypto podcast, as Tony Edward and Brian both examined the on-chain metrics for Bitcoin, Ethereum, and other major altcoins. The discussion revealed some concerning signals from large investors and predictable chaos surrounding the Federal Reserve's latest announcements. Let's explore last week's key data points.
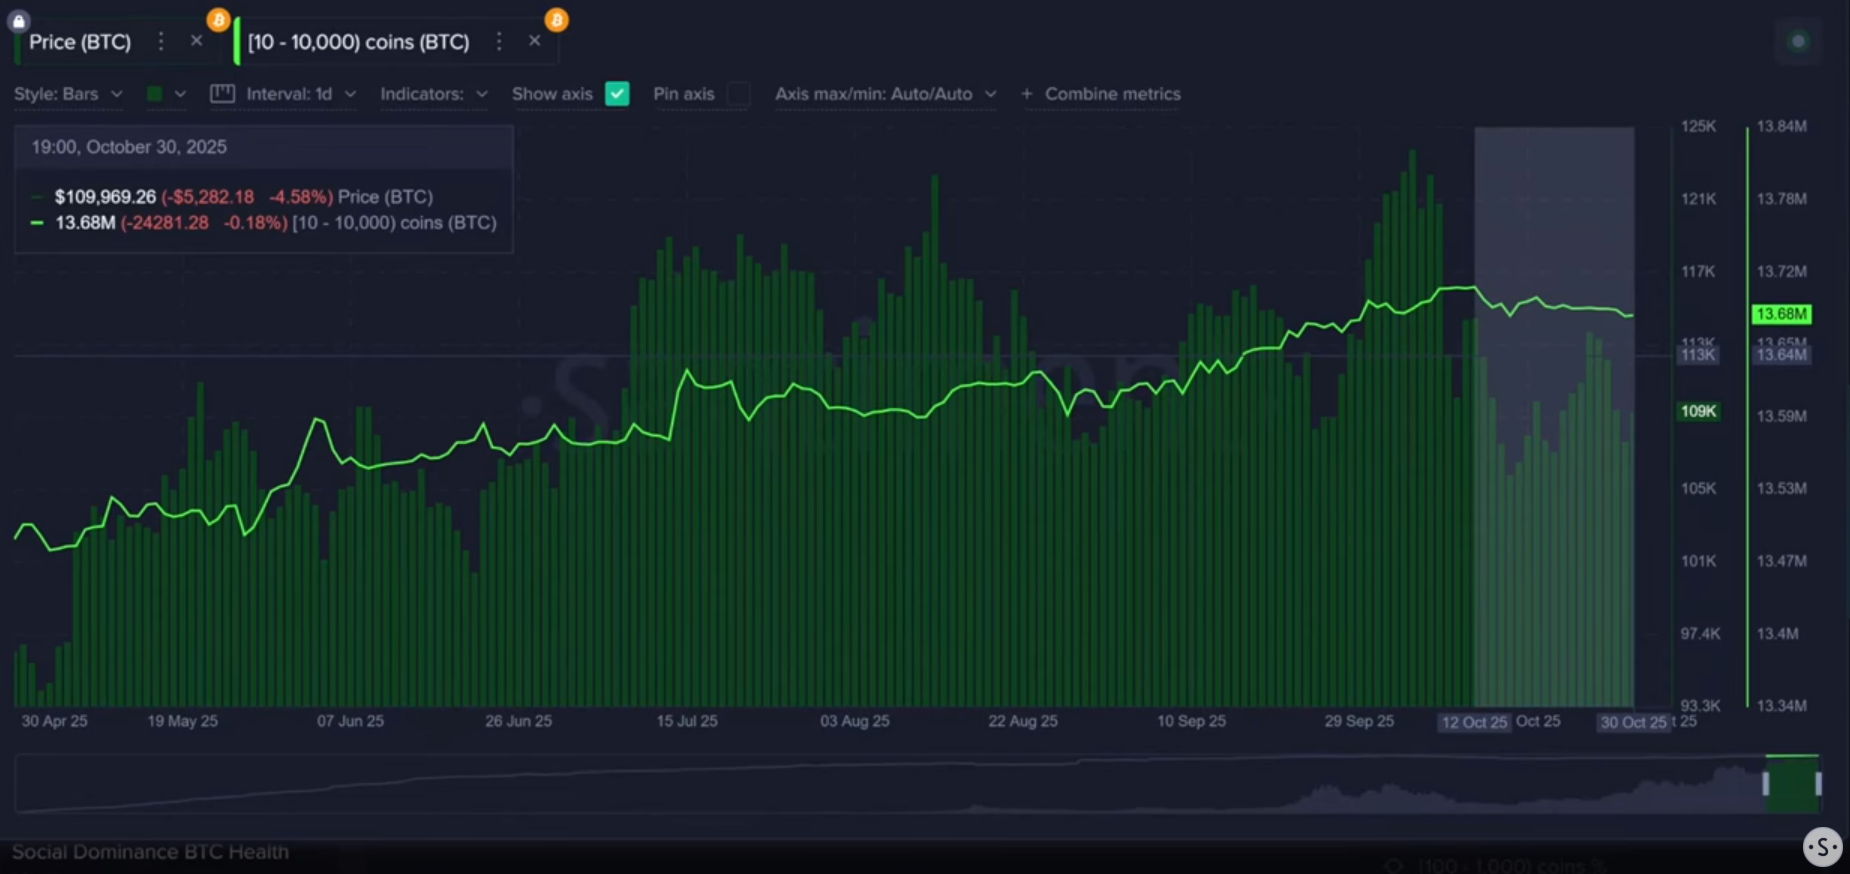
Miners Selling Off: A 24K Bitcoin Drop in 18 Days
The conversation started with a critical look at Bitcoin miners. Brian pointed out a significant trend: miners have sold approximately 24,300 Bitcoin in just 18 days. This is a notable shift from their usual behavior of accumulating. Historically, when miners stop buying and start selling, it often signals an upcoming price drop. This sustained selling pressure is a key factor for the market's current weakness.
- Key Data: Approximately 24,300 Bitcoin have been sold by miners over the last 18 days.
- Actionable Tip: Track the holdings of large wallet cohorts. A sustained period of selling from these key players can be a strong bearish indicator for the medium term.
Fear Grips the Market After Fed's Rate Cut Announcement
Despite the Federal Reserve announcing a rate cut—typically good news for markets—investors reacted with fear. Tony and Brian discussed the immediate volatility that followed the decision. The market saw a sharp downturn, followed by a minor relief rally. This confusing price action left many wondering if the market is safe or if another drop is coming, highlighting deep uncertainty.
- Key Data: The Fed's rate cut announcement was followed by market fear and volatility, not the expected positive rally.
- Actionable Tip: During weeks with major economic news, be prepared for unpredictable price swings that may not align with traditional market expectations.
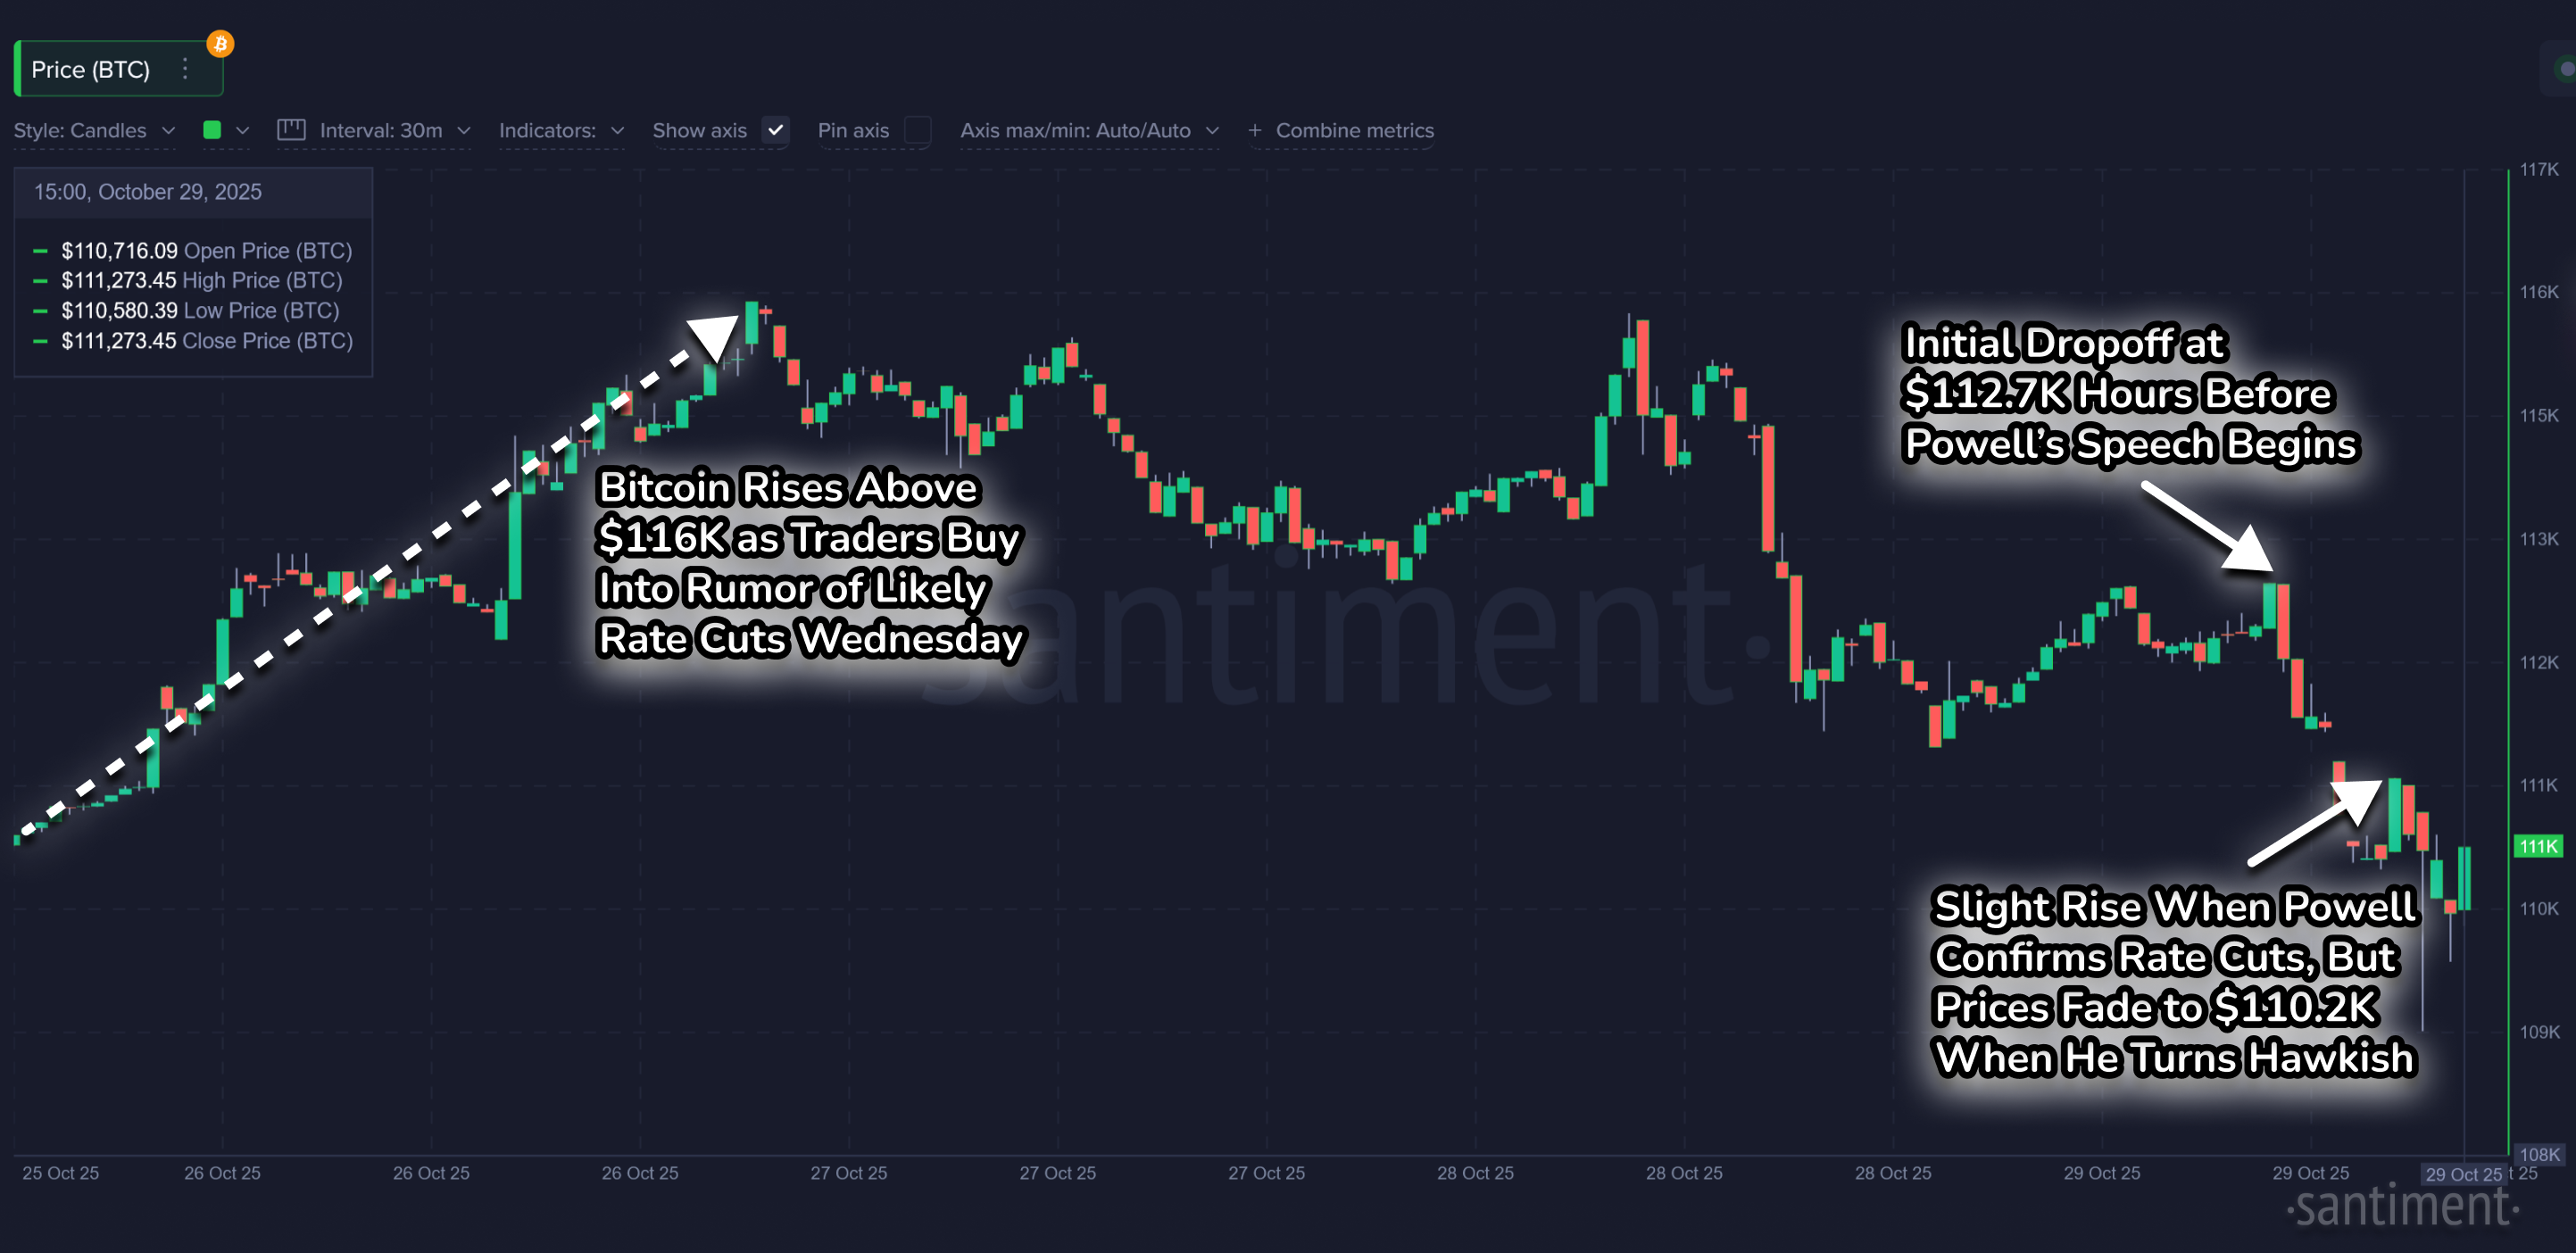
Decoding The Fed's Fakeouts: How Whales Trick Retail Investors
Brian explained how experienced investors, or "whales," often use Fed meetings to their advantage. He described a classic "buy the rumor, sell the news" scenario. Before the recent meeting, prices rose as retail investors bought in anticipation of good news. However, just before the announcement, whales began to sell, causing a sharp drop. Brian noted, "whatever the retail crowd expects, the opposite tends to occur."
- Key Data: Whale transactions spiked just before the Fed's announcement, preceding a sharp price drop while retail was still buying.
- Actionable Tip: Be cautious when a market narrative seems too obvious. Often, the most anticipated outcome is used by larger players to create a market reversal.
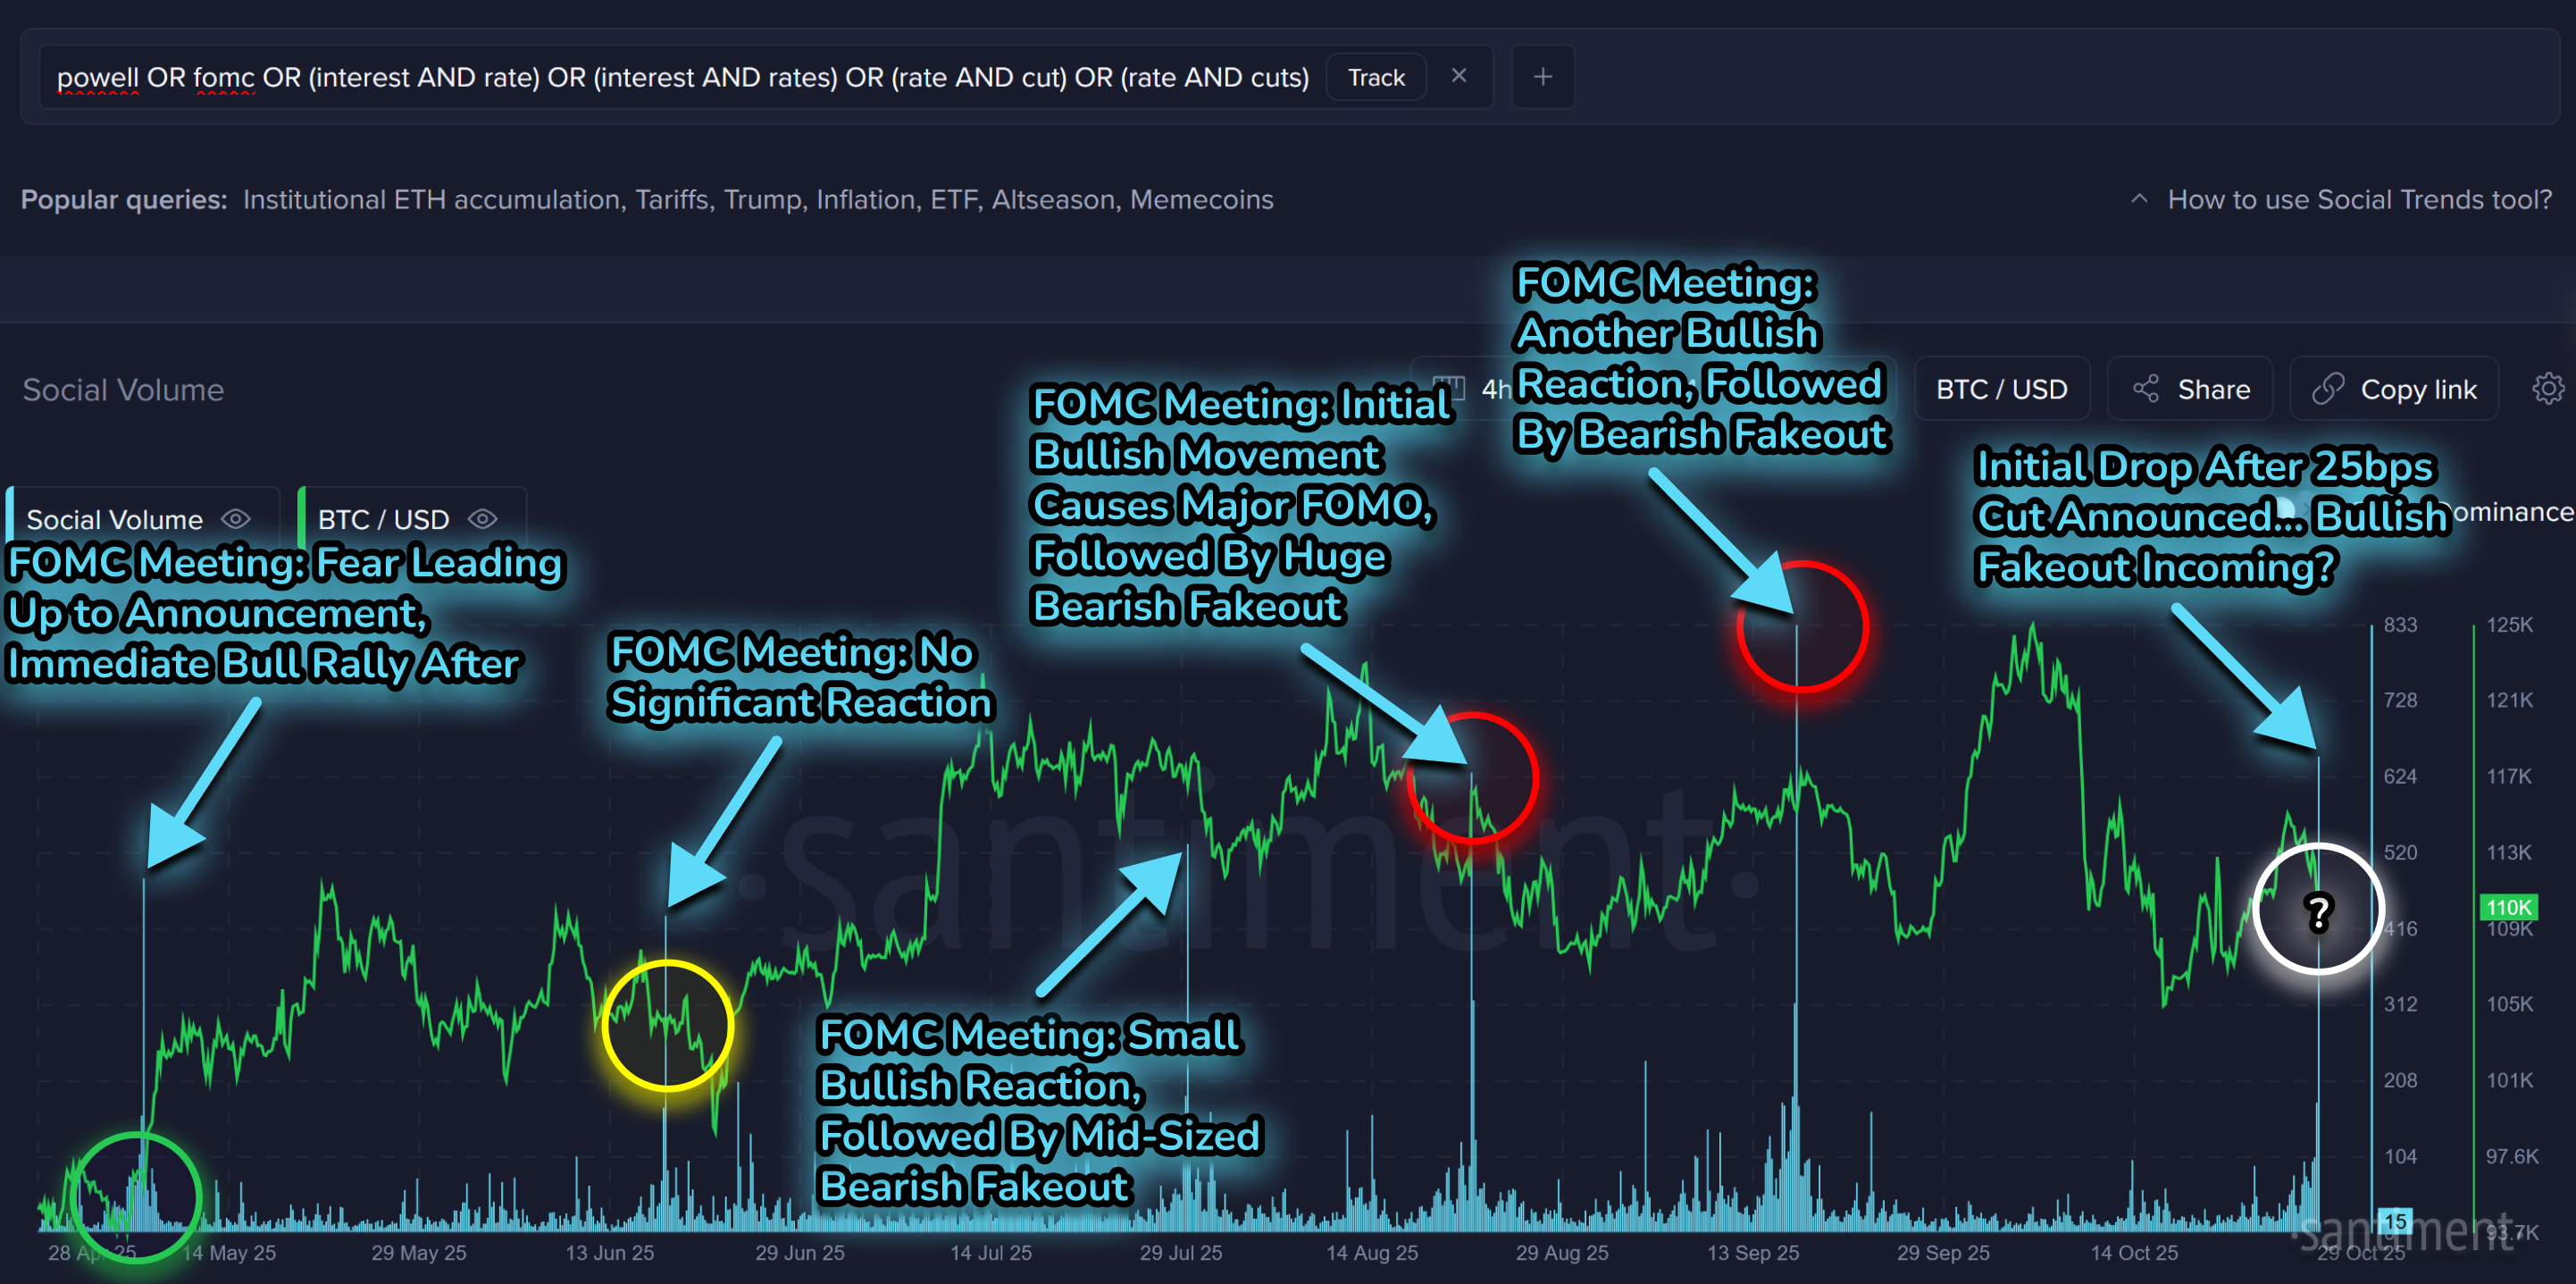
A Year of Deception: Charting the Fed's Crypto Market Traps
Expanding on this theme, Brian presented a chart covering all of the Fed's 2025 meetings. It revealed a consistent pattern of "fakeouts" where market movements defied logical expectations. Each meeting seemed to create a trap for investors who were following the obvious narrative. The main lesson from this year-long analysis is to "expect the unexpected" during FOMC weeks, as retail sentiment is often used as a counter-signal by larger market players.
- Key Data: Analysis of every 2025 FOMC meeting showed a recurring pattern of price action faking out retail investors.
- Actionable Tip: Instead of just reacting to news, review how the market has behaved during similar past events to better anticipate potential patterns.
Trump, China, & CZ: How Political News Drives Social Sentiment
The discussion also covered how political events influence the crypto market. Brian showed social data trends related to three key topics: the pardon of Binance's founder CZ, talks between Trump and Russia, and the ongoing US-China trade dispute. Each of these news items caused major spikes in online discussion and corresponded with significant market volatility.
- Key Data: A spike in social media conversations about "tariffs" directly coincided with a market bottom, which was immediately followed by a bounce.
- Actionable Tip: Use social trend tools to monitor keywords related to major political events. A sudden surge in discussion can signal imminent market volatility.
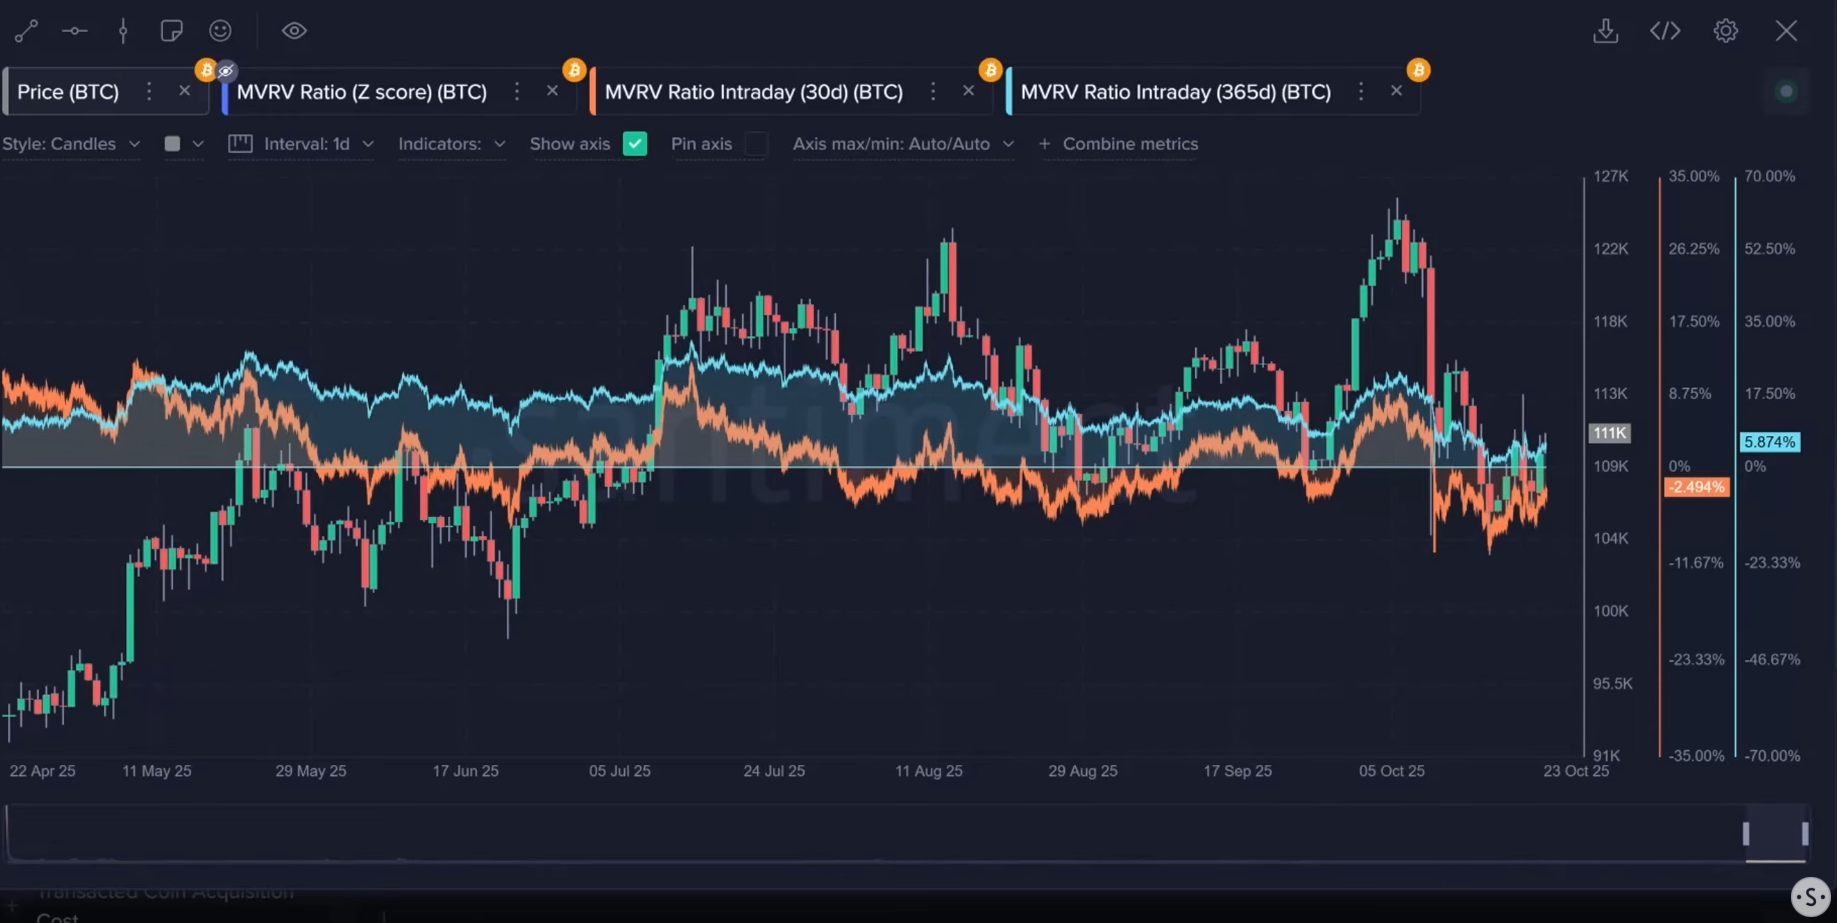
Bitcoin's MVRV Reset: Are We in a Danger Zone or a Buying Opportunity?
Looking at Bitcoin's Market Value to Realized Value (MVRV) ratio, Brian offered a neutral perspective. The short-term 30-day MVRV is slightly negative (-2.5%), while the long-term 365-day MVRV is slightly positive (+5.8%). He described this as a "pretty average situation," suggesting the market is not in an extreme danger zone of being overbought.
- Key Data: The 30-day MVRV stands at -2.5%, indicating short-term holders are at a slight loss, while the 365-day MVRV is at +5.8%.
- Actionable Tip: When MVRV ratios are near zero, it suggests the market is at a point of equilibrium. Look for other indicators to get a sense of the next potential direction.
Retail Sentiment Flips Positive: Why This Could Be a Bad Sign
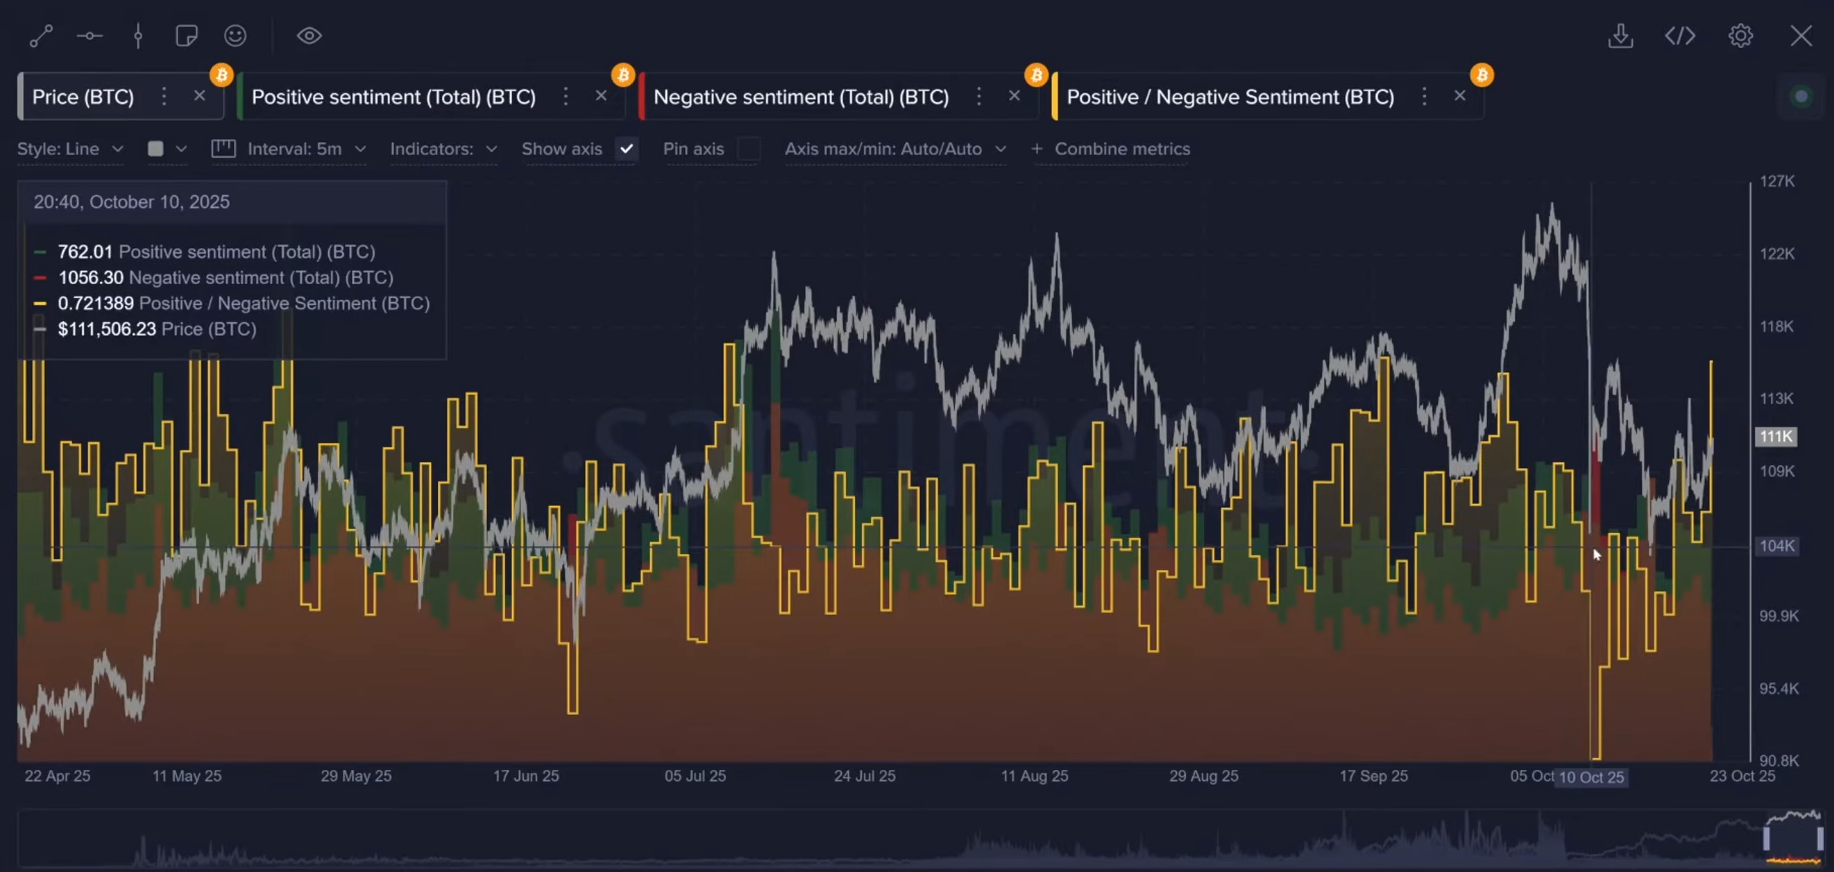
In a surprising twist, sentiment among retail traders has turned positive again. After weeks of fear and negativity, the average investor is showing renewed optimism. Brian sees this as a concerning, contrarian signal. He explained, "We don't want to see retail starting to cheer up." Historically, when the crowd becomes bullish after a price drop, it can often precede another move downward.
- Key Data: Social sentiment among retail traders has become one of the most positive in the last three months, despite bearish on-chain signals.
- Actionable Tip: Use crowd sentiment as a contrarian indicator. Extreme optimism from retail investors can often signal a local top or a continuation of a downtrend.
Overcoming Emotion: Using Data to Navigate a Volatile Market
Tony shared that relying on data helps him stay objective, even when his portfolio is down. The numbers reveal cyclical patterns that are easy to miss when emotions take over. Brian agreed, noting the frustration of seeing "artificial noise and manipulation" affect the market. Their conversation underscored the importance of a data-first approach.
- Key Data: The speakers highlighted that cyclical patterns in data are more reliable than emotional reactions to news and price swings.
- Actionable Tip: Before making a decision based on emotion, consult a few key data points (like MVRV, whale activity, or sentiment) to gain a fuller perspective.
Ethereum's Predictable Trap: How Exchanges Liquidate Traders
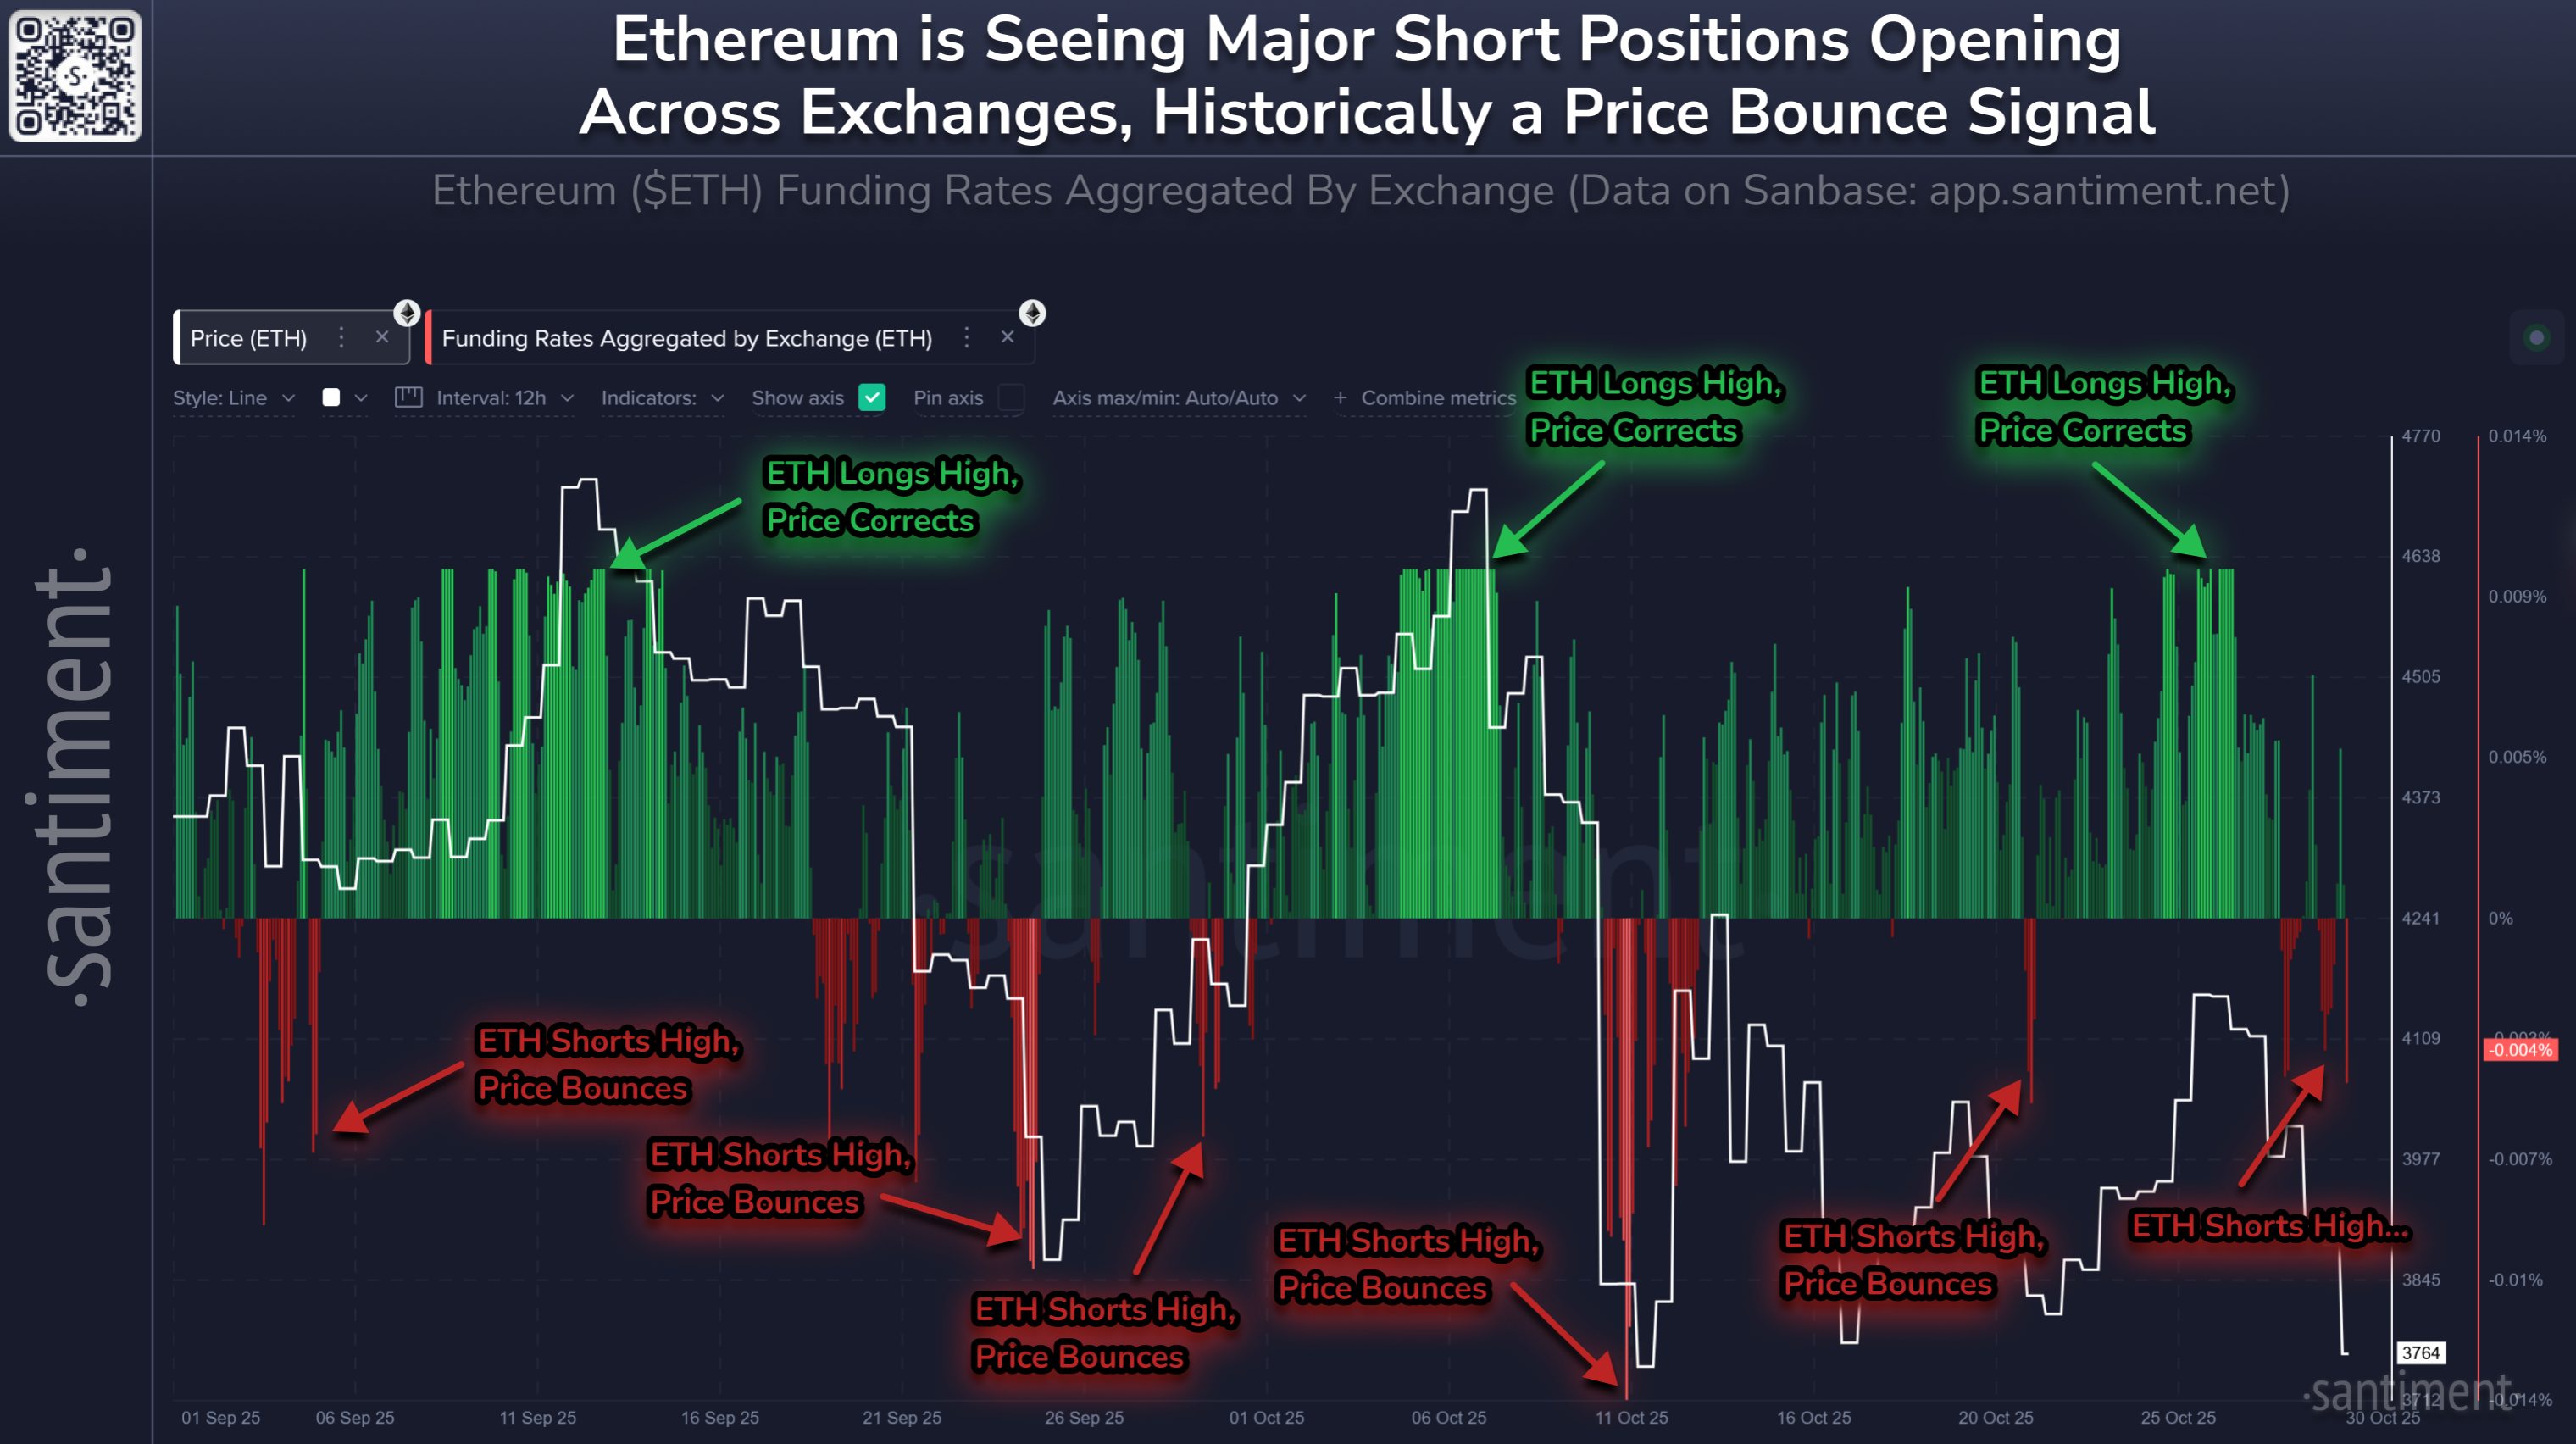
Brian highlighted a fascinating and predictable pattern in the Ethereum market. Using a chart of aggregated funding rates, he showed how traders are consistently caught on the wrong side of the market. When a majority of traders are shorting, the price tends to rally, liquidating their positions. Conversely, when most are longing, the price often drops.
- Key Data: Ethereum's aggregated funding rate chart shows a strong, cyclical pattern of price moving against the majority of leveraged traders.
- Actionable Tip: Monitor funding rates. When rates become extremely positive (too many longs) or negative (too many shorts), it can signal a high probability of a price reversal.
XRP Sentiment Analysis: Is a Relief Rally on the Horizon?
The analysis then turned to XRP, where social sentiment is on the rise(Use this chart layout to see.) While growing optimism can sometimes reduce the chances of a price surge, Brian also pointed out that XRP holders have endured significant losses. The asset is down over 30% since mid-July. This prolonged "pain" could set the stage for a relief rally.
- Key Data: XRP has declined by 30.5% since mid-July, causing significant pain for long-term holders.
- Actionable Tip: For assets in a prolonged downtrend, a combination of deep investor pain and a slight recovery in sentiment can sometimes precede a short-term relief rally.
The Trump Effect: How One Man's Words Create Crypto Chaos
The speakers reflected on the outsized impact of Donald Trump on the crypto markets. From his election sparking a rally to his tariff announcements triggering sell-offs, his words and actions have consistently been a major source of volatility. Brian stated that "Trump has undoubtedly been the biggest buzzword related to crypto."
- Key Data: The name "Trump" is identified as one of the most impactful keywords causing volatility in the crypto markets.
- Actionable Tip: Set up news alerts for key political figures known to impact markets. Being aware of breaking news can help you anticipate potential volatility.

Ethereum's MVRV Signals a "Juicy" Short-Term Buying Opportunity
For Ethereum, the MVRV ratio is painting a potentially bullish short-term picture. The 30-day MVRV recently fell to -10.5%, a level Brian described as an "opportunity zone." Historically, when this short-term metric dips below -10%, it has signaled a good time to buy.
- Key Data: Ethereum's 30-day MVRV dropped to -10.5%, a level historically associated with market bottoms and buying opportunities.
- Actionable Tip: Use the MVRV ratio to identify potentially over- and under-valued conditions. A 30-day MVRV below -10% has historically been a strong signal of an oversold market.
The Ultimate Bull Run Signal: What Whales and Retail Must Do Next
To close, Brian shared two key signals that could herald the next major bull run. First, the whales must stop selling and begin accumulating again. Second, retail investors need to show signs of capitulation by selling off their holdings. He showed how in the past, when retail sold, prices "went bananas."
- Key Data: A historical chart showed that major price rallies occurred when retail wallets were decreasing their holdings, not increasing them.
- Actionable Tip: For long-term trend analysis, watch for a divergence between whale and retail behavior. Whales buying while retail is selling has historically been a powerful bullish signal.
Conclusion
This week's analysis shows a market at a crossroads. Conflicting reaction from Fed policy news, whale behavior, and retail sentiment create an environment of deep uncertainty. The market is likely to go lower before it turns around, this analysis which occurred on Friday Oct 31st reflected accurately today’s negative price action, on Monday Nov 3rd.
To get the full analysis, be sure to watch the complete livestream. To get more data-driven crypto analysis, subscribe to our YouTube channel, our Substack, or follow us on Santiment Insights.