
This Week in Crypto, Full Written Summary: W3 March 2026

Can Crypto Break Out of Sideways Action With All the CHAOS Happening Around It?
Executive Summary
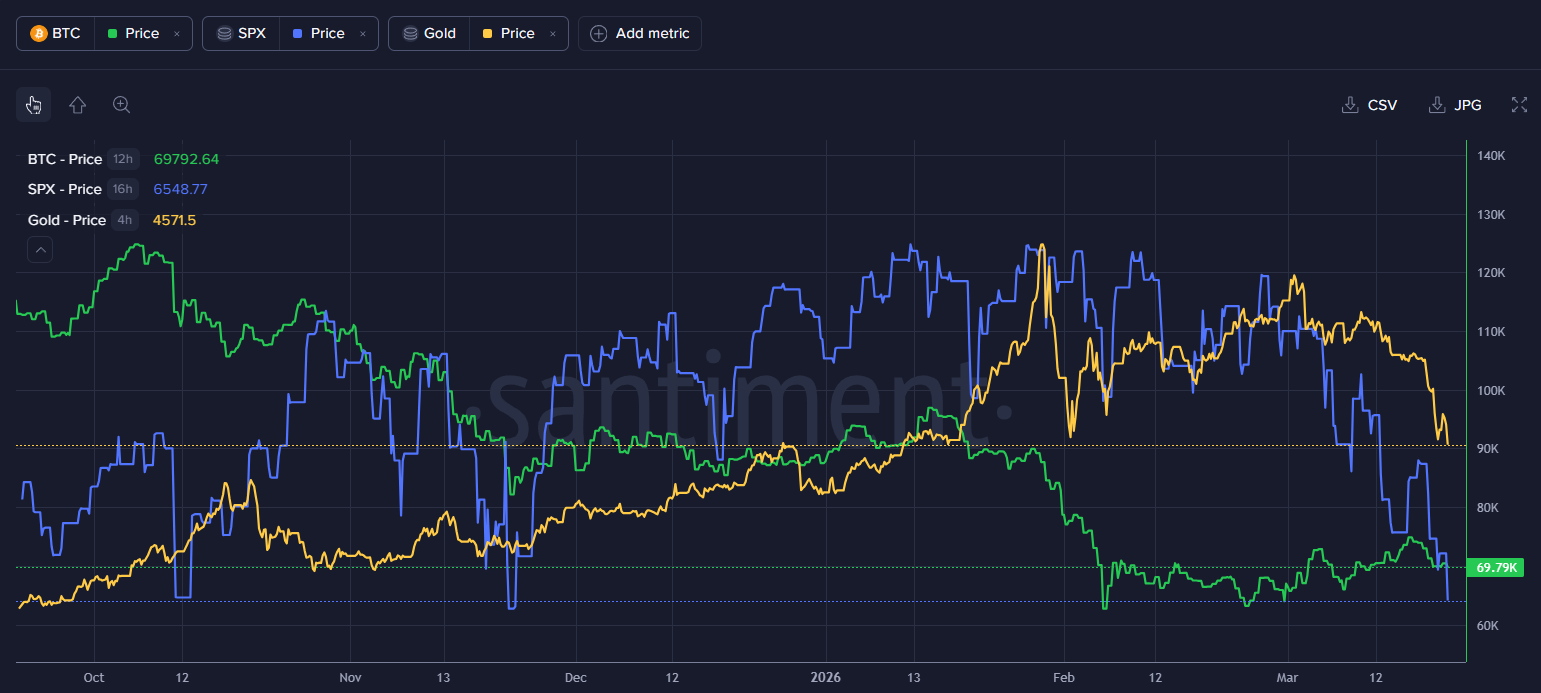
- Crypto Decoupling from Traditional Markets: While the S&P 500 and Gold have faced significant retracements (Gold down nearly 10%), Bitcoin has shown remarkable relative strength, only retracing about 4.5%.
- Retail vs. Whale Divergence: Small retail wallets (less than 0.01 BTC) are aggressively accumulating, typically a contrarian bearish signal, while key whale tiers (10-10k BTC) are holding flat, awaiting clarity on global events.
- Long-Term Bullish Signals: Despite short-term sideways action, long-term metrics like the 365-day MVRV remaining negative (-26%) suggest Bitcoin is still in a historically low-risk accumulation zone.
Intro
The first quarter of 2026 is closing out with significant global volatility. From geopolitical conflicts to shifts in Fed policy expectations, markets are noisy. However, Santiment’s analysis reveals a fascinating trend: Bitcoin is outpacing traditional assets like the S&P 500 and Gold. With the "Clarity Act" potentially days away from advancing to the next step and ETF volumes hitting record highs, the team breaks down the on-chain data to see if a breakout is imminent or if further consolidation is likely.
00:00 - Intro: Bitcoin Outperforms S&P 500 Amid Global Chaos
Despite the ongoing conflict in the Middle East creating uncertainty, crypto is demonstrating resilience as a global asset class. While the S&P 500 has dropped roughly 4.5%—a massive move for traditional equities—Bitcoin has matched that percentage drop, which is essentially stability for such a volatile asset. Gold has fared worse, down nearly 10% since early March. This relative strength suggests crypto is beginning to decouple from traditional risk assets during periods of geopolitical stress.
- Key Data: Bitcoin -4.5%, S&P 500 -4.5%, Gold -10% since March 4th (chart).
- Actionable Tip: Monitor the correlation between BTC and SPX; a continued decoupling could signal a safe-haven narrative forming.
02:22 - Why You Shouldn't Force Market Timing
The team emphasizes that during periods of high noise—war, legislation, Fed rates—trades based on headlines are dangerous. The market is currently "deciding" its next direction. Instead of guessing the bottom, it is prudent to wait for confirmation from multiple signals. The current sideways chop is frustrating, but it is often where patience pays off.
- Key Data: N/A (Strategic insight).
- Actionable Tip: Avoid leverage during geopolitical headlines; wait for daily closes to confirm trends.
05:49 - Analyzing ETF Volume Spikes & Market Cap Trends
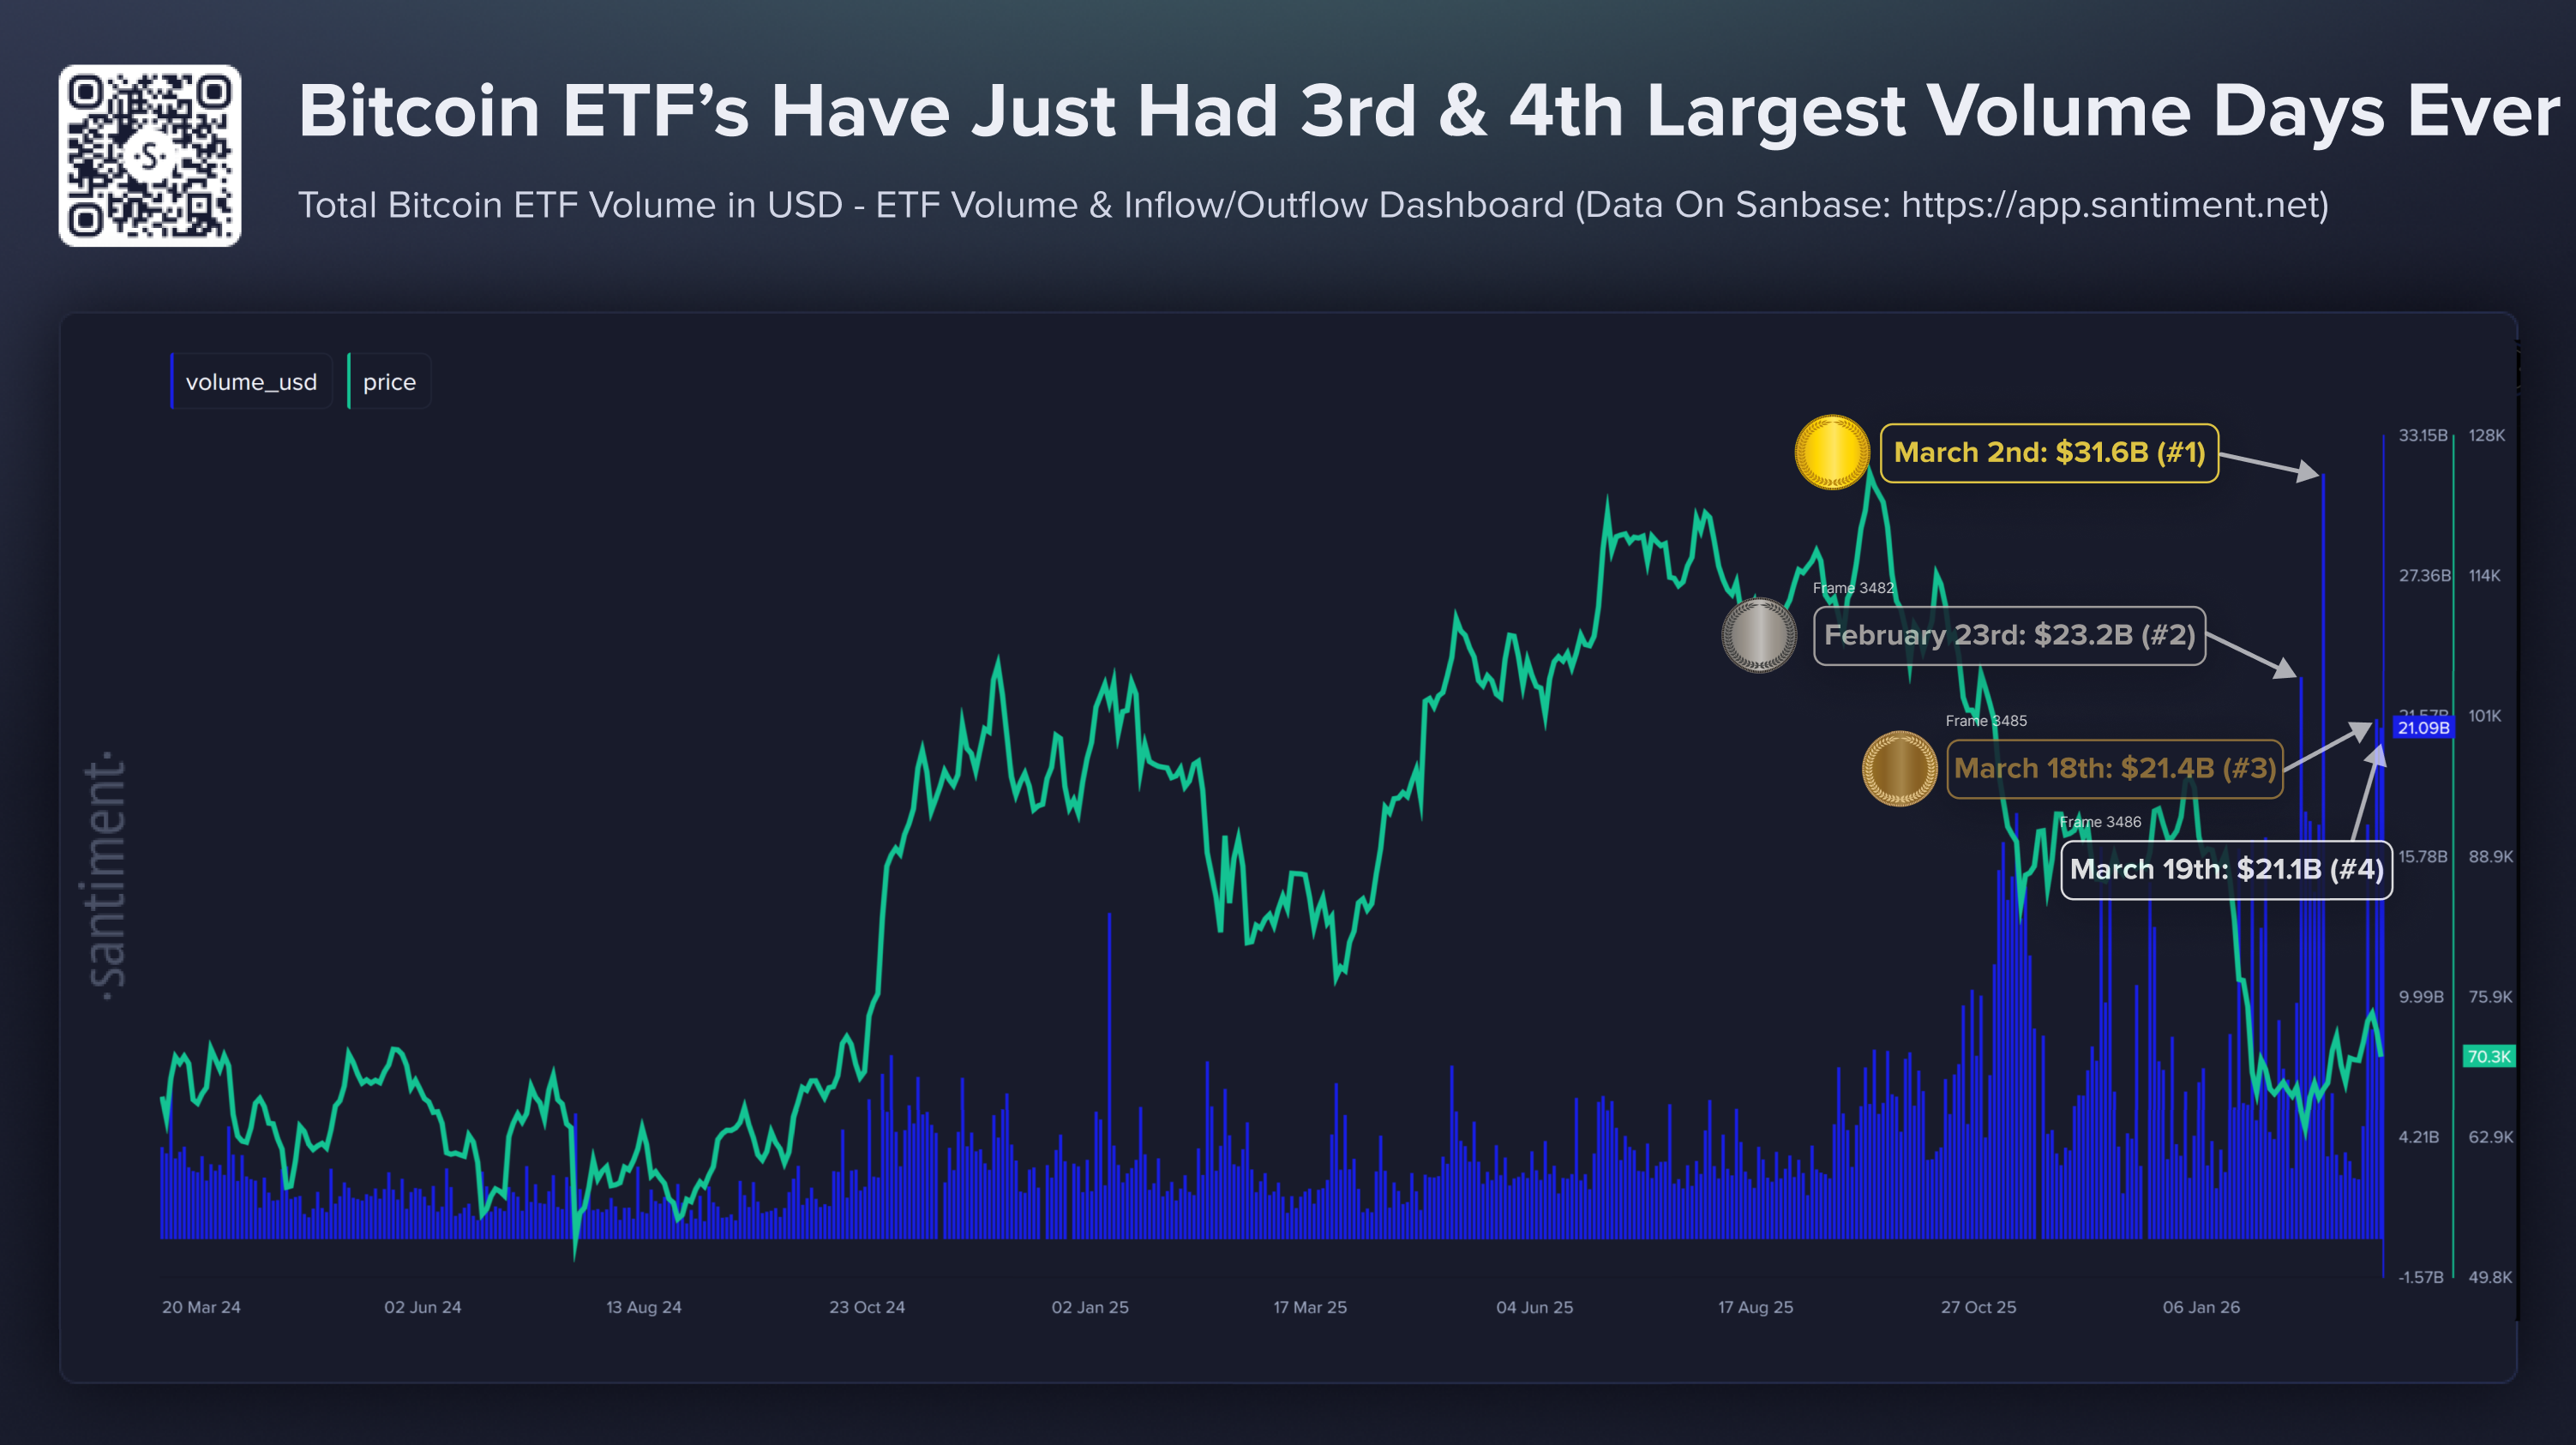
Bitcoin ETF volume has seen massive activity, recording the third and fourth-largest volume days of all time recently. Interestingly, this high volume coincided with mild outflows rather than massive inflows. Historically, huge inflow spikes often mark local tops, while outflows or neutral flows during high volume can indicate a bottoming process where assets are transferred from weak hands to strong hands.
- Key Data: Two consecutive days of ~$21 Billion in ETF volume (Free ETF Dashboard).
- Actionable Tip: Watch for high volume combined with mild outflows as a potential signal of capitulation and a local bottom.
08:53 - Gold Crash vs. Bitcoin Stability: The Real Correlation
A major narrative is the crash in precious metals. Gold and Silver have seen significant market cap erosion. While some expected an immediate rotation into Bitcoin, the data shows that capital isn't flowing there just yet. However, Bitcoin's ability to hold the $83k level or current support levels while gold plummets is a strong show of strength.
- Key Data: Gold down ~10% in two weeks.
- Actionable Tip: If Gold continues to drop while Bitcoin holds steady, look for a "digital gold" narrative to regain social dominance.
12:22 - Whale Wallets Grow Despite Price Stagnation
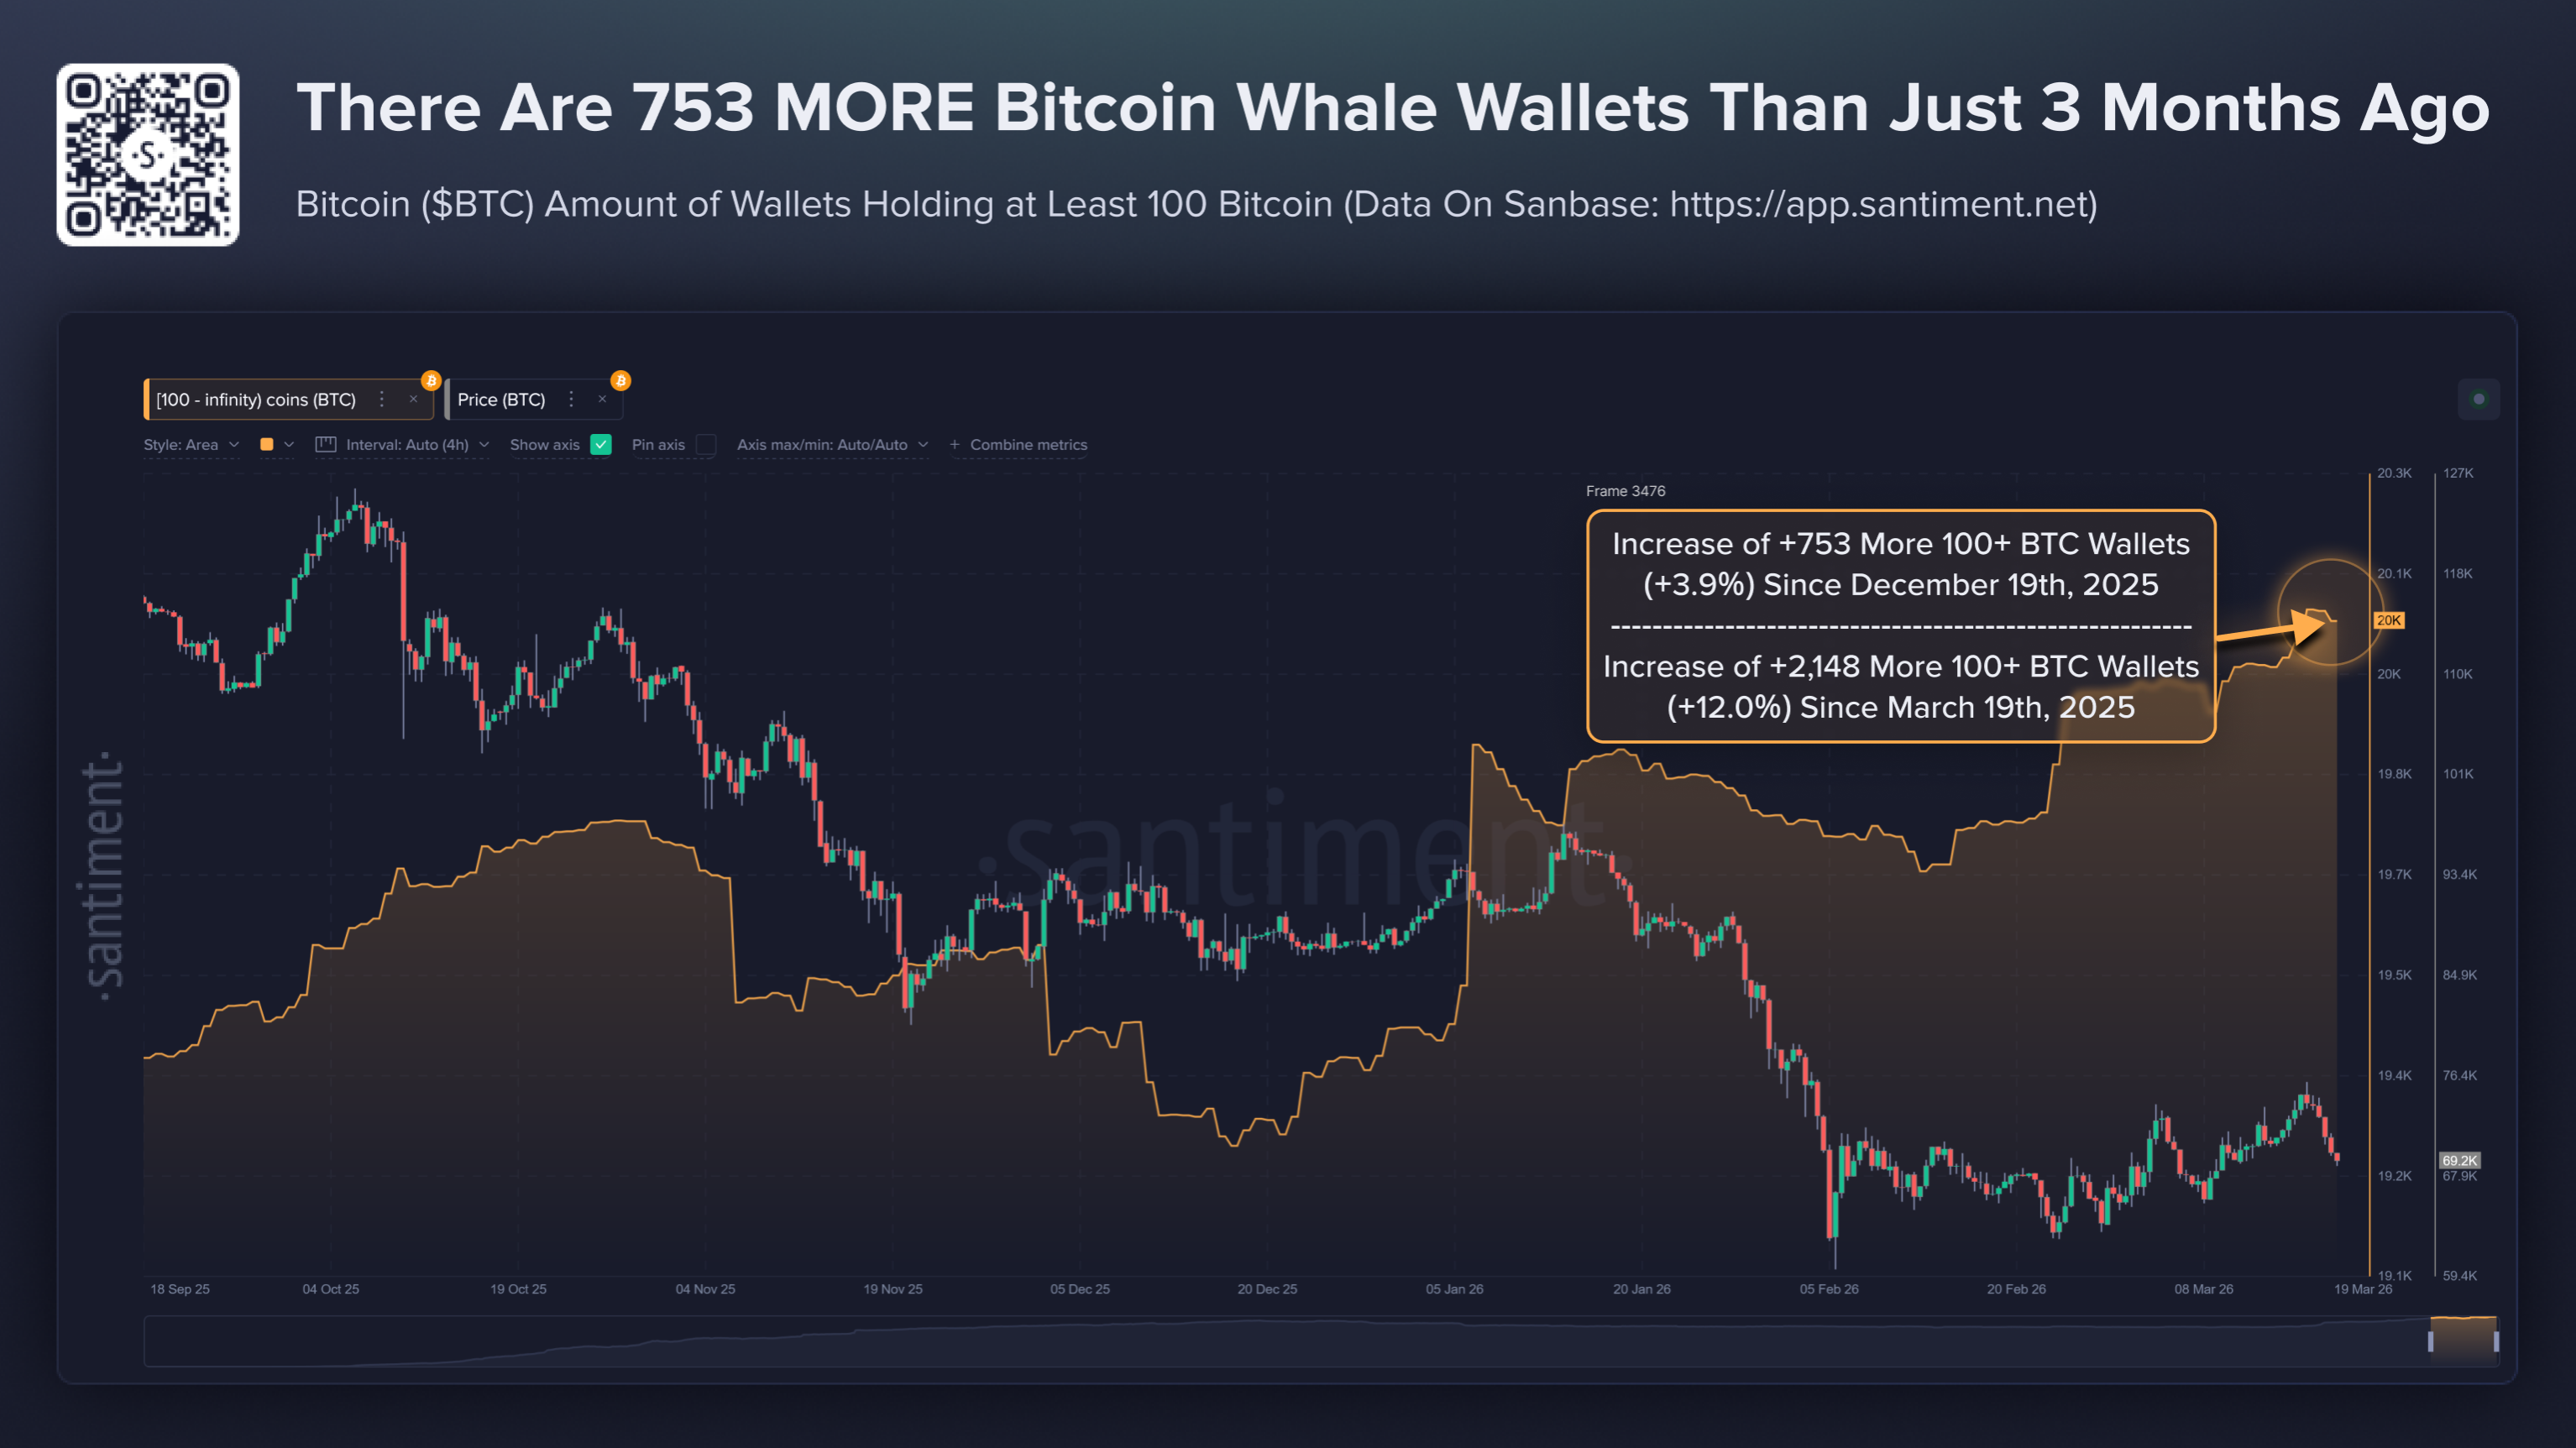
Contrary to "crypto is dead" narratives, the number of large holders is increasing. Wallets holding 100+ BTC have grown by over 750 in the last three months. This indicates that high-net-worth individuals and entities are using this period of fear and uncertainty to accumulate positions, betting on the long-term viability of the asset class.
- Key Data: +753 wallets holding 100+ BTC in the last 3 months, +3.9% (chart).
- Actionable Tip: Follow the smart money; when large wallets accumulate during flat prices, it is historically a bullish divergence.
15:24 - How News Narratives Flip Flop on Price Action
Santiment's social tools highlighted how fickle crowd sentiment is regarding the Fed. When prices were high, the crowd was bearish about the Fed holding rates. Once prices dropped and the Fed actually announced holding rates, the crowd suddenly became bullish, viewing the event as "priced in." This flip-flop demonstrates that narratives are often retrofitted to price action rather than the opposite.
- Key Data: Sentiment shifted from Bearish to Bullish on the exact same news event within 24 hours.
- Actionable Tip: Be skeptical of the majority narrative; crowd consensus on news events is frequently wrong.

17:22 - Supply Distribution: Retail Buying vs. Smart Money Holding
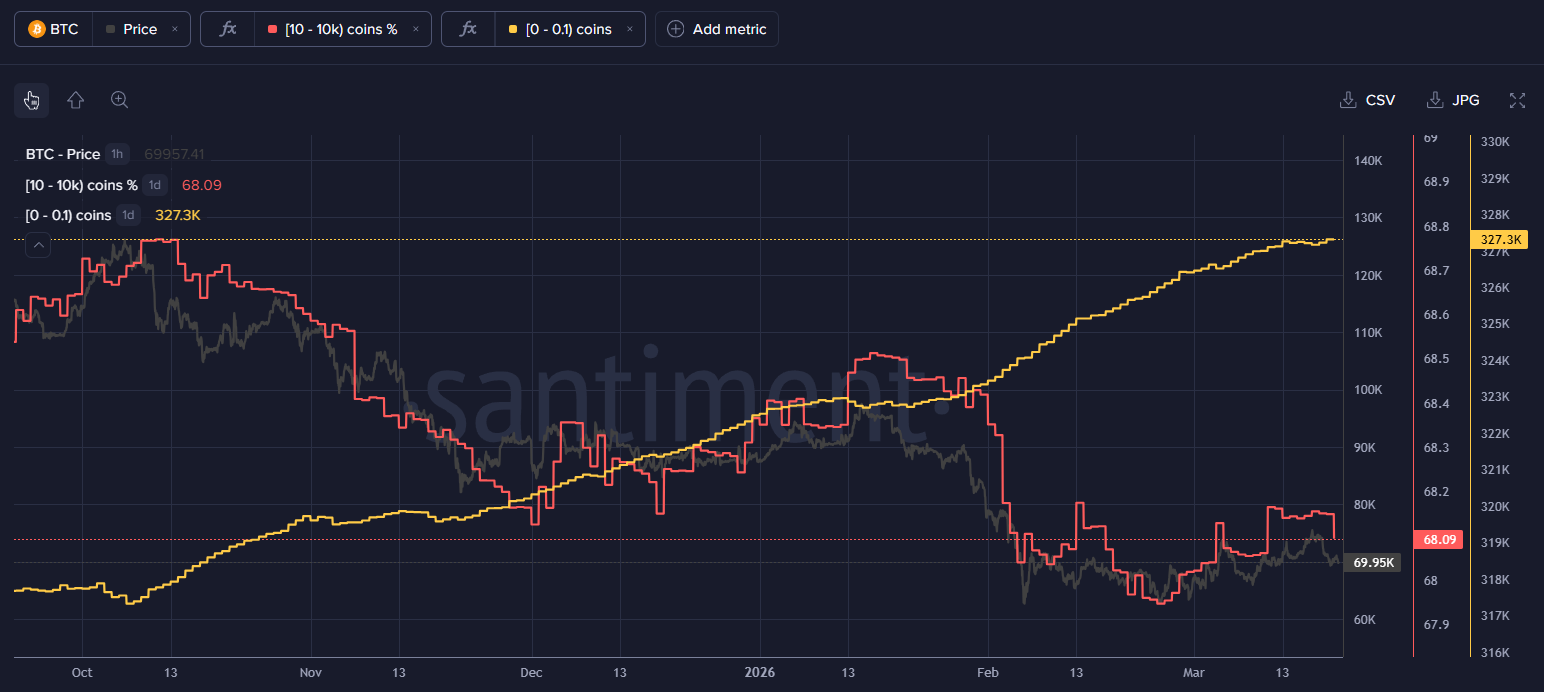
A concerning trend is the aggressive accumulation by small retail wallets (0.01 BTC or less). This cohort has been buying non-stop for nine months. Typically, sustainable bull runs occur when retail is fearful and selling, while whales accumulate. Currently, whales (10-10k BTC) are holding flat, neither buying nor dumping. The lack of whale participation combined with retail enthusiasm suggests caution is warranted.
- Key Data: Retail wallets (0-0.01 BTC) accumulating for 9 straight months (chart).
- Actionable Tip: Caution is advised when retail is the primary buyer; wait for the 10-10k BTC wallet cohort to resume an uptrend.
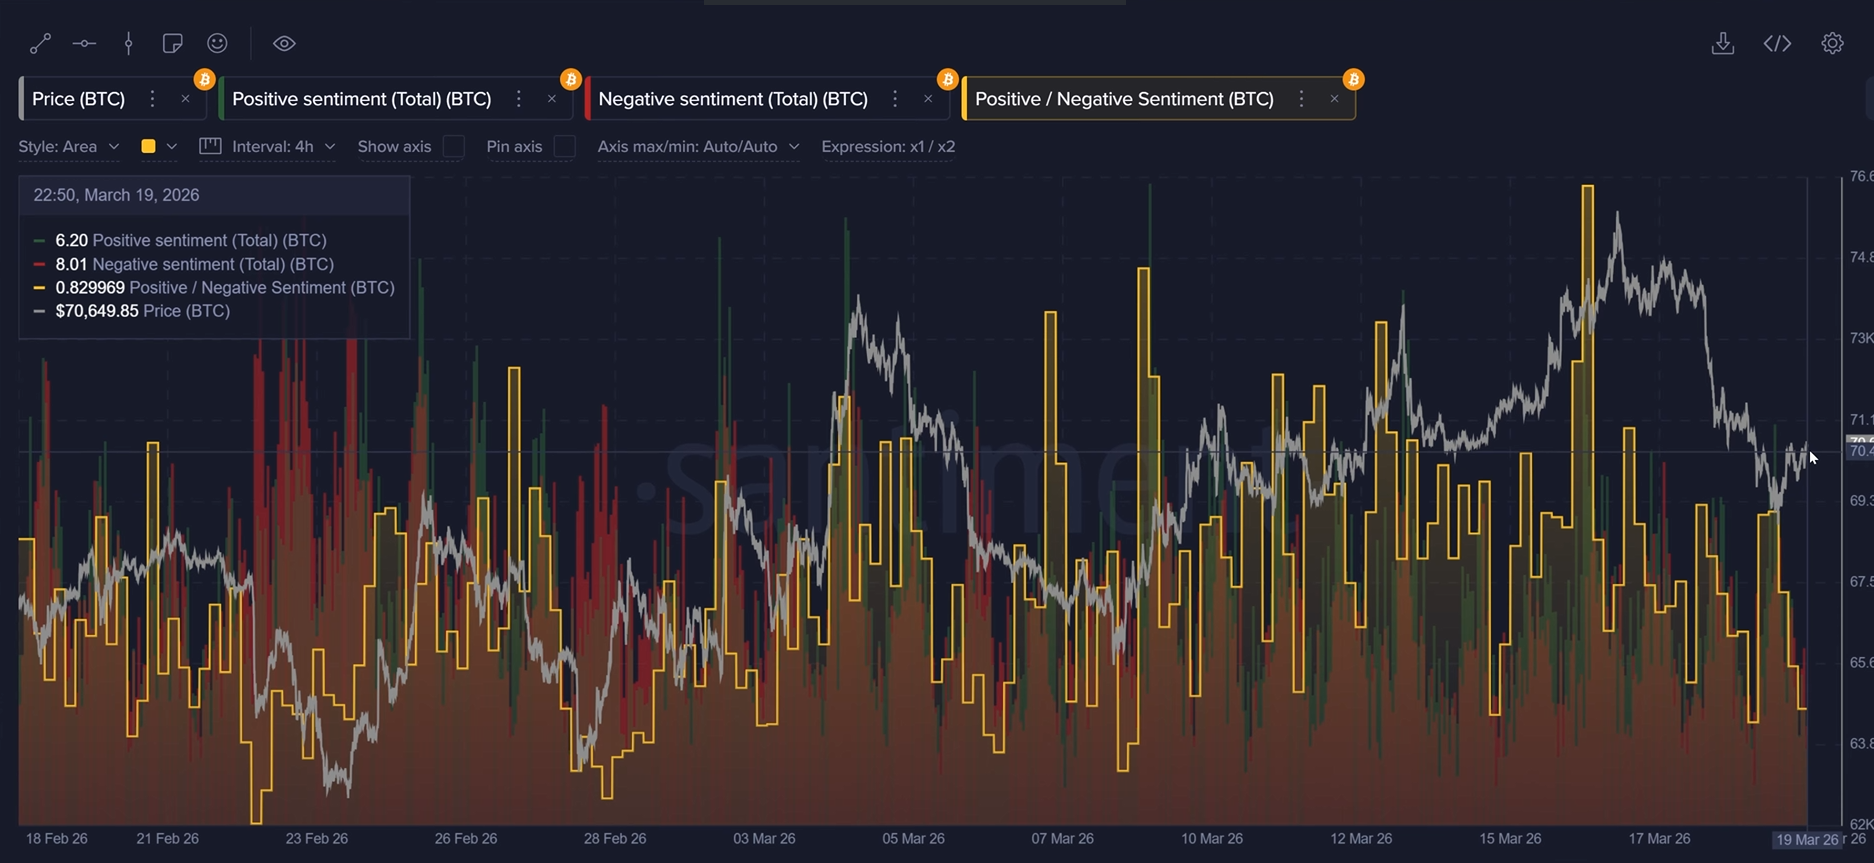
21:18 - Sentiment Check: Are Traders Expecting a Dead Cat Bounce?
Short-term sentiment analysis on 4-hour bars shows a leaning towards bearishness. Traders largely believe the current price action is a "dead cat bounce" and expect further downside, driven by fears of a stock market collapse. Historically, when the crowd overwhelmingly expects a drop, the market has a tendency to move in the opposite direction to liquidate those expectations.
- Key Data: Crowd sentiment leaning bearish/expecting lower prices (chart).
- Actionable Tip: Use extreme bearish sentiment as a potential contrarian long signal.
22:50 - On-Chain Health: Transaction Volume & Network Growth
The underlying utility of the Bitcoin network is currently in a downtrend. Transaction volume and daily active addresses have declined over the last few months. This is typical during a mid-cycle correction or bear phase. For a high-conviction reversal, we would ideally see a spike in network activity to confirm that utility is returning to the chain.
- Key Data: Transaction volume and Active Addresses trending down since October highs (chart).
- Actionable Tip: Watch for a divergence where price stays flat but active addresses start climbing.
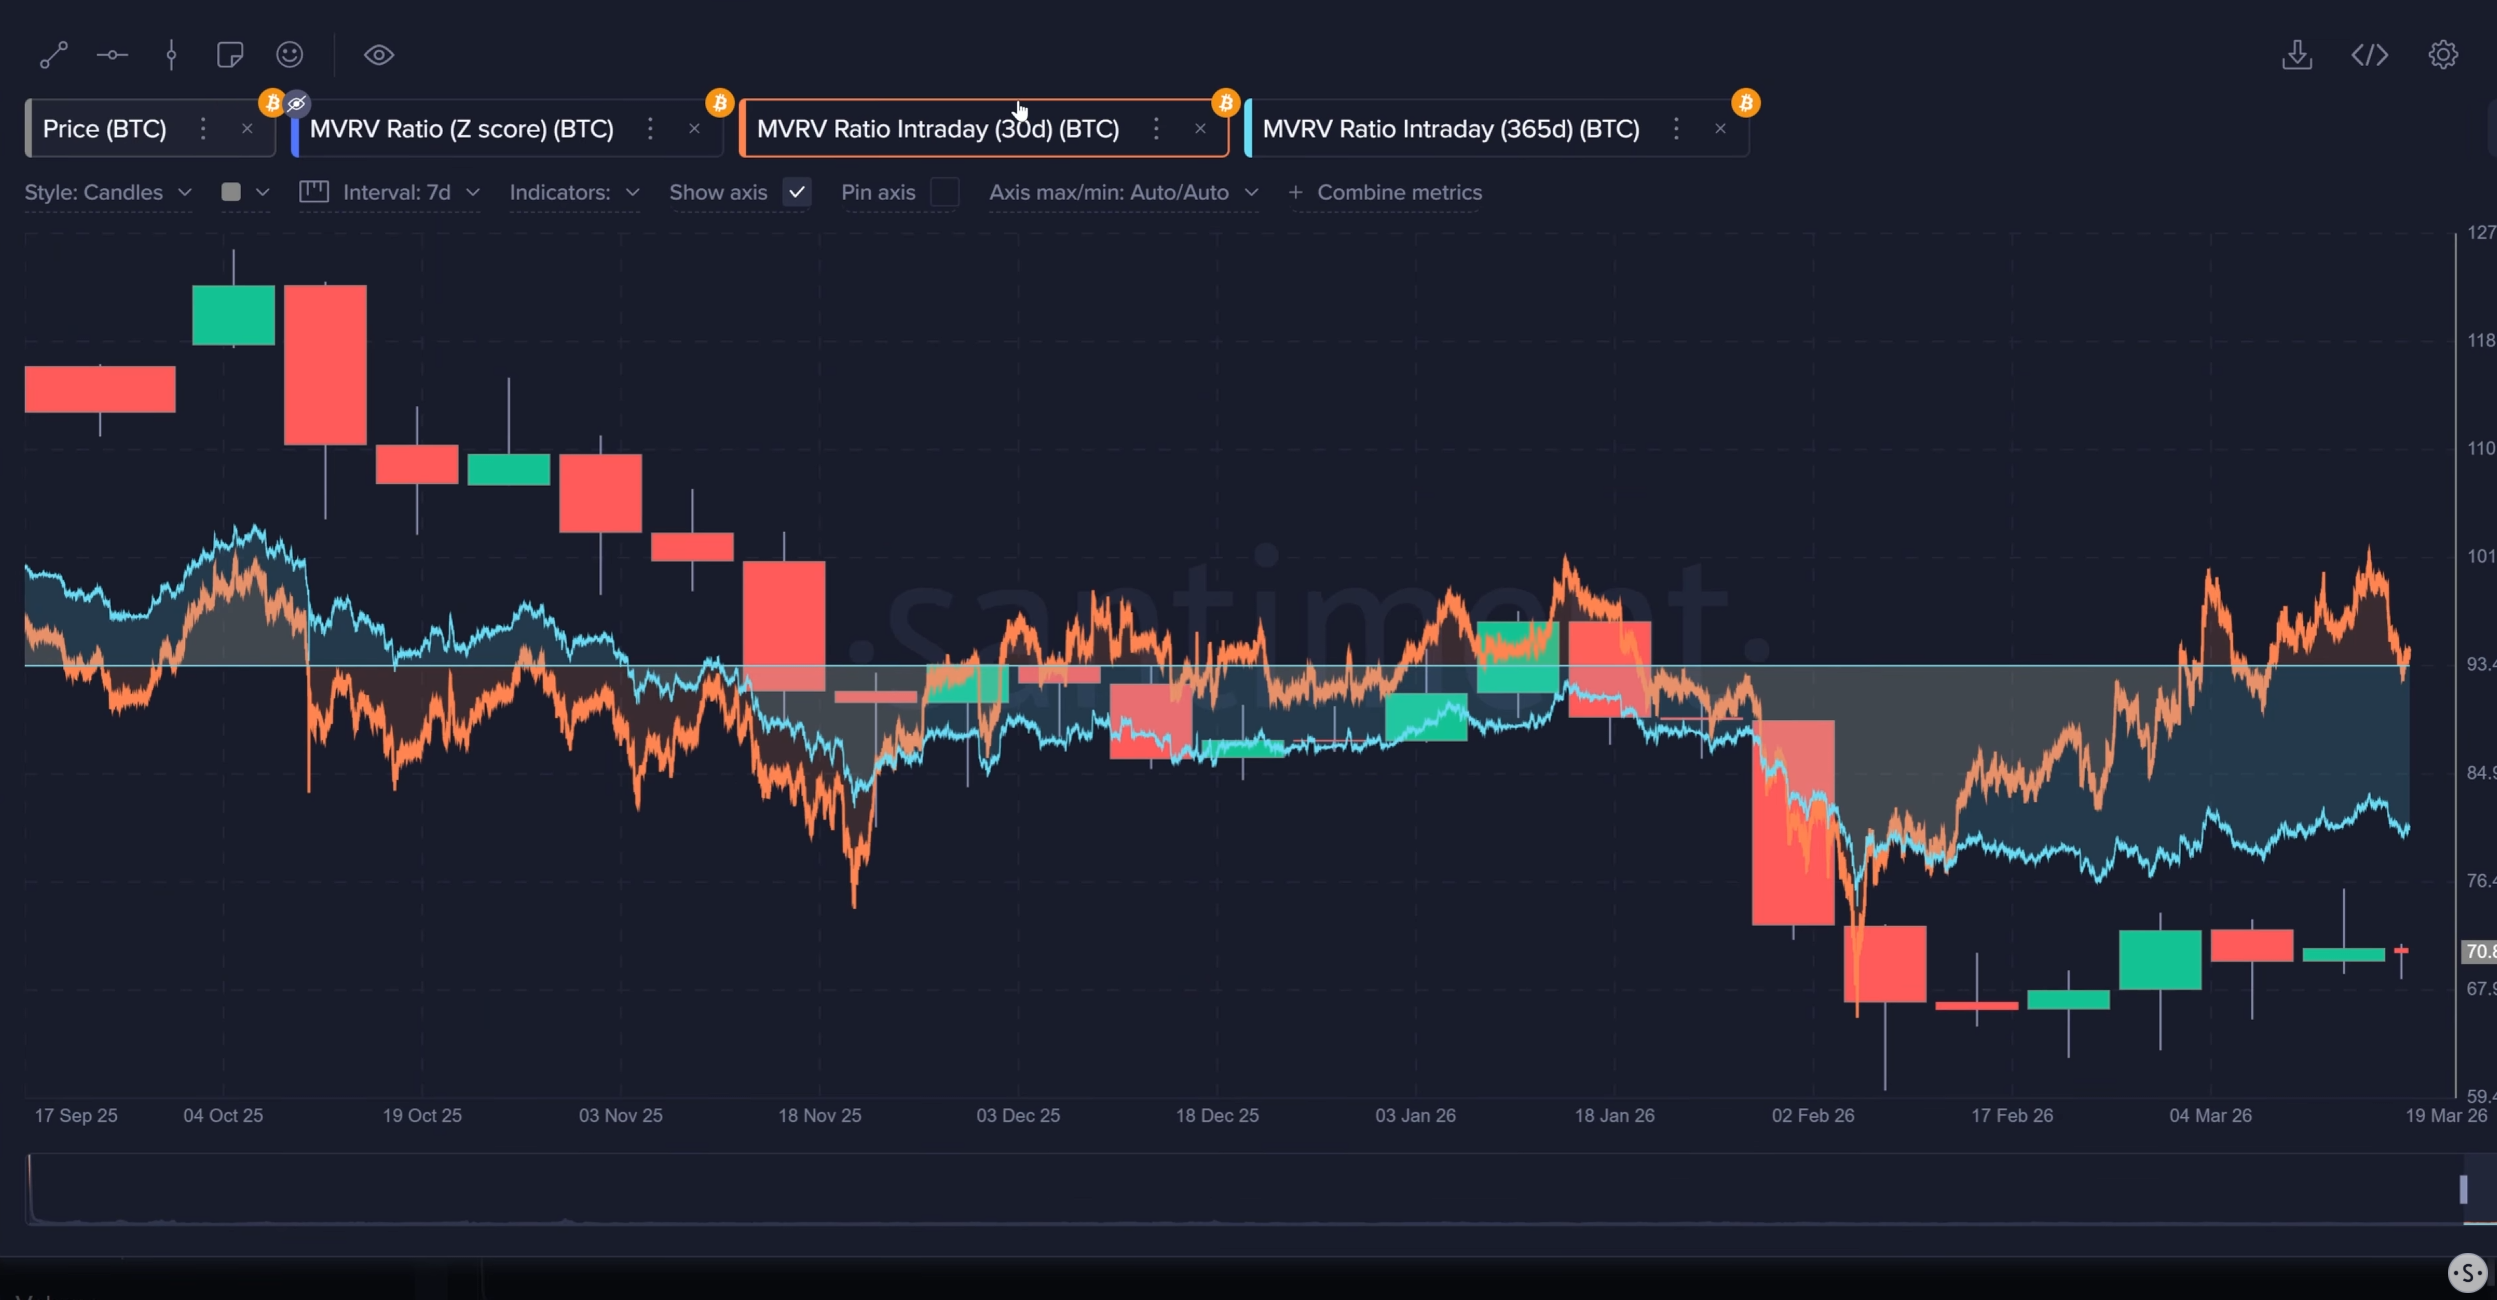
23:57 - MVRV Analysis: Is Bitcoin Undervalued?
The 30-day MVRV (Market Value to Realized Value) is hovering around neutral (0%), meaning short-term traders are breaking even. However, the 365-day MVRV is sitting deep in negative territory at -26%. This places Bitcoin in a historically low-risk zone for long-term investors. Buying when the average holder is underwater has historically yielded positive returns over a 6-12 month horizon.
- Key Data: 365-day MVRV at -26%.
- Actionable Tip: Long-term accumulation is statistically safer when long-term MVRV is below -15%.
26:49 - Funding Rates & Shorting Behavior
Funding rates have shown a persistence of shorting activity. As long as traders are betting against the market, the likelihood of a massive cascade to the downside is reduced due to the potential for short squeezes. Recent data showed significant shorting interest, which often acts as "rocket fuel" for price bounces when those positions are forced to close.
- Key Data: Funding rates showing negative/short bias (chart).
- Actionable Tip: High short interest often precedes price bounces; monitor for liquidation spikes.
28:43 - Social Dominance Spikes & Altcoin Trends
Bitcoin's social dominance hit a four-month high recently. When the crowd focuses exclusively on Bitcoin, it usually indicates fear and a flight to safety, draining liquidity from altcoins. However, specific altcoins like Zcash, BitTensor, and Memecore have shown resilience. High social dominance for BTC is often a sign of a market bottoming process as speculators talk less and less about the rest of the crypto market.
- Key Data: Bitcoin Social Dominance at highest level since Dec 4th (chart).
- Actionable Tip: Peak Bitcoin social dominance often marks a good time to start researching high-quality altcoins for the next rotation.
33:29 - Regulatory News & "Security" Status Updates
Discussions around the "Clarity Act" and SEC comments on token definitions are trending. The narrative suggests a potential pivot toward a more favorable regulatory environment in the US, with safe harbor proposals being discussed. While regulatory news is often "sell the news," a structural change in how tokens are classified could bring institutional capital back off the sidelines.
- Key Data: "Security" and "SEC" trending in social data.
- Actionable Tip: Regulatory clarity is a long-term bullish fundamental; ignore short-term price chops around these headlines.

35:18 - Top Trending Coins: $QNT, $LINK, & $XLM
The top trending assets include Quant (due to Robinhood listing), Chainlink (community disputes), and Stellar (tokenized fund launch). Monitoring the top trending tokens list is crucial because assets that reach the #1 spot on social trends often face a short-term correction shortly after as the hype boils over.
- Key Data: $QNT #1 trending token on March 19th.
- Actionable Tip: Be cautious entering positions on coins that are currently #1 on the trending list due to hype.
Conclusion
The data presents a mixed but cautiously optimistic picture. While retail buying and low network activity are concerns, the resilience of Bitcoin against gold and stocks, combined with deep negative MVRV ratios and whale accumulation, suggests the market is in a re-accumulation phase. The "Clarity Act" and geopolitical resolutions remain the wild cards. Patience and data-driven decisions are key in this chop.
Spotting, analyzing, and understanding the markets is easier with the right tools and a strong like-minded community. Sign up for app.santiment.net and join our discord for access to real time metrics and analysis.
For more data-driven crypto analysis, subscribe to our YouTube channel, our Substack, or follow us on Santiment Insights.
Disclaimer: The opinions expressed in the post are for general informational purposes only and are not intended to provide specific advice or recommendations for any individual or on any specific security or investment product.