This Week in Crypto, Full Written Summary: W3 February 2026

Executive Summary
- Tariff Relief Sparks Hope: A massive 6-3 vote to roll back the Trump administration's tariffs removes a heavy macroeconomic anchor that has suppressed crypto markets since April 2025.
- Dangerous Divergence in Accumulation: While retail traders aggressively buy every minor dip, large institutional wallets holding 10 to 10k BTC have dumped nearly 0.5% of the total supply in just five weeks.
- MVRV Signals Limited Downside: Both 30-day and 365-day Market Value to Realized Value (MVRV) ratios are deep in negative territory, suggesting that average traders are well underwater and the risk of further massive drops is mathematically reduced.
Are the Crypto Markets Finally Waking Up After the Trump Tariff Reversal?
The crypto markets have endured a slow, painful bleed over the past five months, with BTC steadily dropping from the October 2025 all-time high of $126,000. Unlike a sudden, panic-inducing crash, this gradual decline has left traders frustrated and impatient. However, recent macroeconomic shifts are shaking up the circumstances. The Santiment team reviewed the latest on-chain metrics, social sentiment, and the massive news regarding the reversal of U.S. tariffs to determine if a market bottom is finally forming.

00:00 - Five Consecutive Red Months for Crypto
Since early October, the cryptocurrency market has experienced five straight months of negative returns. Rather than a massive capitulation event, Bitcoin has lost roughly $10,000 to $15,000 in market value each month. This slow bleed creates a frustrating environment for investors. Without a sudden drop to trigger widespread panic selling, the market is stuck in a prolonged state of gradual pain.
- Key Data: Bitcoin has seen five consecutive negative months since its $126k peak on October 5, 2025.
- Actionable Tip: Do not expect a sudden V-shaped recovery without a preceding capitulation event; patience is required during slow-bleed markets.
01:55 - How Bitcoin Correlates with S&P 500 and Gold
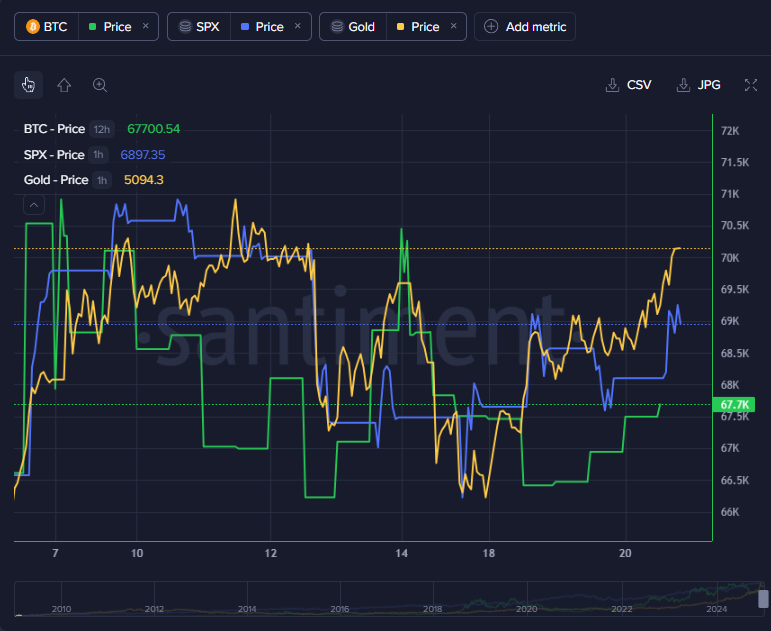
Bitcoin is currently showing promising one-day changes, moving upward alongside stocks and gold. Over the past year, Bitcoin and the S&P 500 have maintained a strong correlation, despite a few brief periods of separation. Currently, these assets are moving in unison once again. This tight correlation suggests that large capital flows are treating Bitcoin similarly to traditional risk assets.
- Key Data: In a recent three-day window, Bitcoin gained 0.6%, the S&P 500 gained 0.9%, and Gold surged 4% (chart).
- Actionable Tip: Watch traditional stock indices closely; a slump in the S&P 500 will likely drag Bitcoin down with it.
04:45 - Retail Buying vs Institutional Selling Trends
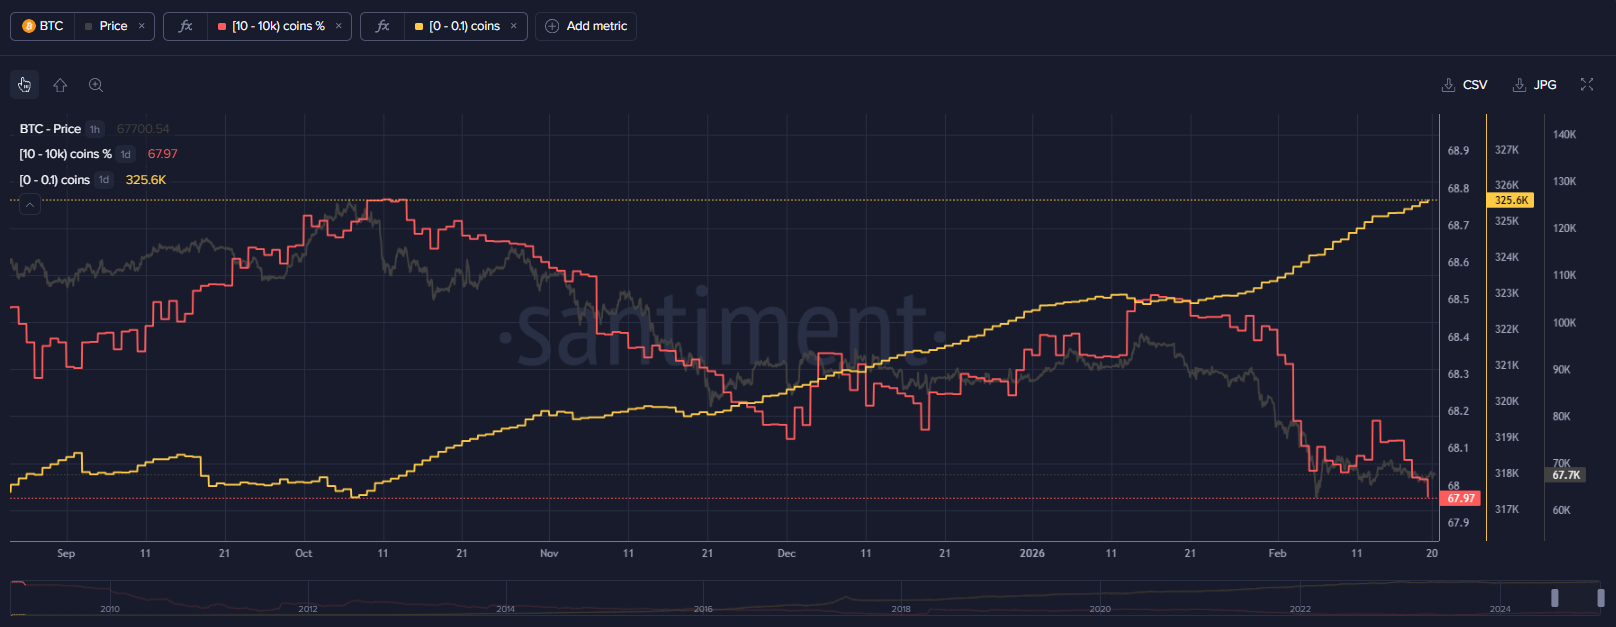
A concerning divergence is playing out on-chain. Retail traders holding less than 0.01 BTC are aggressively buying every minor dip, convinced that prices are too low. Conversely, institutional wallets holding between 10 and 10,000 BTC are moving in the opposite direction. These key stakeholders have offloaded a massive amount of supply over the last five weeks. Historically, sustainable bull runs require smart money accumulation, not retail dip-buying.
- Key Data: Wallets holding 10 to 10k BTC dropped nearly 0.5% of the total Bitcoin supply in just five weeks (chart).
- Actionable Tip: Wait for large whale tier wallets to begin accumulating before assuming a long-term trend reversal is underway.
06:49 - Identifying Opportunity Zones with MVRV Ratios
Short-term metrics offer a glimmer of hope. The 30-day MVRV ratios for top assets like Bitcoin, Ethereum, and Cardano are all below zero. This metric calculates the average trading returns of recent buyers. When MVRV is negative, the average trader is underwater, historically creating an opportunity zone with reduced downside risk. The further below zero an asset sits, the higher the probability of a relief rally.
- Key Data: 30-day MVRV stands at -6% for Bitcoin and -15% for Ethereum(chart).
- Actionable Tip: Use negative MVRV zones to scale into positions, as the risk-to-reward ratio is mathematically in your favor.
08:48 - Fading FOMO and Shrinking Price Predictions
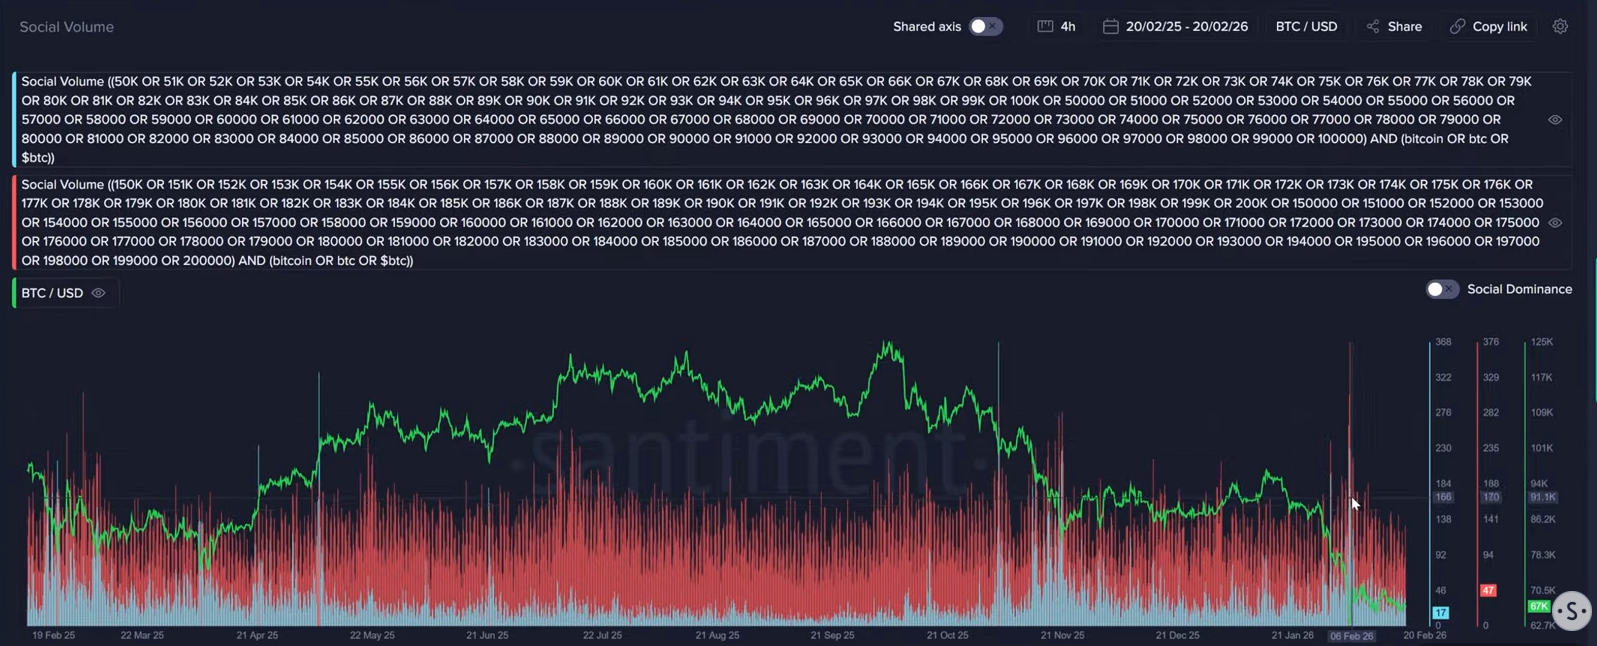
Social sentiment tools show a drop in extreme bullish price predictions. Calls for Bitcoin to hit $150k to $200k, and even $50k to $100k, are drying up. This reduction in FOMO and "Lambo" memes is actually a healthy market indicator. It shows that retail optimism is fading. Markets rarely reward the majority, so a decrease in widespread euphoria is necessary to clear out short-term speculators.
- Key Data: Social volume for Bitcoin price predictions above $100k has sharply declined.
- Actionable Tip: View declining euphoria as a positive step toward finding a true market bottom.
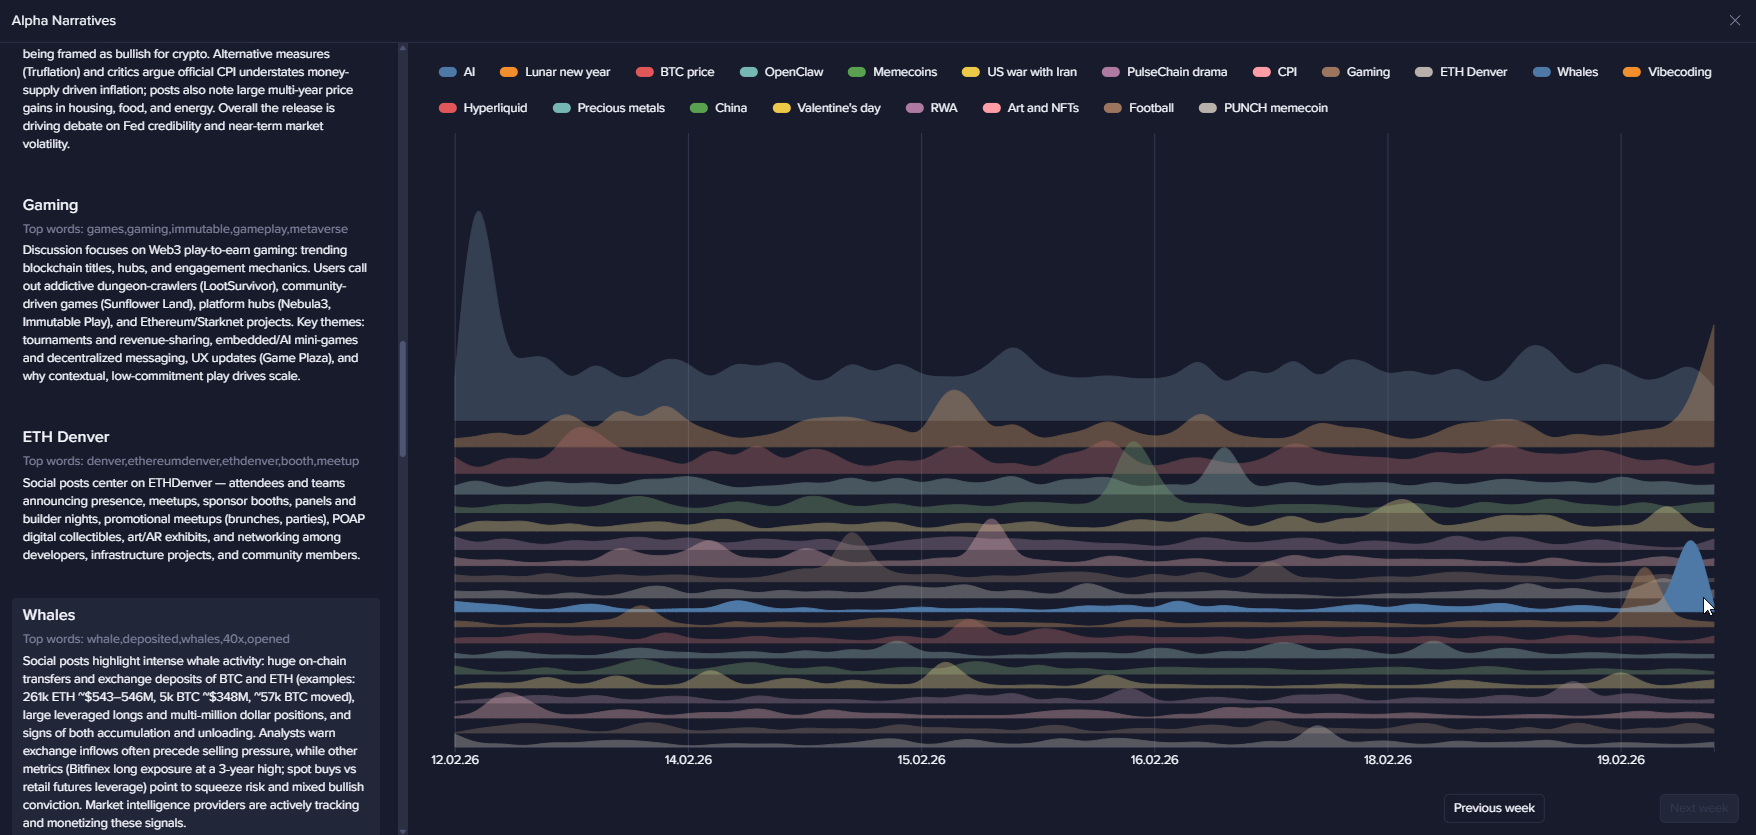
11:20 - Monitoring Whale Activity and AI Agent Narratives
Santiment's Alpha Narratives tool highlights the most impactful social trends. Currently, discussions around whale activity are surging as traders look for large on-chain transfers to signal market direction. Additionally, niche topics like "vibe coding" and AI-driven multi-agent apps are dominating crypto conversations. Tracking these isolated social spikes helps explain sudden capital rotations into specific altcoin sectors.
- Key Data: "Whales" and "AI" are consistently ranking among the top trending topics in crypto media.
- Actionable Tip: Monitor emerging narratives to spot capital rotations before they fully reflect in the price.
14:59 - Shifts in Crowd Sentiment Across Major Altcoins
Objective sentiment analysis reveals a shift in trader psychology. Bitcoin's sentiment has recovered from extreme bearishness back to neutral territory. Interestingly, Ethereum is seeing higher positive sentiment than Bitcoin, likely because traders view its suppressed price as a value play. Meanwhile, Binance Coin (BNB) remains low following the fallout from massive liquidations earlier in the year.
- Key Data: BTC, ETH, and BNB Sentiment recovers a bit (chart).
- Actionable Tip: When an asset's sentiment recovers back to a neutral position it means the market is not in an extreme state, from a psychological standpoint. Better to avoid trading in these scenarios or at least discount the significance of sentiment metrics in your analysis.
17:49 - Warning Signs from Declining Network Utility
The underlying health of the Bitcoin network is flashing warning signs. Transaction volume, active addresses, and network growth are all steadily declining. These utility indicators suggest the network is being used less frequently. While not immediately bearish, this dormancy implies traders are sitting on their hands. A true market expansion should be supported by growing user participation, which is currently lacking.
- Key Data: Daily active addresses and new wallet creation are both in a continuous downtrend(chart).
- Actionable Tip: Do not aggressively long the market until you see a sustained uptick in active addresses and network growth.
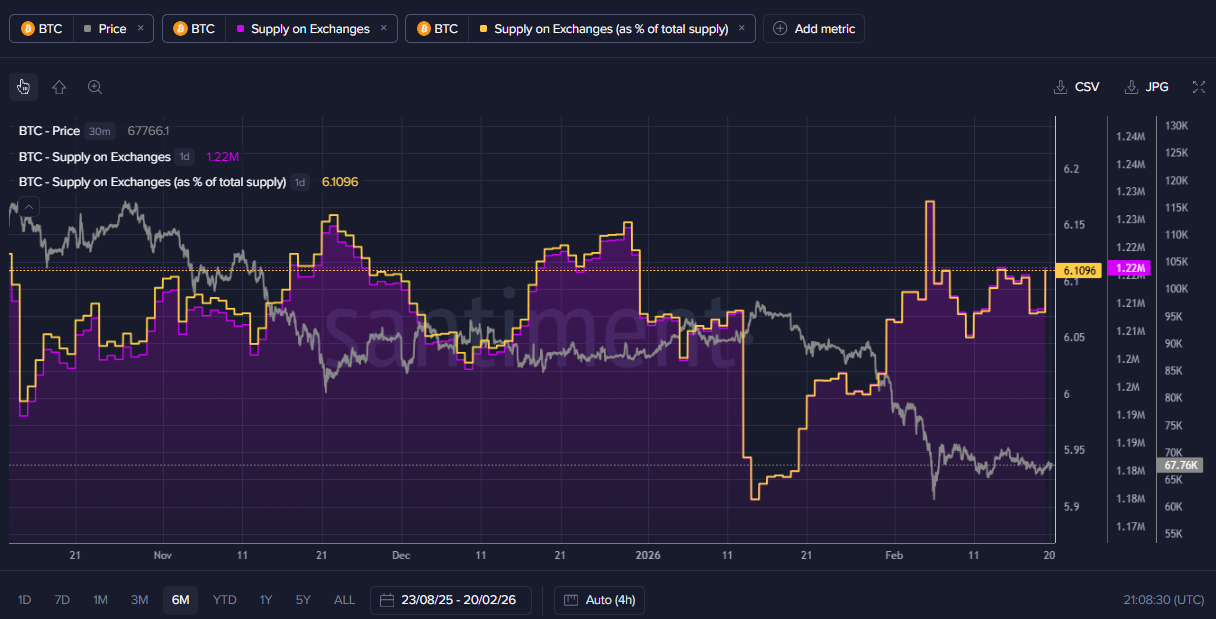
20:17 - Tracking Exchange Inflows and Sell-off Risks
While some metrics show mild improvement, sudden movements of funds demand attention. The network recently recorded a massive spike in exchange inflows. Large amounts of Bitcoin were moved to centralized exchanges in a very short window. Typically, when whales transfer dormant coins to exchanges, it precedes a sell-off as they prepare to liquidate positions.
- Key Data: Nearly 5,000 BTC moved to exchanges in a series of 15-minute intervals(chart).
- Actionable Tip: Set alerts for major exchange inflows to protect your portfolio from sudden whale dumping.
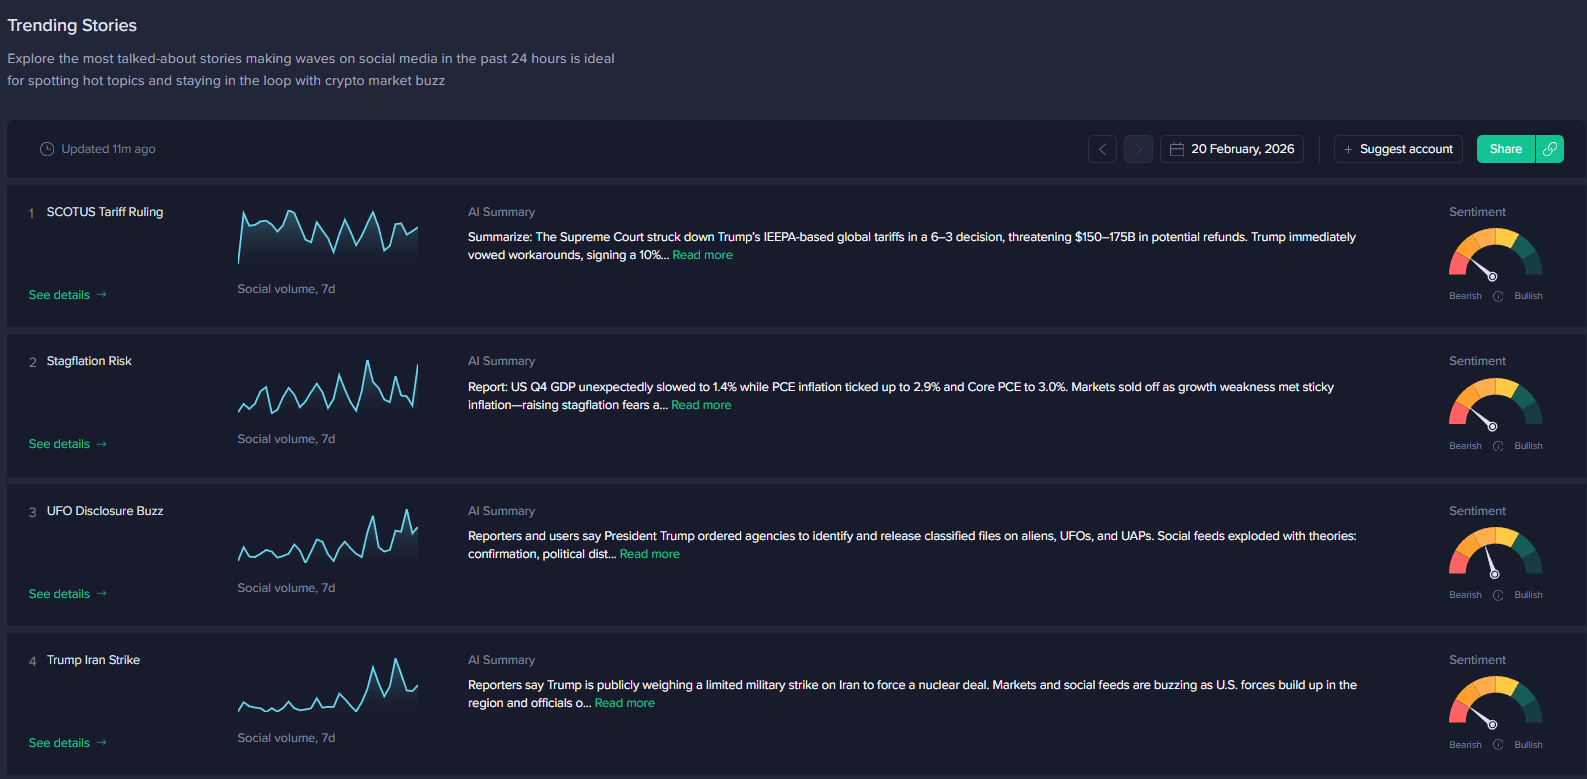
21:57 - Impact of Trump Tariff Reversals on Crypto Markets
A massive political development just hit the tape: by a vote of 6-3, the controversial Trump tariffs are being dialed back. Since their implementation in April 2025, these tariffs have acted as a macroeconomic anchor on global markets, including crypto. While the short-term price reaction has been muted, the removal of these trade barriers is objectively fantastic long-term news for risk assets.
- Key Data: Social dominance for "Tariffs" and "Trump" spiked heavily following the 6-3 rollback vote(my narratives tool).
- Actionable Tip: Factor macroeconomic policy changes into your long-term thesis, as they dictate the broader liquidity environment.
24:12 - Analyzing Recent Bitcoin and Ethereum ETF Outflows
Institutional demand via ETFs remains sluggish. Both Bitcoin and Ethereum are experiencing net outflows over the past week. ETF volume has fallen back to its lowest point of 2026. Interestingly, the Santiment team views ETF outflows as a potential contrarian indicator. Because retail traders heavily utilize these products, consistent outflows often signal crowd fear, which usually happens near market bottoms.
- Key Data: Bitcoin and Ethereum ETF volumes are sitting at their lowest levels of 2026(data).
- Actionable Tip: Treat continuous retail ETF outflows as a sign of market exhaustion and a potential precursor to a trend reversal.
Conclusion
The crypto market is caught in a tug-of-war between weak network fundamentals and improving macroeconomic conditions. While the rollback of the Trump tariffs provides a massive long-term tailwind, the short-term reality is that network utility is dropping and whales are still net selling. However, with MVRV ratios firmly in negative territory, the downside risk seems limited.
Spotting, analyzing, and understanding the markets is easier with the right tools and a strong like-minded community. Sign up for app.santiment.net and join our discord for more frequent and timely analysis of the crypto markets.
For more data-driven crypto analysis, subscribe to our YouTube channel, our Substack, or follow us on Santiment Insights.