This Week in Crypto, Full Written Summary: W3 April 2026

Is the Bottom In? Why Bitcoin's Rally to $77K Has Traders Skeptical
Executive Summary
- The crowd doesn't trust this rally, which is exactly why it might continue. Sentiment shows three bearish comments for every two bullish, a contrarian setup that historically favors bulls.
- Whales are accumulating. Retail is chasing. Networks are quiet. Key stakeholder wallets logged their biggest accumulation spike in weeks, but active addresses remain at multi-year lows.
- MVRV flashes a split signal. The 365-day sits at roughly -18% (lower-risk zone for holders), while the 30-day at +8.6% approaches levels that have marked recent local tops.
Introduction
Bitcoin has recovered to its highest level since early February. Ethereum is outperforming on the way back toward $2,500. Weekly volume has nearly doubled. This looks like it could be a trend change.
The Santiment team pressure-tested that narrative against on-chain data, funding rates, wallet tiers, and the Alpha Narratives feed. The picture that emerged is more layered than the price chart suggests — full of contrarian signals worth noting, and structural weaknesses worth watching.
00:00 - Bitcoin Reclaims $77K: Is the Bear Market Over?
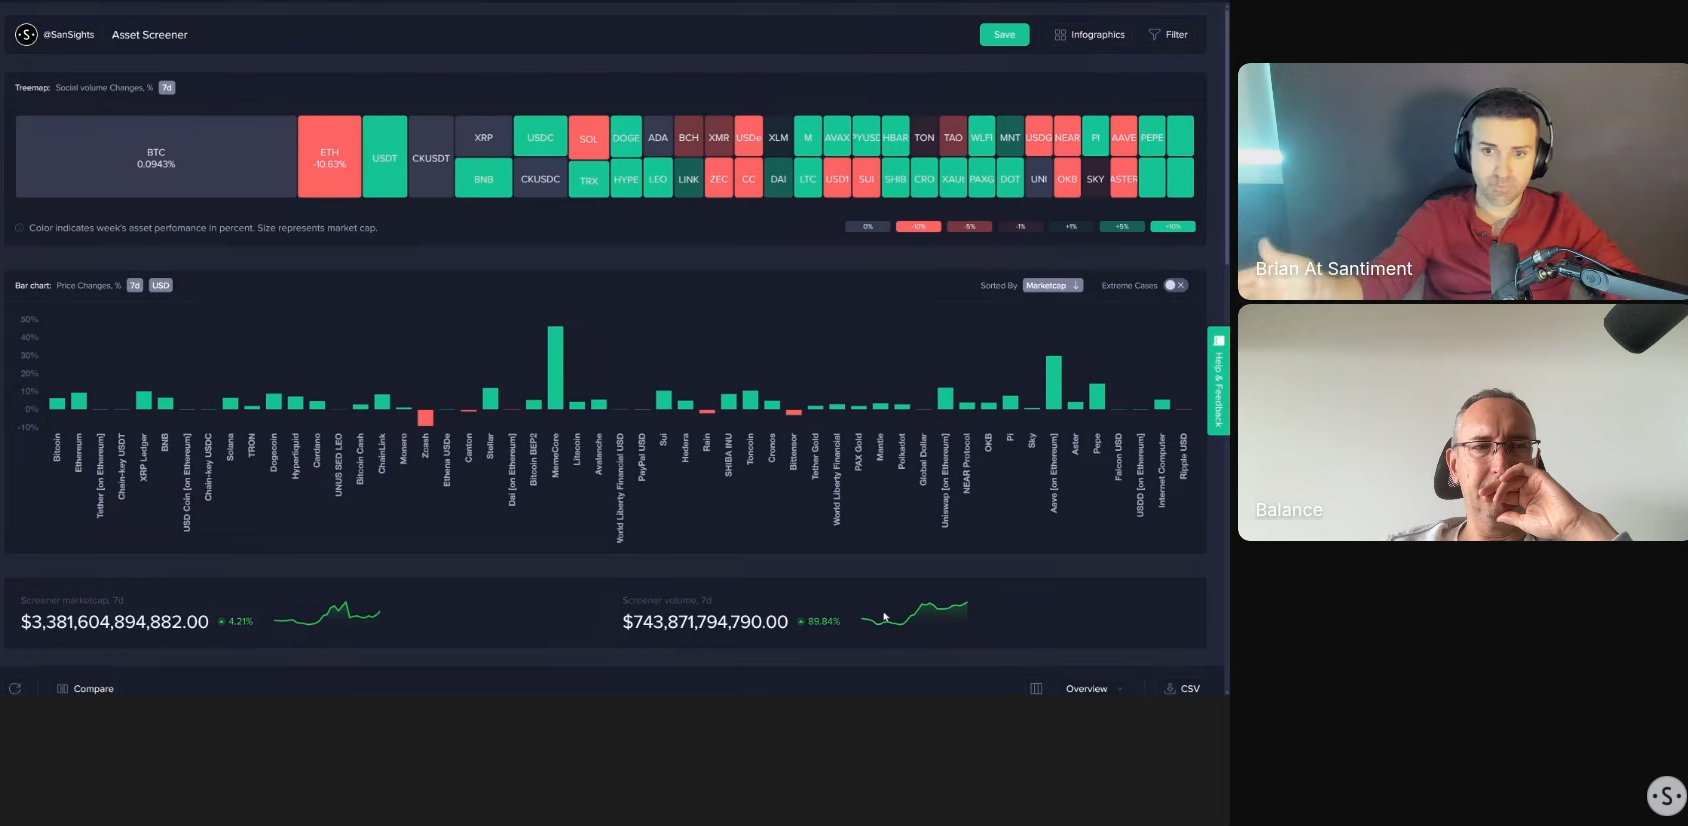
Bitcoin is at a two-and-a-half-month high. Ethereum is outperforming. Weekly volume is up roughly 2x. Total market cap is up about 4.2%. The Santiment team flagged the rally's strength but cautioned that labeling it a trend shift may be premature.
- Key Data: Weekly volume at $743.9B, up from ~$380B the prior week. Total market cap +4.2% (screener).
- Actionable Tip: Volume expansion alone rarely confirms a trend change. Past cycles suggest pairing it with improving fundamentals is wise before adjusting a thesis.
01:30 - Trump Is a Market Indicator (Here's How to Read Him)
Trump administration statements, particularly around the Israel-Lebanon ceasefire and the Strait of Hormuz, are acting as near real-time bullish or bearish triggers. The Santiment team described a reflexive loop: even traders who distrust the headlines are positioning based on how everyone else will react to them.
- Key Data: Rally aligns with the 10-day Israel-Lebanon ceasefire and Iran reopening the Strait of Hormuz (trending stories tool).
- Actionable Tip: News-driven moves tend to be fragile without on-chain confirmation. Traders often treat them as reactive rather than structural.
04:38 - The Bullish Signal Hiding in Bearish Sentiment
Crowd sentiment remains negative despite the price surge. The daily ratio shows roughly three bearish comments for every two bullish. The Santiment team framed this disbelief as the single strongest contrarian signal on the board right now, because markets tend to reward positioning against crowd consensus.
- Key Data: Bearish-to-bullish ratio roughly 3:2 on the daily timescale (chart).
- Actionable Tip: Keep an eye on sentiment crossing into extreme levels in either direction. The current condition is moderate.
07:10 - Volume Doubles to $744B: What It Actually Means
Weekly volume expanded from roughly $380B to $744B. The Santiment team read this as sidelined participants returning to active positioning. The "wait and see" phase may be ending. The question is whether this activity translates into sustained flow or exhausts itself within a week.
- Key Data: Weekly volume $743.9B vs. ~$380B the prior week, but BTC volume seems not to have changed much(screener).
- Actionable Tip: Volume expansion on green candles is generally viewed as a stronger confirmation signal than price action in isolation. Take some time to investigate which assets are experiencing that additional volume.
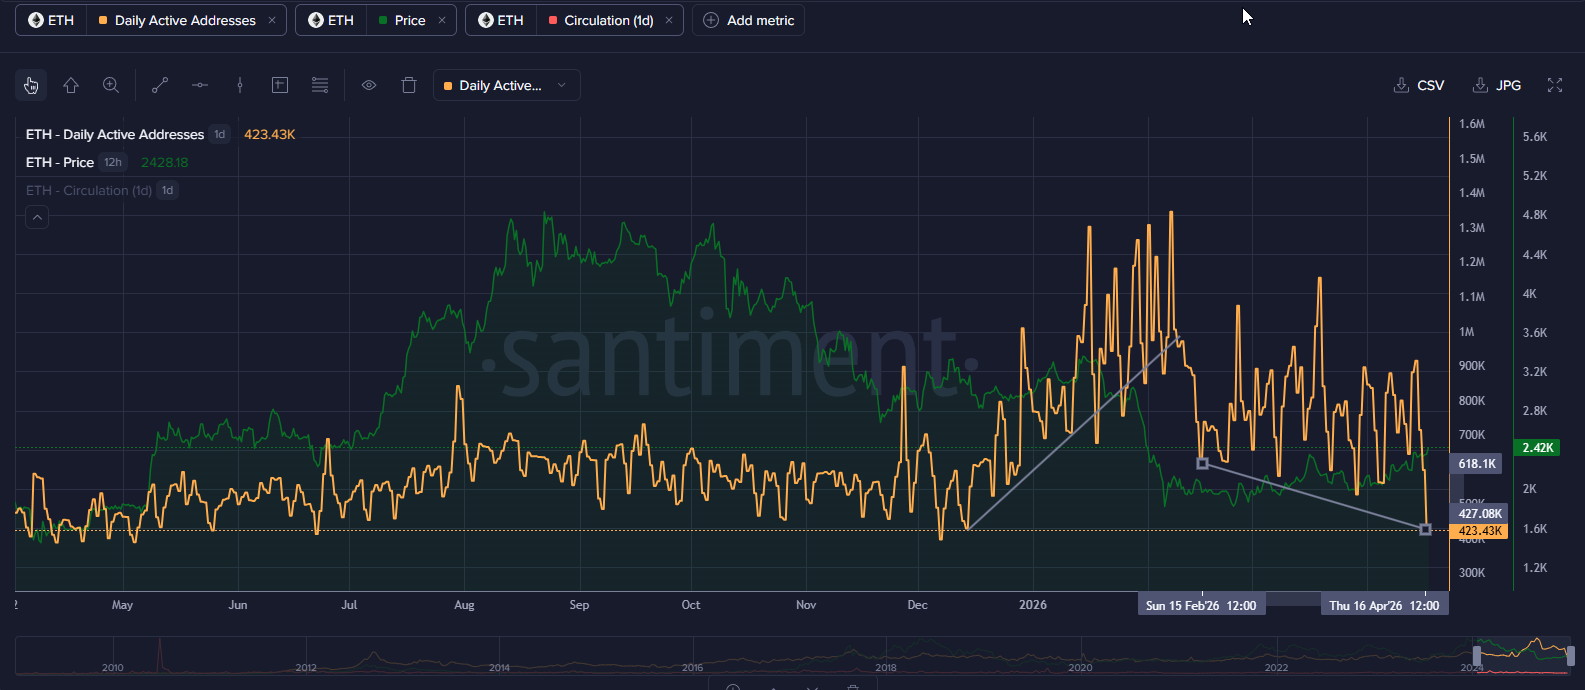
08:27 - The One Metric That Could Kill This Rally
Active addresses and network growth have not followed price higher. Ethereum's 30-day active address average has dropped near 600,000 per day — a multi-year low. The Santiment team identified this as the rally's defining weakness. Capital has rotated into equities, gold, silver, and oil. Until that flow reverses, price gains will rest on narrative rather than utility.
- Key Data: Ethereum 30-day active addresses near 600,000 per day(chart).
- Actionable Tip: Sustainable uptrends have historically required active addresses and network growth to trend higher in tandem with price.
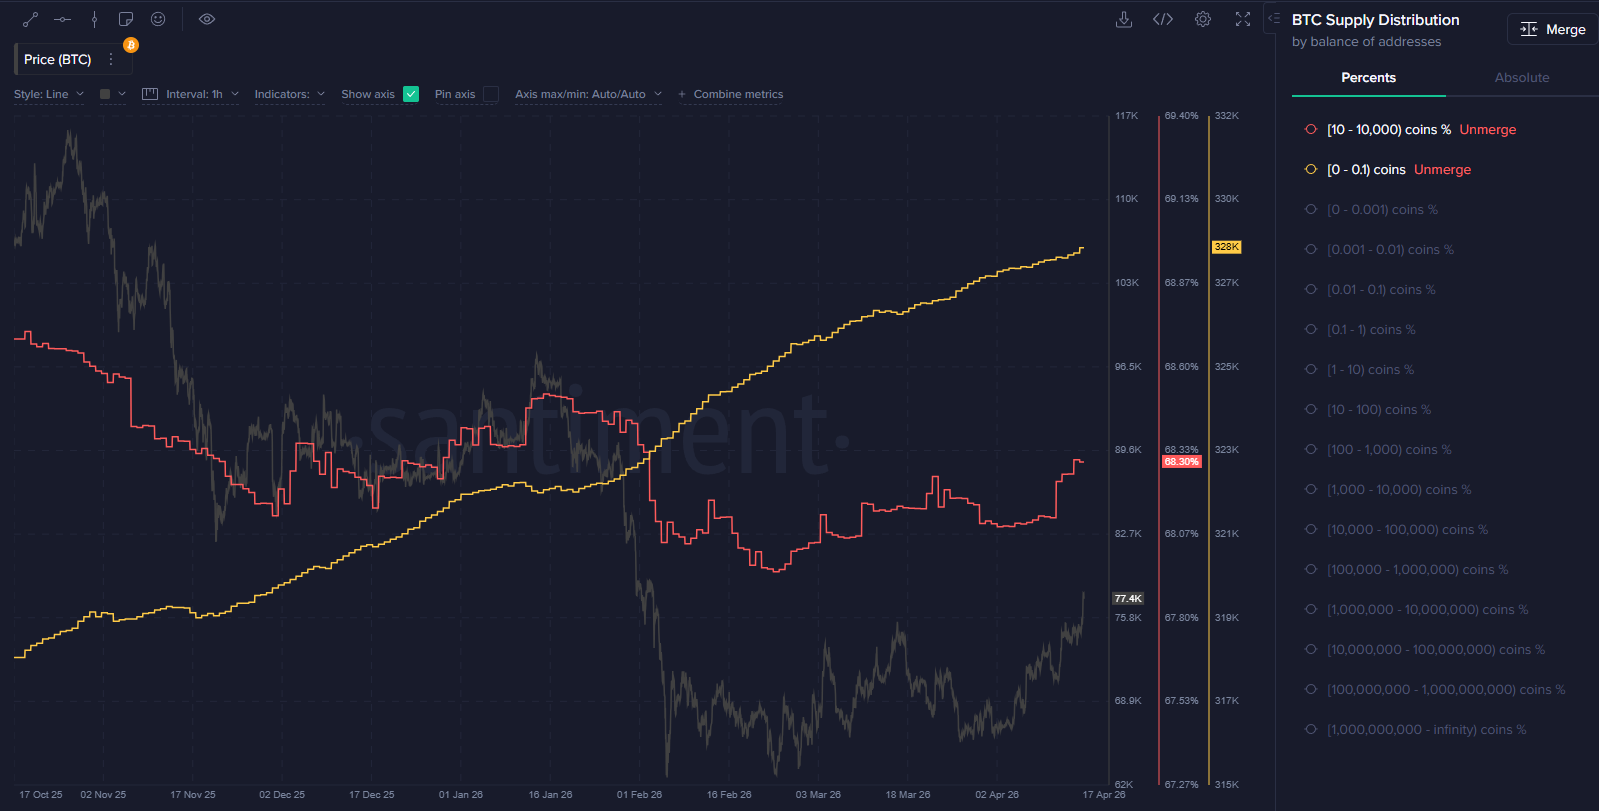
12:52 - 365d MVRV at -18%: A Lower-Risk Window for Holders
The 365-day MVRV sits at roughly -18%, meaning long-term holders are still underwater on average. That's historically marked a lower-risk accumulation zone. The 30-day MVRV at +8.6% tells a different story — it's approaching the level where local tops formed repeatedly over the past year. The Santiment team pointed to early February and late March as the last windows when both metrics were negative simultaneously.
- Key Data: 365-day MVRV ≈ -18%. 30-day MVRV ≈ +8.6% (chart).
- Actionable Tip: The highest-confidence accumulation windows in recent cycles have occurred when both short- and long-term MVRV sit in negative territory.
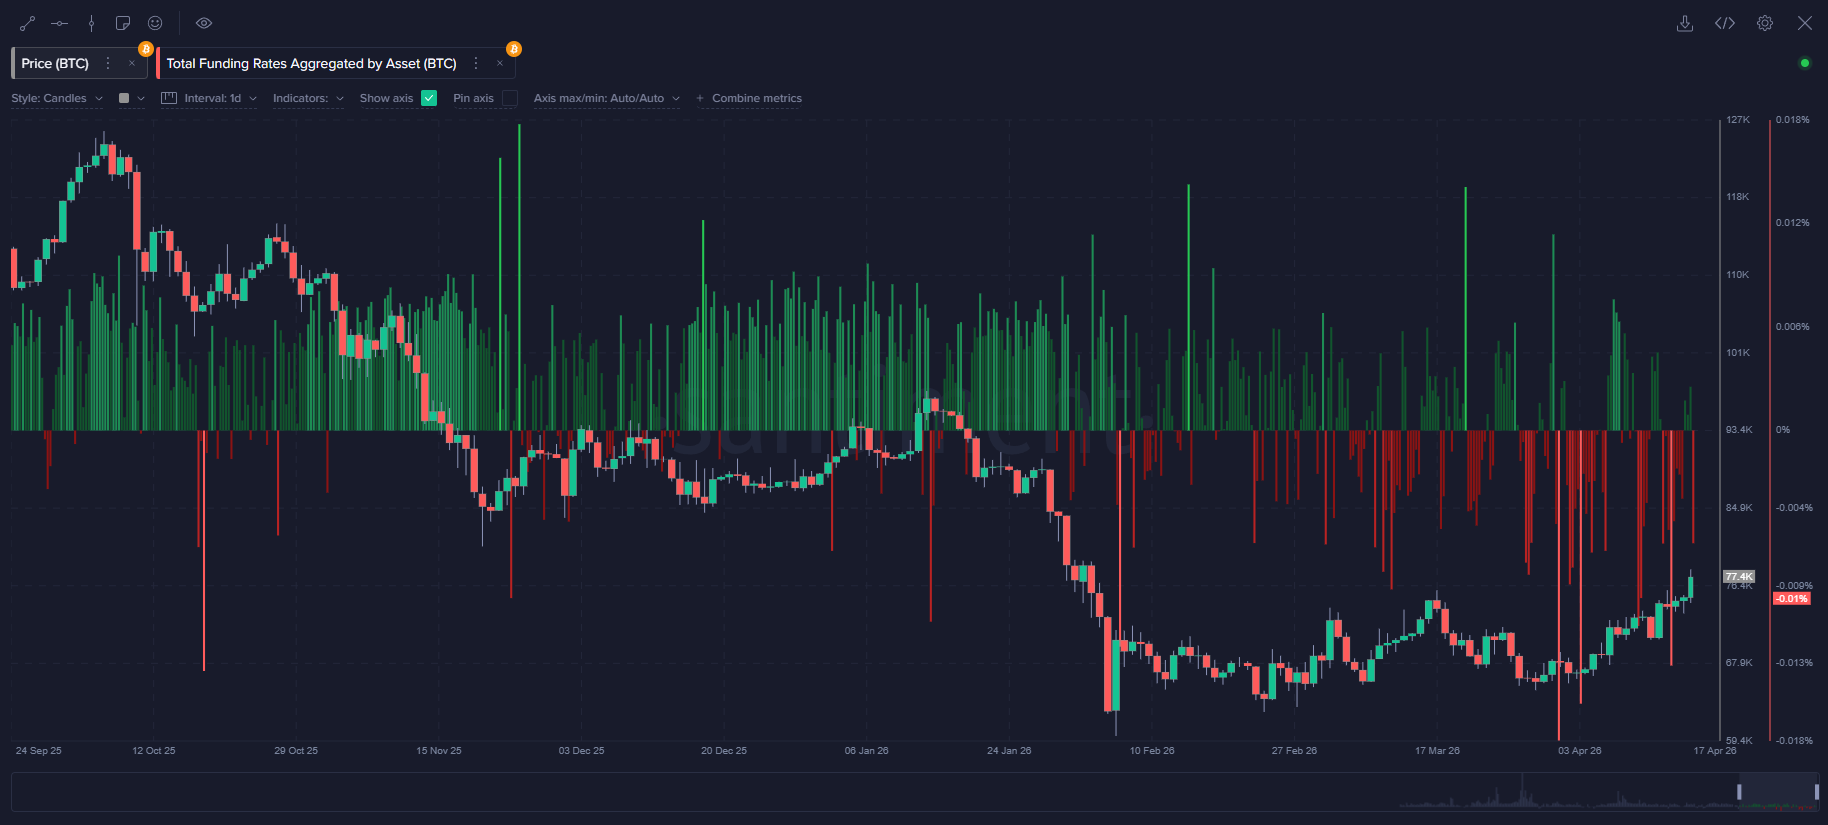
14:05 - Shorts Get Wrecked: Funding Rates Flip Neutral
Aggregated funding rates moved from heavily negative clusters toward neutral, with short positions liquidated as price ran higher. The Santiment team drew a direct comparison to mid-August 2024, when a similar shift marked a transition from bottom-building into trend continuation. Binance remains short-heavy, which could provide additional fuel.
- Key Data: Aggregated funding rates shifting from negative to neutral. Binance still short-heavy(chart).
- Actionable Tip: Short liquidation cascades near local lows have frequently preceded extended upward continuation.
17:03 - Whales Are Accumulating. Retail Won't Stop Buying.
Whale transactions hit their highest level in five to six weeks. The 10 to 10,000 BTC key stakeholder tier logged a clear accumulation spike. But small retail wallets continue to buy every dip. The Santiment team flagged retail persistence as the biggest near-term concern, because markets generally move against the side holding the heaviest positioning.
- Key Data: Whale transaction spike at a 5–6 week high. Retail wallet count continues climbing(chart).
- Actionable Tip: Retail exhaustion, rather than retail enthusiasm, has typically set up the strongest key stakeholder-driven rallies.
18:46 - The $81K Trap Everyone Is Walking Into
Alpha Narratives surfaced converging stories: Charles Schwab rolling out direct spot Bitcoin and Ethereum trading, Bitcoin clearing $75K and $77K, and widespread chatter about rejection at $81K with profit-taking clustered at $80–84K. The Santiment team noted that when the crowd telegraphs a specific exit zone, price often runs straight through it to punish early sellers.
- Key Data: Bitcoin cleared $77K. Trader consensus clusters exit plans at $80–84K.
- Actionable Tip: Widely anticipated resistance levels tend to break on the first attempt when retail positioning is heavily one-sided.
21:29 - Why Markets Always Punish the Majority
The Santiment team made a distinctive argument here: markets are already pricing in the next round of escalation, before anyone knows what form it will take. Every ceasefire-driven rebound carries the seeds of its own unwind. Price cannot meaningfully decline until enough long positions accumulate to be punished. For the current week, the team expects range-bound action with a possible spike toward $80K, then caution.
- Key Data: Analyst outlook: range-bound week, possible $80K spike.
- Actionable Tip: Crowded positioning is often a stronger contrarian signal than fundamental analysis, particularly during reflexive news cycles.
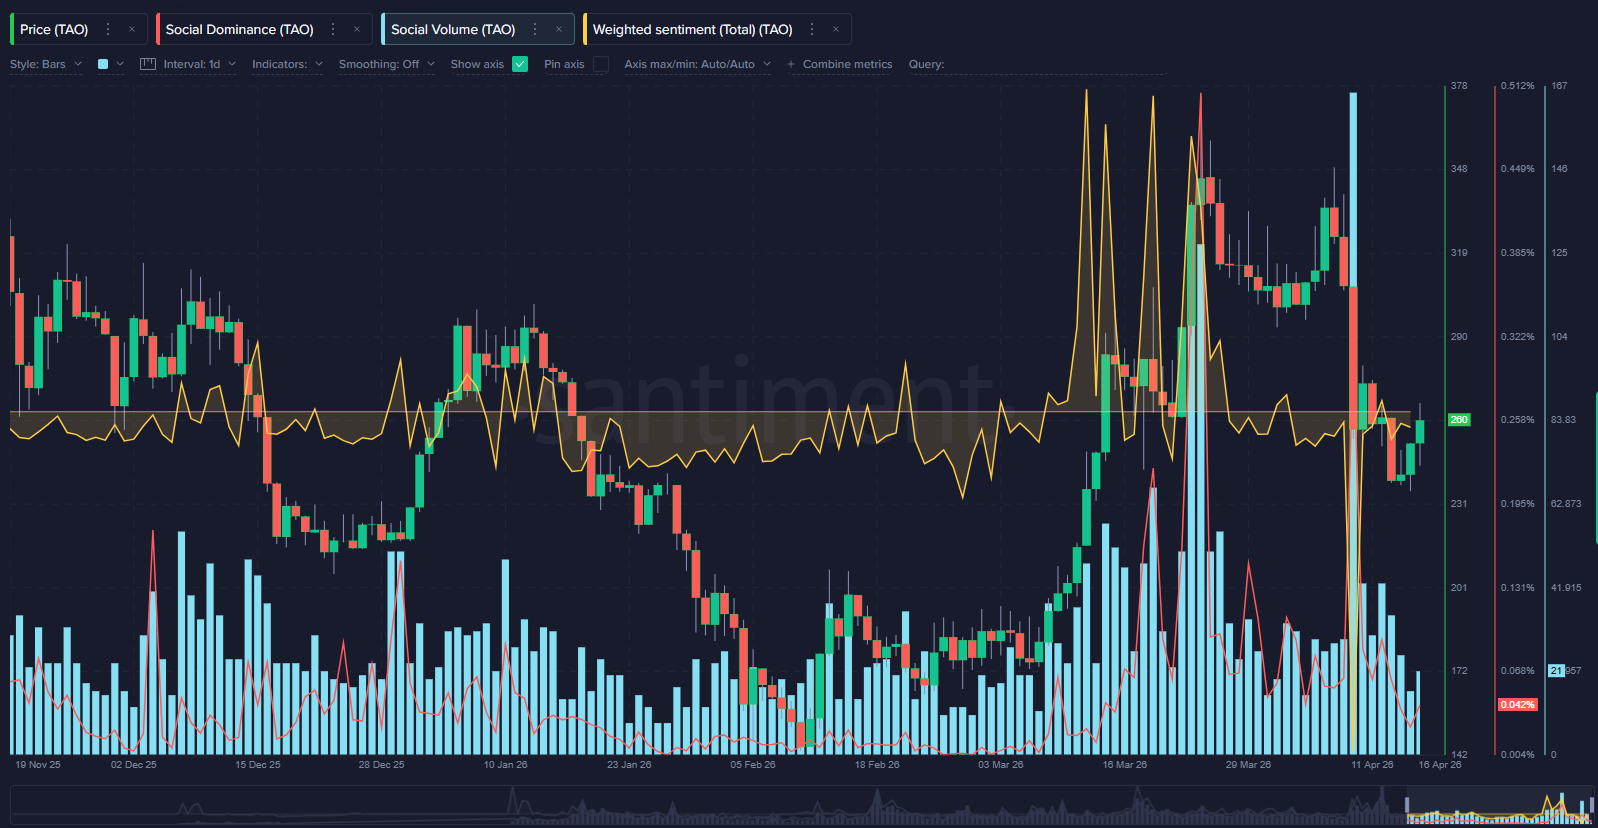
27:30 - BitTensor's Collapse and Hyperliquid's Warning Signs
Alpha Narratives flagged BitTensor as a textbook overexcitement case: viral "next Bitcoin" comparisons preceded a sharp spot-driven collapse within a week. The Santiment team is now watching Hyperliquid for similar early warning patterns — prominent investor commitments and ETF speculation — while acknowledging Hyperliquid's fundamentally and structurally stronger foundation given its established community and product.
- Key Data: BitTensor($TAO) collapsed within roughly a week of peak narrative intensity(chart).
- Actionable Tip: Peak narrative concentration around a single asset has more often marked a local top than a trend continuation.
31:50 - Lido DAO Catching Momentum
Lido DAO is topping the activity matrix — whale transactions, network growth, and active addresses all spiking together. But its price already sits in the top 97th percentile over seven day price change and the 96th percentile over the thirty day. The Santiment team read this combination as a classic exhaustion signal: peak on-chain activity after significant outperformance has historically favored mean reversion over continuation.
- Key Data: LDO in 97th percentile (7-day) and 96th percentile (30-day) versus peers(asset activity matrix).
- Actionable Tip: Coins peaking in on-chain activity after major outperformance have historically been likelier to revert than extend due to people piling into the hype.

35:21 - The Rule Most Traders Miss: Sudden Spikes = Reversals
The LDO analysis was arguably the most actionable insight of the stream. The Santiment team's rule, refined across multiple research iterations: sudden, sharp spikes in network activity, social volume, or whale transactions tend to precede reversals — not confirm trends. Gradual, sustained increases support the prevailing trend. Sharp divergences mark exhaustion. The rule works symmetrically: sudden spikes during rallies flag tops, sudden spikes during declines flag bottoms.
- Key Data: Framework based on divergence between concentrated on-chain spikes and price direction.
- Actionable Tip: Sharp, concentrated on-chain spikes have correlated more reliably with trend reversals than with continuation.
39:23 - Solana Goes Quiet: A Bottom Signal in Disguise
Solana is among the quietest networks right now, with both on-chain activity and social dominance well below 90-day averages. The Santiment team noted that quiet periods following earlier excitement phases have historically preceded local bottoms. A slight uptick in positive sentiment is visible, though nowhere near January levels — worth watching for early accumulation signs.
- Key Data: Solana on-chain activity and social dominance below 90-day averages(chart).
- Actionable Tip: Extended lowered activity following a hype phase has historically correlated with local bottoming patterns.
Conclusion
This market sits in a fragile but genuinely interesting position. Sentiment skepticism, funding rate normalization, and a fresh whale accumulation spike all argue the rebound thesis has strengthened. Against that, weak network fundamentals, persistent retail greed, and a short-term MVRV approaching elevated zones argue for caution.
Don't trade on feelings, trade on data. Sign up for app.santiment.net and join our discord for access to real time metrics and analysis. For more data-driven crypto analysis, subscribe to our YouTube channel, our Substack, or follow us on Santiment Insights.
Disclaimer: The opinions expressed in the post are for general informational purposes only and are not intended to provide specific advice or recommendations for any individual or on any specific security or investment product.