
This Week in Crypto, Full Written Summary: W1 December

Whales Are Buying Bitcoin, But Is Retail Greed a Red Flag?
Executive Summary
- Whales Are Buying: For the first time in months, large Bitcoin holders have started accumulating significantly, adding over 45,000 BTC in just one week, signaling potential confidence in future price action.
- Retail Greed Flashes Warning: Despite whale buying, retail sentiment has flipped to extreme greed across major cryptocurrencies, a contrarian indicator that often precedes market pullbacks.
- Gold vs. Bitcoin & Shifting Narratives: The market is being shaped by unusual dynamics, including a strange inverse correlation between gold and Bitcoin, and a shift away from the "buy the dip" mentality as fear-based stories take hold.
Introduction
Welcome to This Week in Crypto, our weekly data-focused crypto market recap. In this written summary, we break down the latest livestream from Brian and Maksim. This week, they explored the rocky price action two months after Bitcoin's all-time high. They uncovered a significant shift in whale behavior that could signal a change in direction. They also look at the strange inverse relationship between Bitcoin and gold and examine why current retail sentiment might be a cause for concern.
(0:00) Market State: Two Months Since Bitcoin's $125.8k All-Time High
It has been two months since Bitcoin reached its historic peak of $125.8k. Since then, prices have seen a significant retracement, dropping as low as $80k before recovering to the current $90k level. Brian described the recent weeks as "topsy-turvy," full of large swings that have heavily influenced trader sentiment.
(1:50) Retail Traders Create Market Patterns for Whales to Exploit
A common belief is that retail traders are simply unlucky. However, Brian explained that their actions actively shape the market. He noted that this past week was heavily impacted by retail decisions to "buy at tops and sell at bottoms." This behavior is not an accident. It creates the very patterns that large players, or whales, use to their advantage.
- Actionable Tip: Observe crowd sentiment. When the majority is fearful, it can be a sign of a bottom, and when they are euphoric, it can signal a top.
(4:50) Historic Step: CFTC Approves Spot Crypto Trading in the US
In major regulatory news, the CFTC has approved spot crypto trading on its registered futures exchanges. This is a first in US history and a significant development for the industry. Acting Chair Caroline Pham called it a "historic step to make America a global crypto hub." This move is seen as an important step toward making crypto more accessible for American traders and affects sentiment metrics positively.
- Key Data: The CFTC has approved spot crypto trading on its registered futures exchanges for the first time in US history.
- Actionable Tip: Keep an eye on regulatory news. Positive developments can increase accessibility and potentially impact market sentiment and adoption over time.
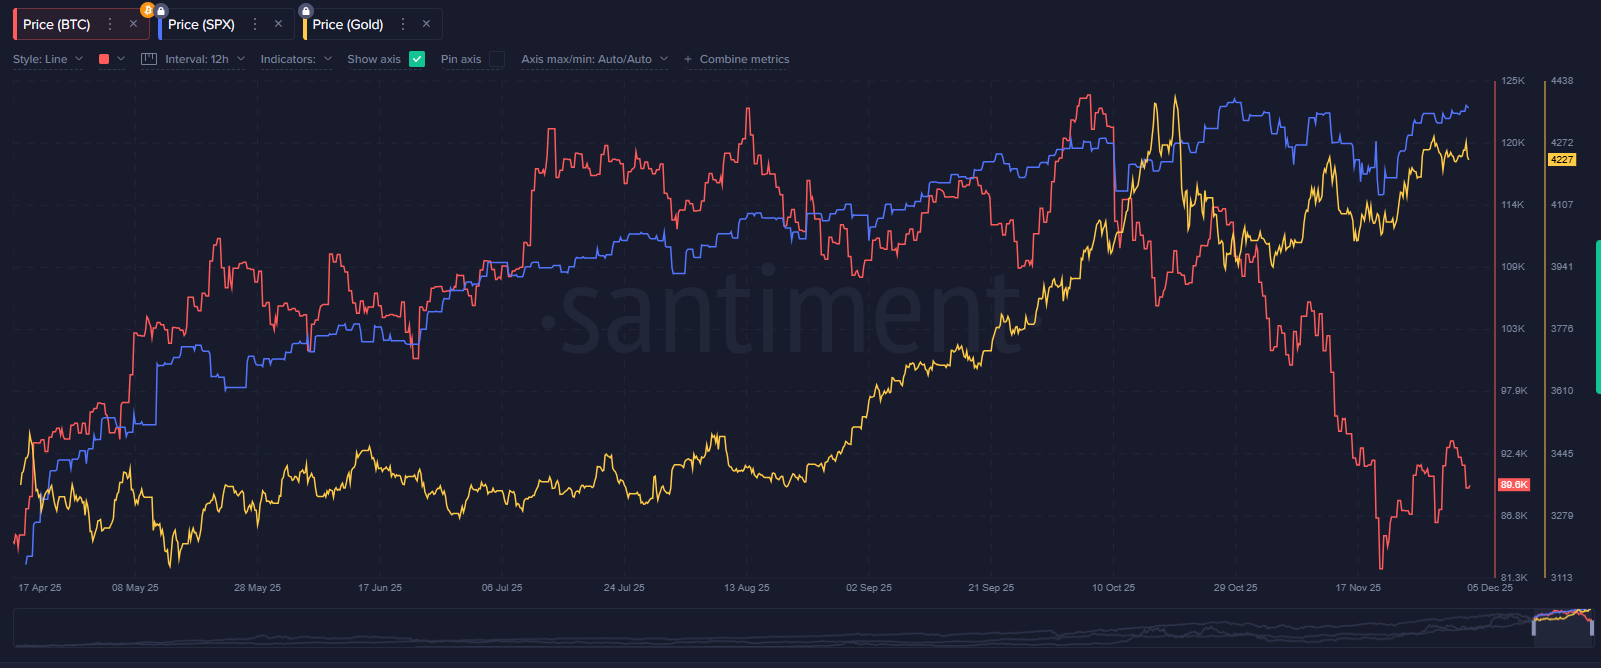
(6:10) 2025 Reality Check: Gold's +61% Gain vs. Bitcoin's Loss
The narrative for 2025 has shifted away from crypto toward traditional assets. A look at year-to-date performance tells the story. Gold has seen a remarkable 61% gain, while the S&P 500 is up 17%. In contrast, Bitcoin is down about 5.5% for the year. This performance difference has led many to abandon crypto for stocks and gold. This narrative and preference flip is a potential indicator that the crypto market is becoming more investable as the crowd shifts away from it.
- Key Data: Year-to-date performance: Gold +61%, S&P 500 +17%, Bitcoin -5.5%.
- Actionable Tip: Compare crypto's performance against other asset classes to understand the broader market narrative and where capital is flowing.
(9:10) The Dominant Narratives Driving Fear: MicroStrategy & Tether FUD
Maksim pointed out that market perception is often driven by dominant narratives. Recently, two major fear-inducing stories took center stage: concerns that MicroStrategy would be liquidated and persistent FUD surrounding Tether. These narratives became so strong that they replaced the previous "buy the dip" narrative.
- Key Data: The MicroStrategy FUD narrative reached a 5% social dominance, a level considered to be a strong signal of market impact.
- Actionable Tip: Track the social dominance of current narratives. When a fear-based story becomes dominant, it often coincides with market bottoms.
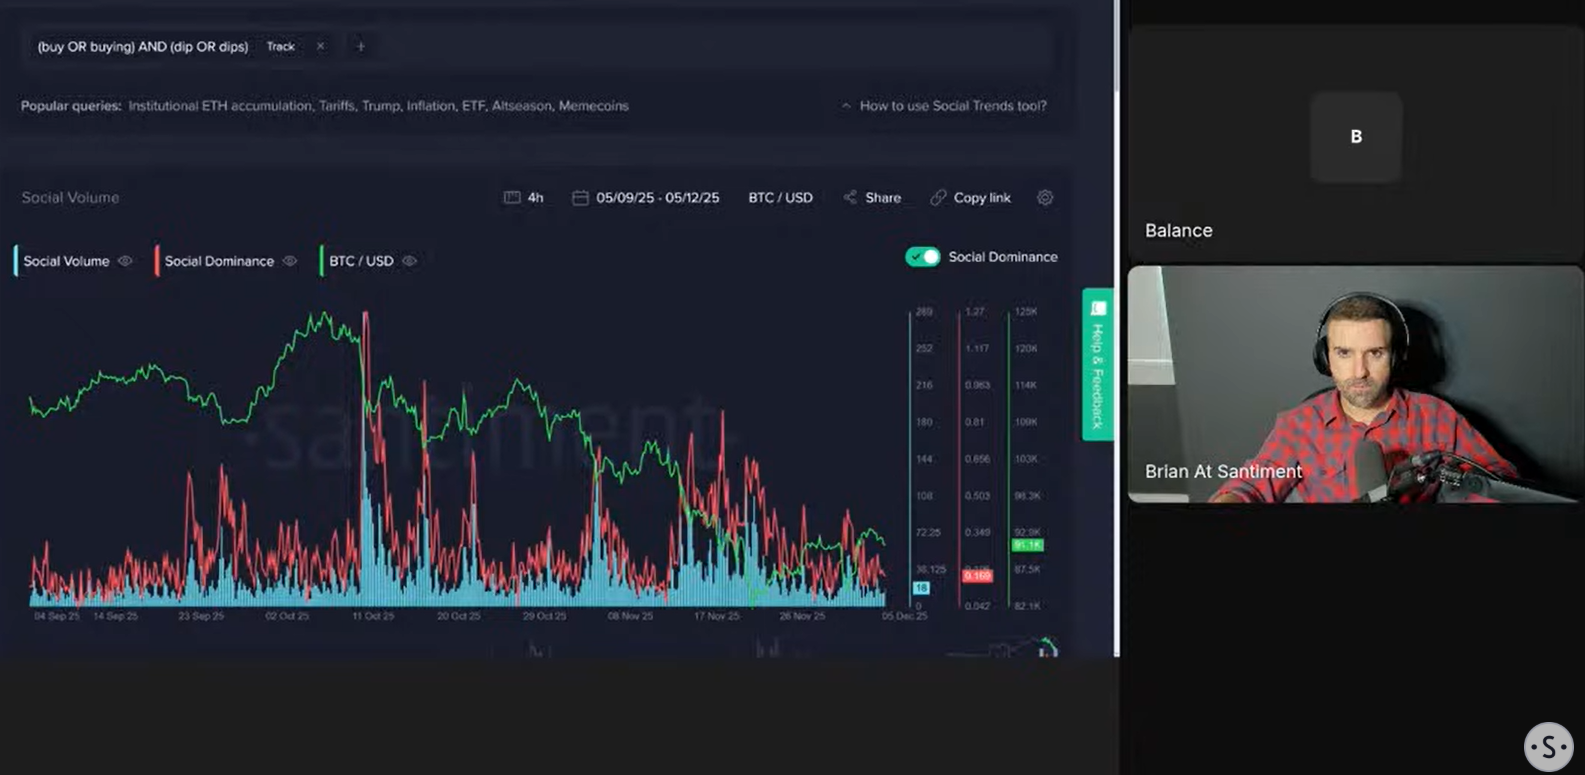
(12:20) Is the "Buy the Dip" Crowd Finally Exhausted?
The call to "buy the dip" has been a constant refrain during downturns. However, Brian and Maksim observed a change in this trend. Recent data shows a decline in social media discussions about buying the dip, even during legitimate price drops. This suggests the crowd is growing tired and losing faith. This makes sense in parallel with the shift towards gold and equities by retail.
- Key Data: Social mentions of "buy the dip" are showing a pattern of declining peaks, suggesting crowd exhaustion.
- Actionable Tip: Monitor social trends for phrases like "buy the dip." A decrease in these mentions can indicate that retail capitulation is near.
(15:50) Michael Saylor as Scapegoat During Bitcoin Dips
An interesting pattern has emerged regarding MicroStrategy's Michael Saylor. Brian observed that conversations about him and his company spike whenever Bitcoin's price falls. The crowd seems to need something to blame for the dip, and Saylor becomes an easy target. However, this narrative typically fades away as soon as prices begin to recover.
- Key Data: Social conversations about MicroStrategy and Saylor consistently decline as soon as Bitcoin's price rebounds.
- Actionable Tip: Identify recurring "scapegoat" narratives. Understanding that they are often tied to price dips can help filter out emotional noise.
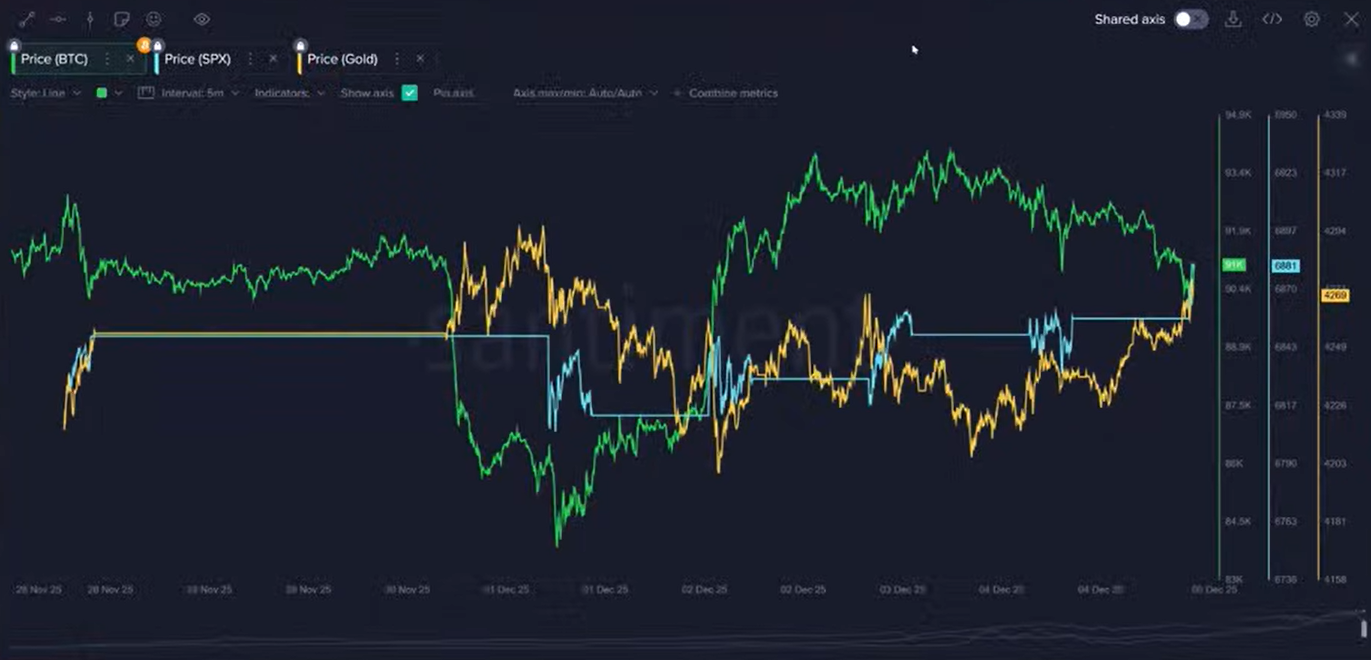
(22:00) A Mirror Image: The Recent Inverse Correlation Between Bitcoin & Gold
Over the past week, Bitcoin and gold have shown a rare inverse correlation. Their price charts look like near-perfect mirror images of each other. When gold's price rises, Bitcoin's falls, and vice versa. Brian and Maksim discussed this oddity. Brian suggested it could be driven by trading algorithms controlled by whales that recently flipped or changed strategies. Maksim countered that it’s possible large traders are trying to shake out weak hands from both camps. Zooming out, both Brian and Maksim agreed whales are accumulating both.
- Key Data: Bitcoin and gold have displayed a near-perfect inverse price correlation over the last five trading days.
- Actionable Tip: Look for unusual correlations between assets. These can reveal underlying algorithmic trading patterns or shifts in capital allocation.
(28:24) Bullish Signal? Whales Begin Accumulating Bitcoin for the First Time in Months
On-chain data reveals a promising sign. For the first time since the all-time high, large Bitcoin holders are consistently accumulating again. In the last week alone, wallets holding significant amounts of Bitcoin added approximately 45,500 coins. This accumulation during a period of stagnant price action creates a bullish divergence. Brian ranks it a 4/5 in terms of how bullish the signal is. The only thing stopping it from being pure 5/5 is the fact that small holders are also net accumulating.
- Key Data: In the last week, large wallets have added approximately 45,500 Bitcoin to their holdings.
- Actionable Tip: Follow on-chain data for whale wallets. Accumulation by large players during price consolidation can be a strong bullish signal. Look out for when small holders dump while whales accumulate for the strongest indication of a bottom.
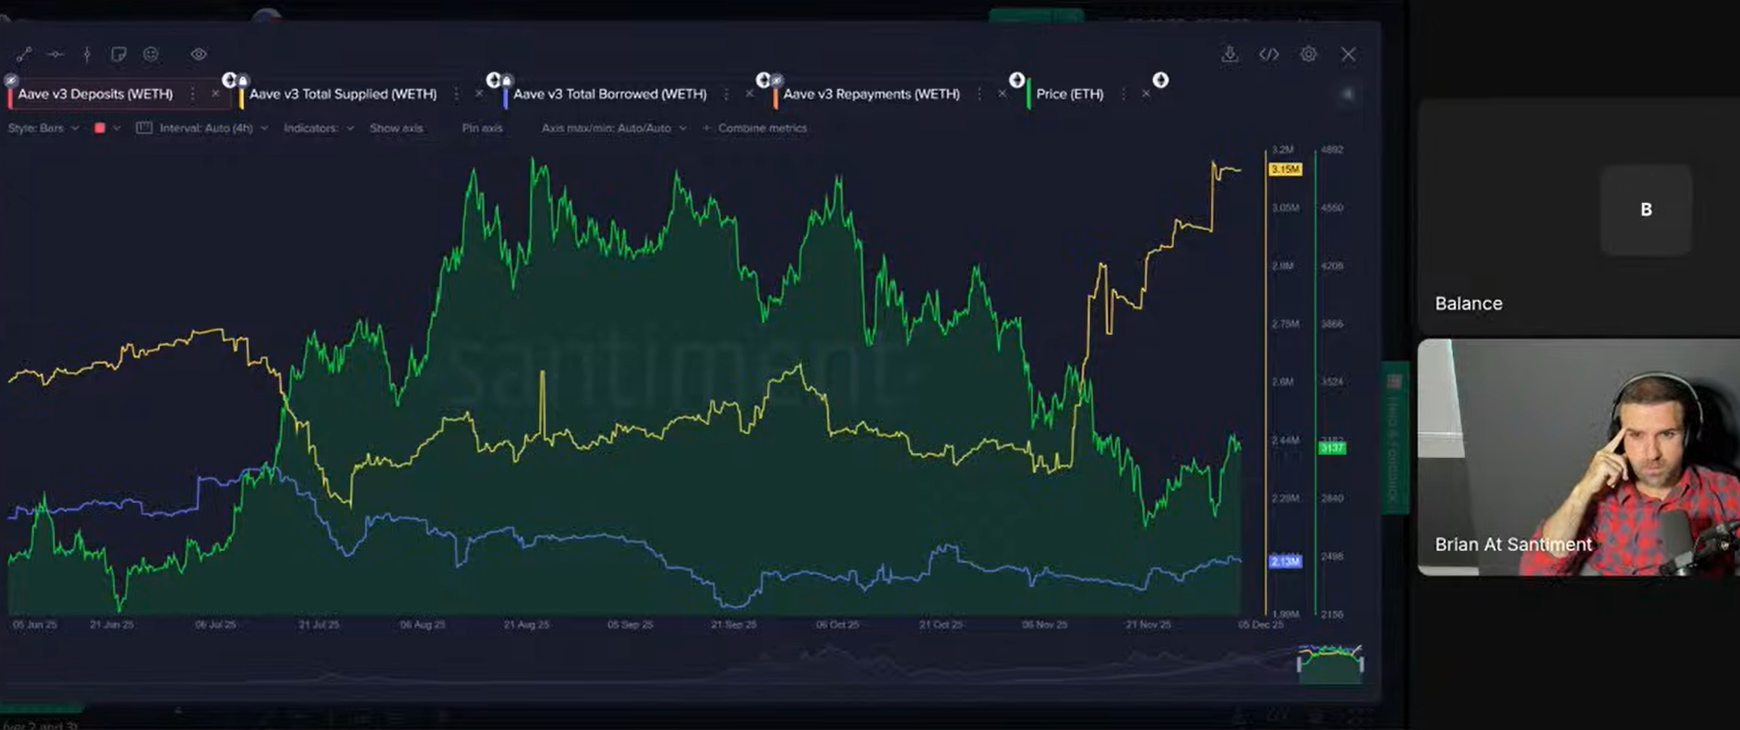
(28:00) What Does WETH's Massive Move to AAVE Signal?
After observing that whales are also accumulating ETH, Maksim highlighted a significant related trend in the DeFi space—A massive amount of Wrapped Ethereum (wETH) has been moving into the AAVE lending protocol. This happened even though the yield is almost non-existent at around 1%. This centralization of assets signals a high degree of confidence among large holders.
- Key Data: The total supply of Wrapped Ethereum on AAVE has increased by about 33% in the last three weeks.
- Actionable Tip: Monitor the flow of assets into major DeFi protocols. A large, centralized movement can indicate high conviction from large holders.
(33:00) Mid-Term Outlook
Despite some positive signs, Maksim believes the market correction may not be over. The high confidence demonstrated by large Ethereum holders moving assets for minimal yield is one indicator. He feels that underlying stories are not fully resolved, leading him to believe that "we are not done yet on the lower side of price discovery." In this segment Brian also observes that 1yr MVRV is quite low, offering a good indicator for a possible entry into the market. Brian also looks into funding rates that are showing a very small bullish bias. He also looks into Whale TX count, NRPL, Coin Age, and Social Dominance metrics. Watch this portion for the details.
- Key Data: The yield for depositing Ethereum on AAVE is only around 1%, yet deposits have soared 33% in the last week.
- Actionable Tip: Consider the "why" behind on-chain movements. High confidence for low yield can suggest large players are not concerned about short-term price drops.
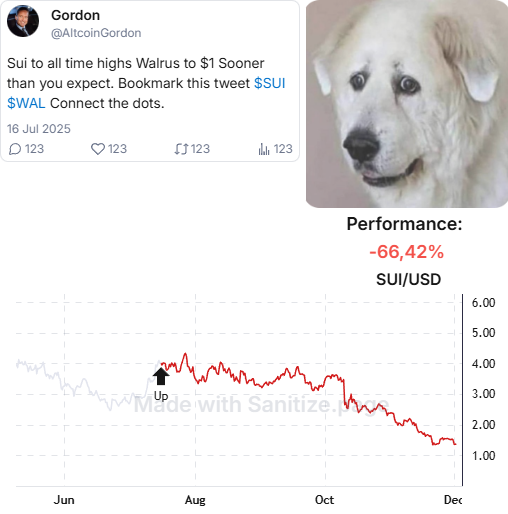
(40:40) The Counter-Signal: When an Influencer's Prediction Goes Spectacularly Wrong
The stream provided a powerful example of using social sentiment as a counter-indicator. Brian shared a story about a crypto influencer who made a bold prediction for the asset SUI to hit $1. Since that confident post was made in mid-July, SUI has lost two-thirds of its market cap.
- Key Data: Since an influencer's bullish call, the asset SUI has lost two-thirds of its market cap.
- Actionable Tip: Be cautious of overly confident predictions from influencers, especially after a significant price run-up. They can often serve as a contrarian indicator.
(43:10) Why Excessive Weekend Greed Could Halt a Crypto Breakout
Current sentiment data presents a potential hurdle for the market. Analysis shows that discussions around top crypto assets like Bitcoin, Ethereum, UNI, XRP, and Binance Coin have gained a positive bias. This indicates a high level of optimism and greed among public traders heading into the weekend, which can act as a barrier to a price breakout.
- Key Data: Sentiment for top crypto assets is showing the largest levels of greed in approximately three weeks.
- Actionable Tip: Use sentiment analysis tools to gauge crowd emotion. High levels of greed across the board can suggest the market is overheated and due for a correction.
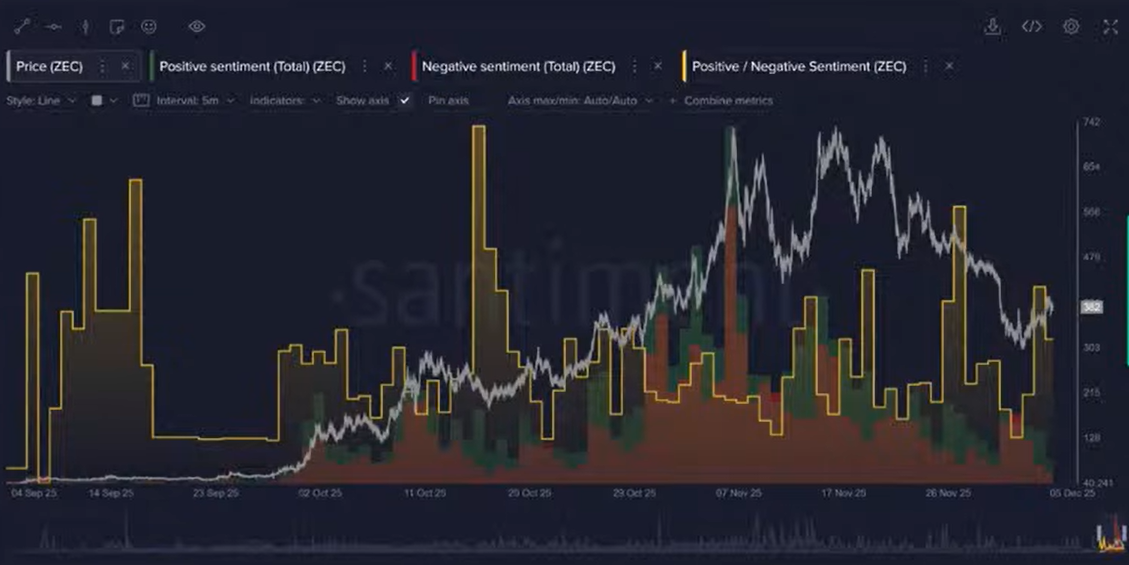
(46:40) Case Study: How Social Data Predicted the Zcash 11x Pump & Crash
Zcash offered a perfect case study for the power of social metrics. The asset went on a massive 11x rally. Maksim explained how a combination of data, including social dominance and weighted sentiment, flashed clear warning signs at the peak. As the crowd's attention spiked and then diverged from the price, it signaled a top.
- Key Data: Zcash experienced an 11x price pump, which was followed by a crash that social metrics helped predict.
- Actionable Tip: For assets on a parabolic run, combine social dominance with sentiment. A divergence where price rises but social chatter fades is a classic topping signal.
Conclusion
This week's analysis from Brian and Maksim reveals a bullish bias both among whales and the public. We see bullish on-chain activity from whales, who are accumulating Bitcoin at a rapid pace. At the same time, excessive greed from retail traders could cap any potential rally. The performance gap between crypto and traditional assets like gold continues to power key narratives like a MSTR liquidation and traditional assets being more attractive investments for retail.
Friday’s analysis show the importance of looking beyond price charts and your own information feeds. By using a data-driven approach that includes on-chain metrics and social sentiment, anyone can gain a more complete picture of market dynamics. To continue learning from these expert analyses, be sure to tune into the next livestream this coming Friday.
To get more data-driven crypto analysis, subscribe to our YouTube channel, our Substack, or follow us on Santiment Insights.