
The Weekly Anomaly Report: W2 April 2026

Welcome to the Weekly Anomaly Report — your curated feed of automated signals detected across the crypto market over the past seven days. Starting this week, we're moving to a Thursday publish schedule to give Friday some breathing room. One housekeeping note: we're aware the hyperliquid_avg_funding_rate metric is generating excessive anomaly records and have a fix in the works. In the meantime, we've added visualizations to make the data easier to parse.
This Week in Brief
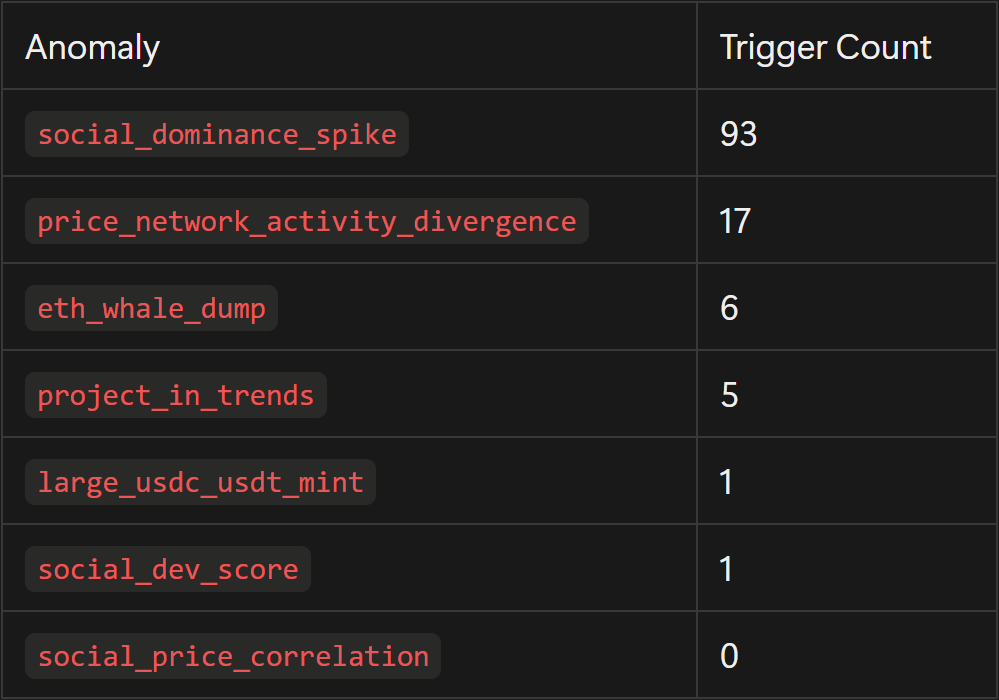
Over the last 7 days, the active anomaly set produced 123 total trigger events across 6 active anomalies between 2026-04-02 04:00:00 and 2026-04-08 00:00:00.
The week was led by social_dominance_spike, which accounted for most of the activity, while eth_whale_dump remained the clearest concentrated risk signal on ethereum. social_price_correlation did not trigger in this window.
Trigger Count Table
What Happened
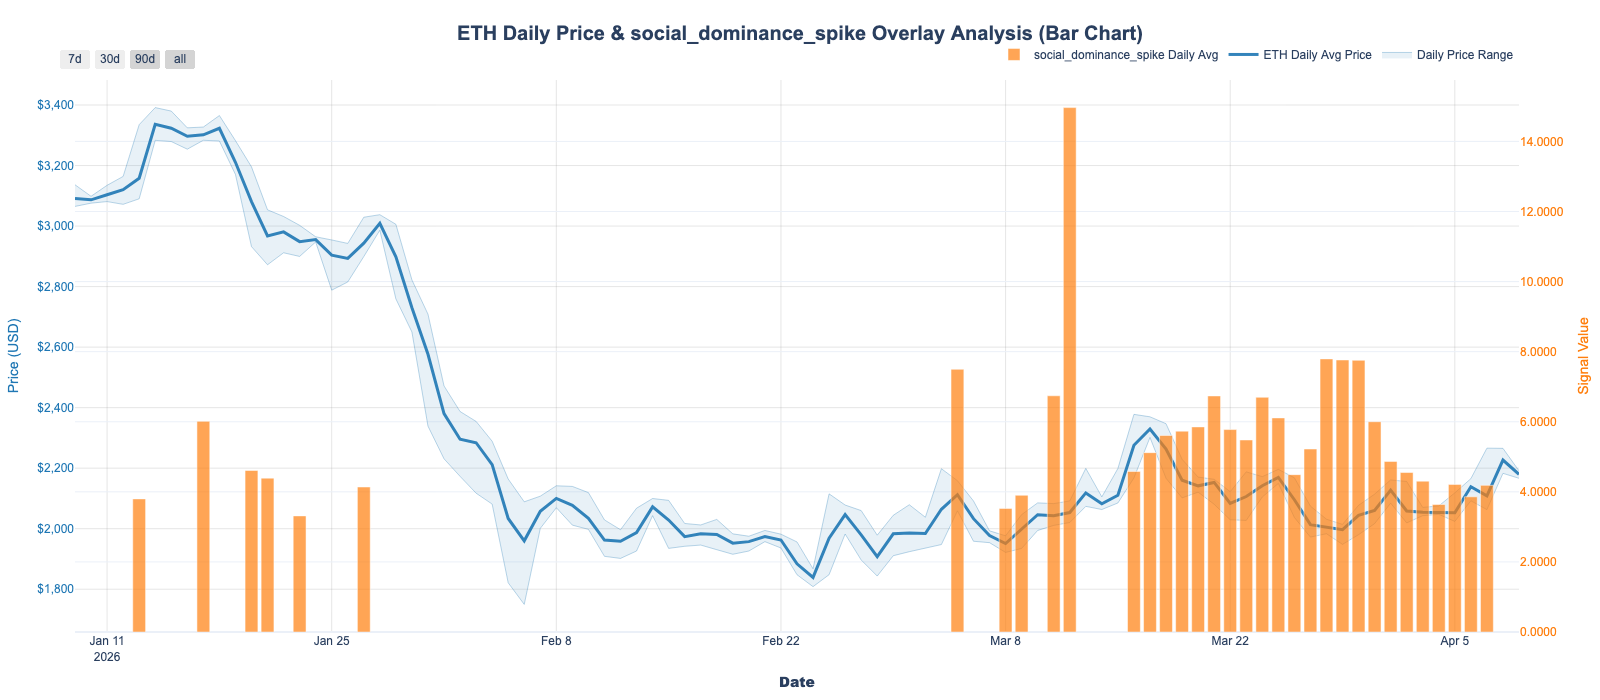
1. social_dominance_spike led the week with 93 triggers across 30 assets. The highest single print was 1inch at 9.15, while the most repeated names were nexo with 16 triggers, usd-coin with 8, and thorchain, multi-collateral-dai, and algorand with 6 each. This looked more like rotating attention than one tightly coordinated narrative.
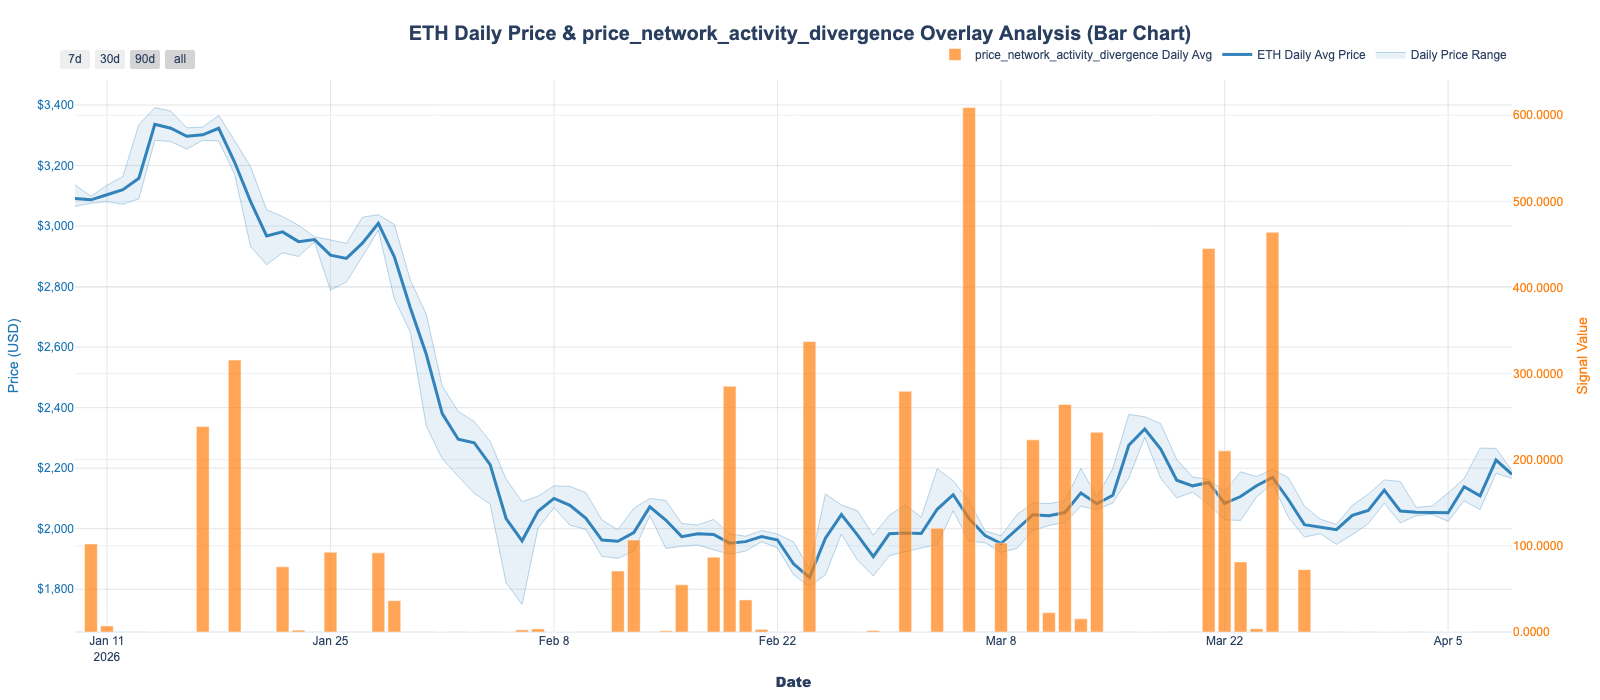
2. price_network_activity_divergence produced 17 triggers across 16 assets, but most values were weak outside a single outlier. o-layerzero led at 2.04, and after that the strongest readings dropped quickly to 0.10 on tether-eurt and brickken.
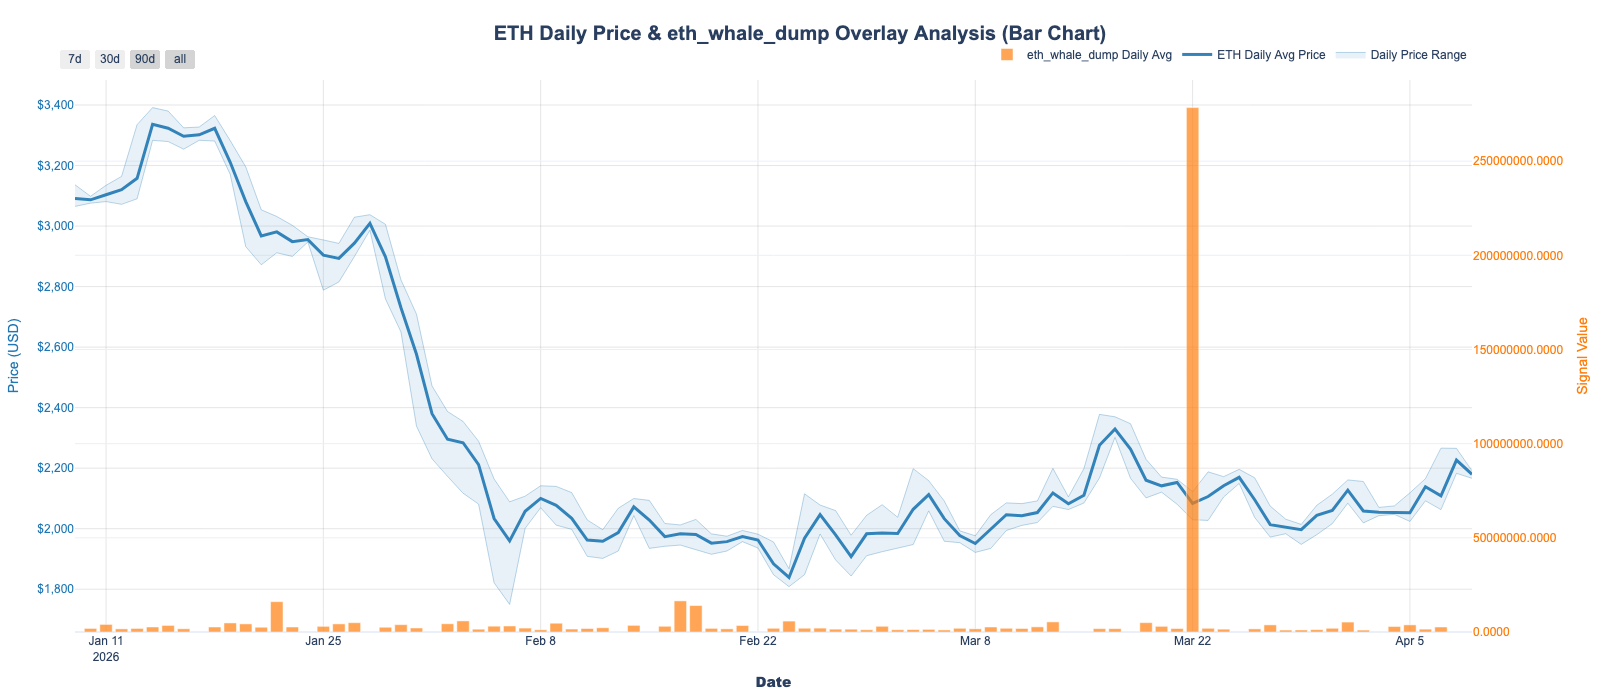
3. eth_whale_dump stayed narrow and important. All 6 triggers landed on ethereum, with an average value of 2,427,440.50 and a peak of 4,197,143.00. The signal ran from 2026-04-02 10:50:47 through 2026-04-07 23:44:47, keeping ETH-specific sell pressure visible through most of the week.
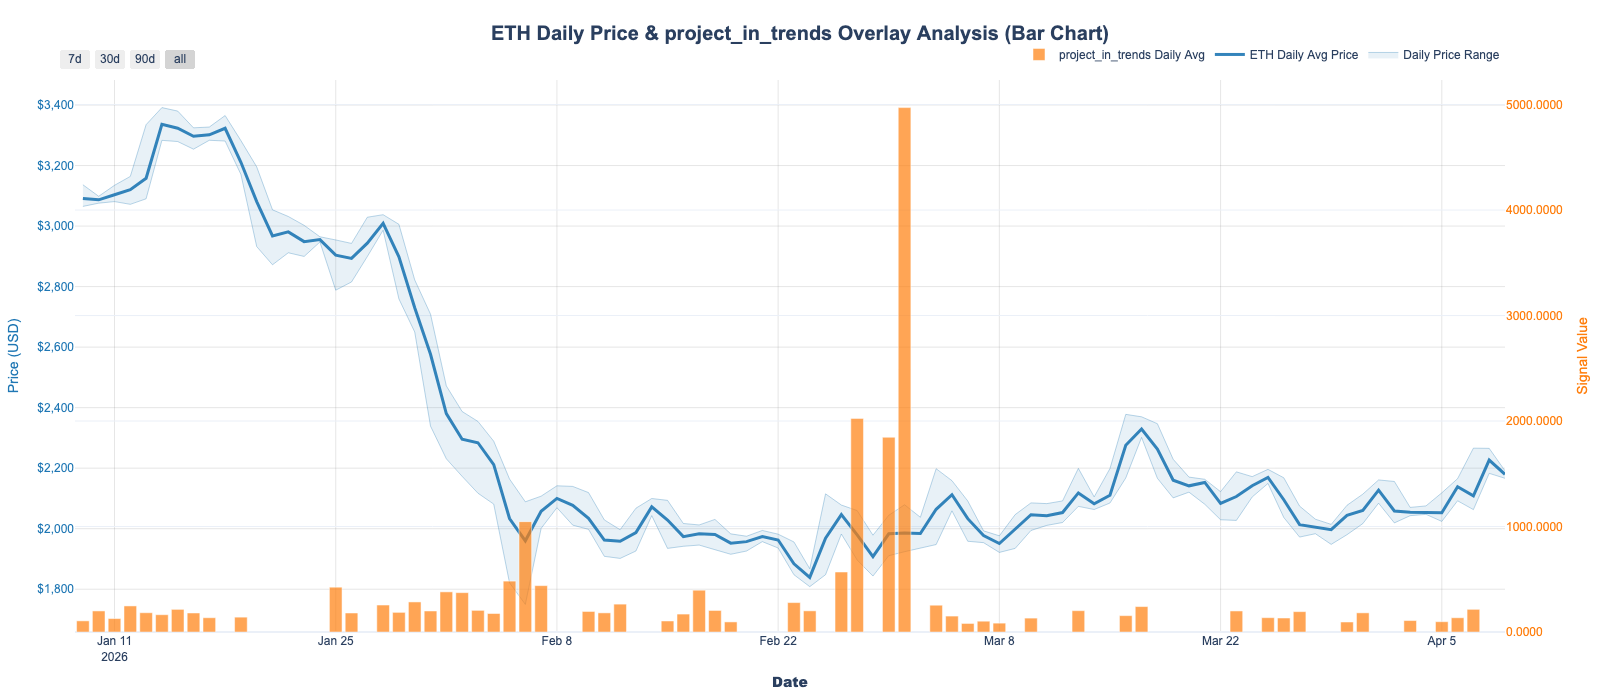
4. project_in_trends stayed selective. It triggered 5 times across 3 assets, led by bitcoin with 3 triggers and a peak of 260.60. aave and solana each appeared once.
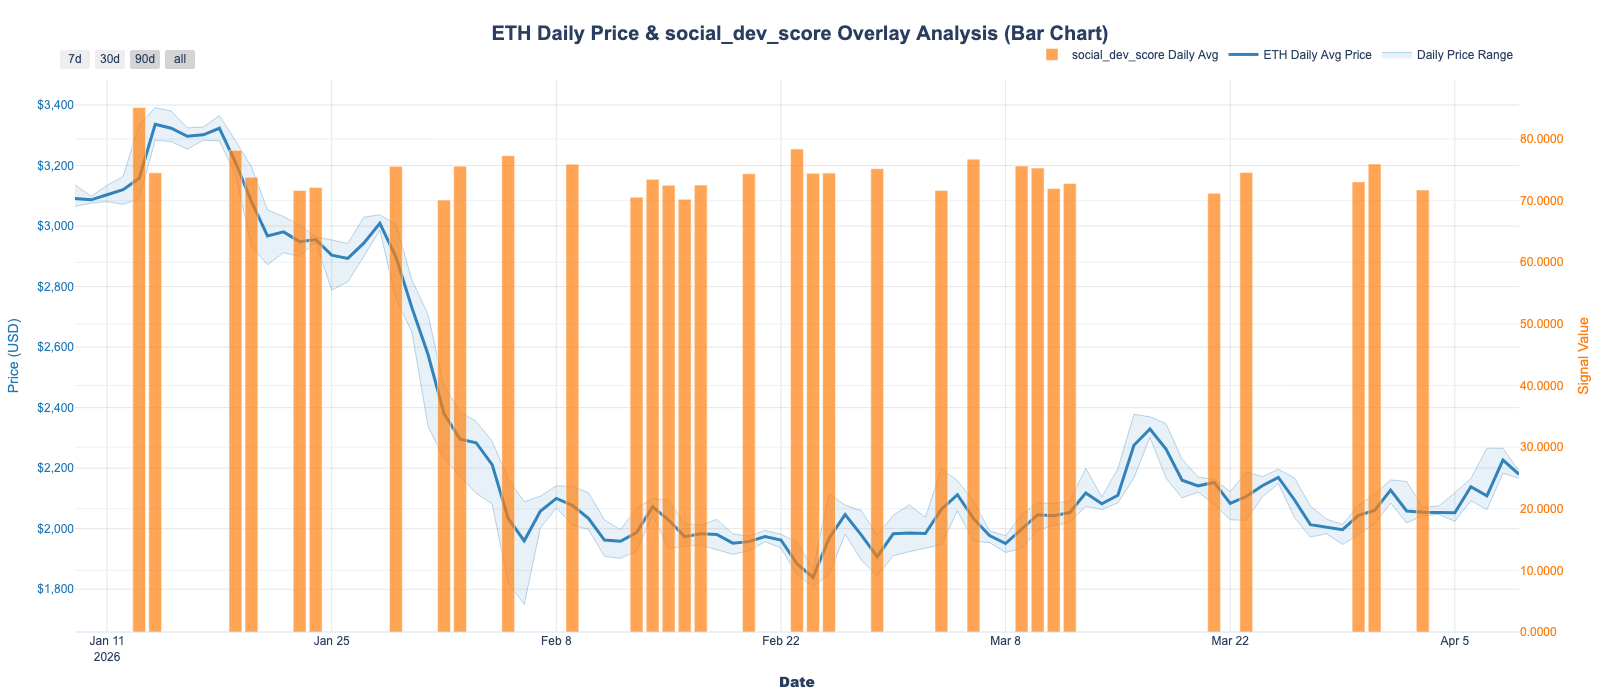
5. social_dev_score also appeared once, on chainbase, with a value of 71.73 on 2026-04-03 00:00:00.
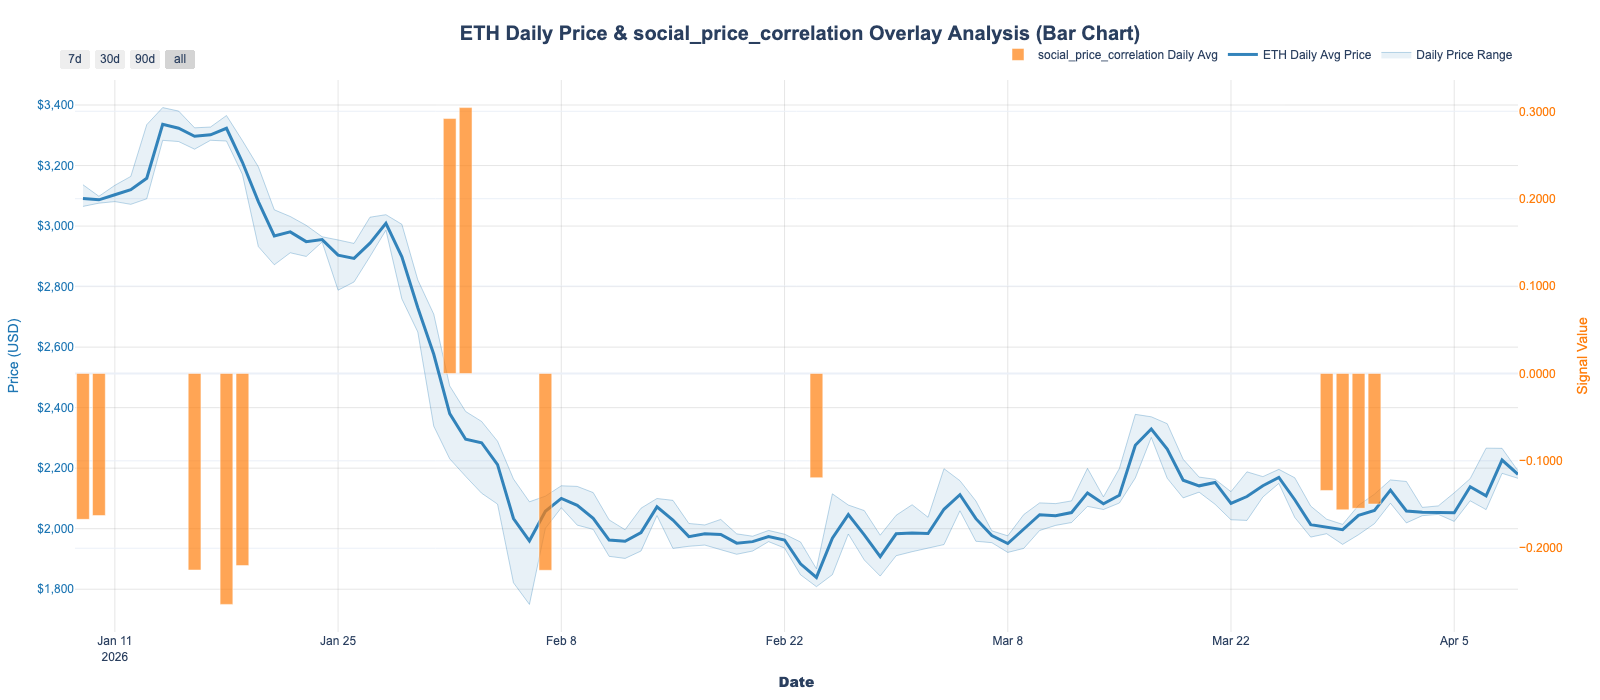
6. social_price_correlation did not trigger in this window, so it was kept in the default set but treated as a no-show for this report.
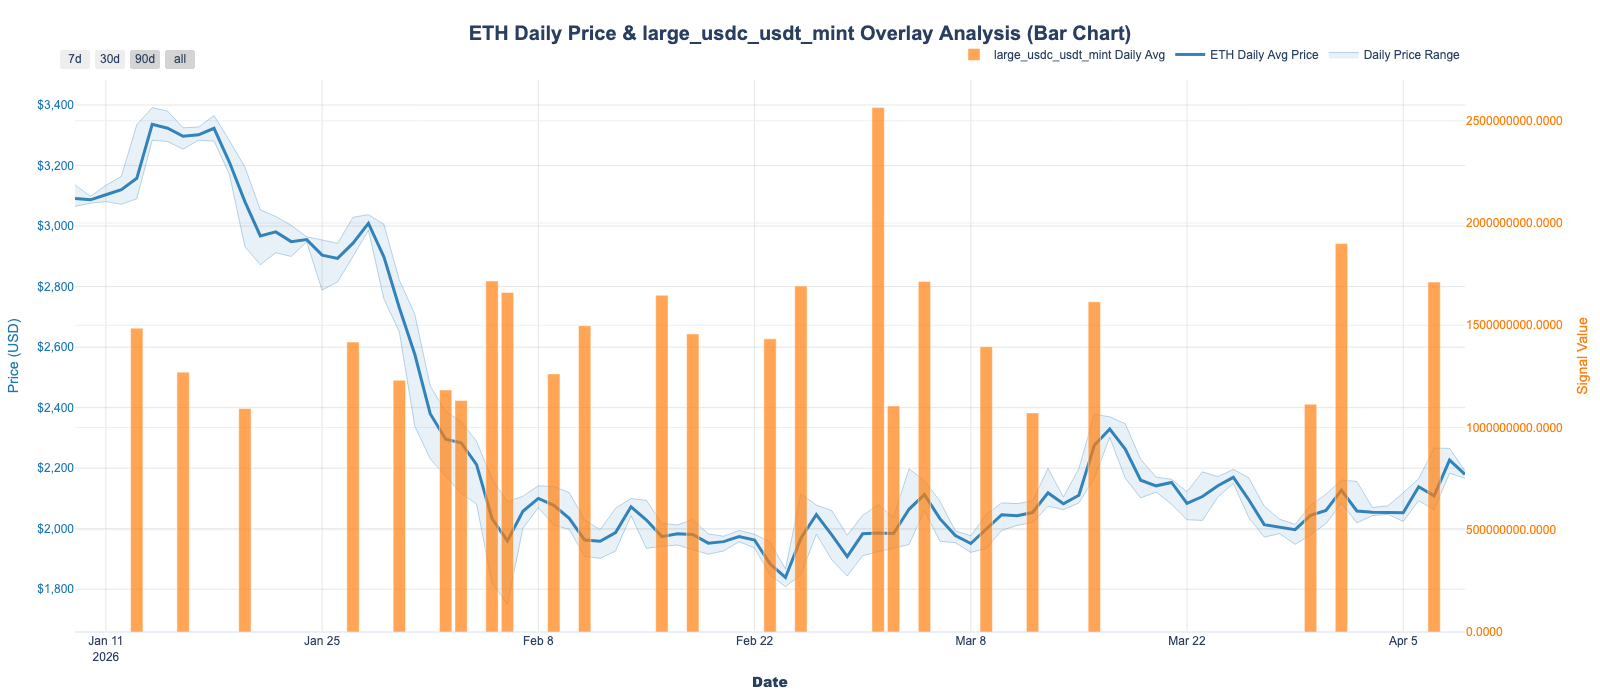
7. large_usdc_usdt_mint appeared once, on 2026-04-07 00:00:00, at 1,711,086,731.91. It was the biggest raw value in the package, but still a one-off event rather than a repeated pattern.
Where Signals Overlapped
Overlap was minimal. Only aave appeared in more than one signal, showing up in both project_in_trends and social_dominance_spike for 5 combined triggers.
Worth Watching
nexo: it led the week's social rotation with 16social_dominance_spiketriggers.bitcoin: it had the cleanest repeat pattern insideproject_in_trends.aave: it was the only cross-signal name, which makes it more interesting than the broader one-off set.large_usdc_usdt_mint: the April 7 mint was large enough to matter if follow-through appears in the next few days.
About the Anomalies We Track
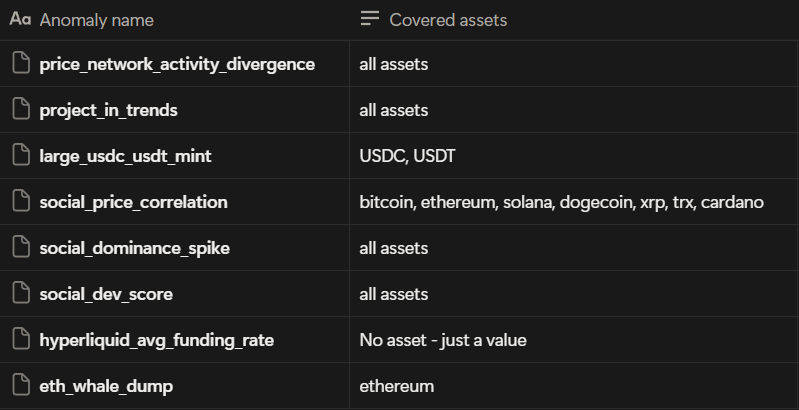
- Network Activity & Price Divergence Anomaly - detects price surges that are not accompanied by a corresponding rise in network activity (real growth). Triggered only if the price growth exceeds 3% on the same day, ensuring the alert is relevant for significant bullish moves.
- Project in Trends Anomaly - detects when a specific crypto token gains significant traction in online discussions, placing it among the top 10 most-mentioned words in crypto-related conversations.
- Large USDC-USDT Mint Anomaly - detects daily combined $1 billion or larger minting events of USDC and USDT stablecoins on the Ethereum blockchain.
- Social Price Correlation Anomaly - detects whether social sentiment and price are behaving in an unusually aligned or unusually decoupled way. The current implementation runs on 1h X.com social data for bitcoin, ethereum, solana, dogecoin, xrp, trx, and cardano.
- Social Dominance Spike Anomaly - detects abnormal spikes in social dominance metrics. It alerts when values exceed a statistical significance thresholds of 3 standard deviations over 30 days.
- Social-Dev Score Anomaly - detects unusual activity compared to recent 30-day history of social media metrics and development activity, the score itself is weighted at 60/40 for social and dev activity.
- Hyperliquid Average Funding Rates Anomaly - detects when rates exceed predefined high/low thresholds of +40% and -20%, measured hourly.
- ETH Whale Dump Anomaly - detects potential large-scale ETH dumps by monitoring whale wallet behaviors, threshold of 500 ETH and uses a 30-day holding period as a key parameter to distinguish between normal trading activity and potential dump scenarios.
Disclaimer: The opinions expressed in the post are for general informational purposes only and are not intended to provide specific advice or recommendations for any individual or on any specific security or investment product.