*New* Santiment Weekly Anomaly Report: W3 March 2026

Report window: 2026-03-13 15:00:00 to 2026-03-18 23:05:00 UTC
Generated on: 2026-03-20
Welcome to the new weekly anomaly report by Santiment. This report is an experiment in giving our community more value and developing methods internally to extract data patterns and anomalies. Enjoy!
Summary
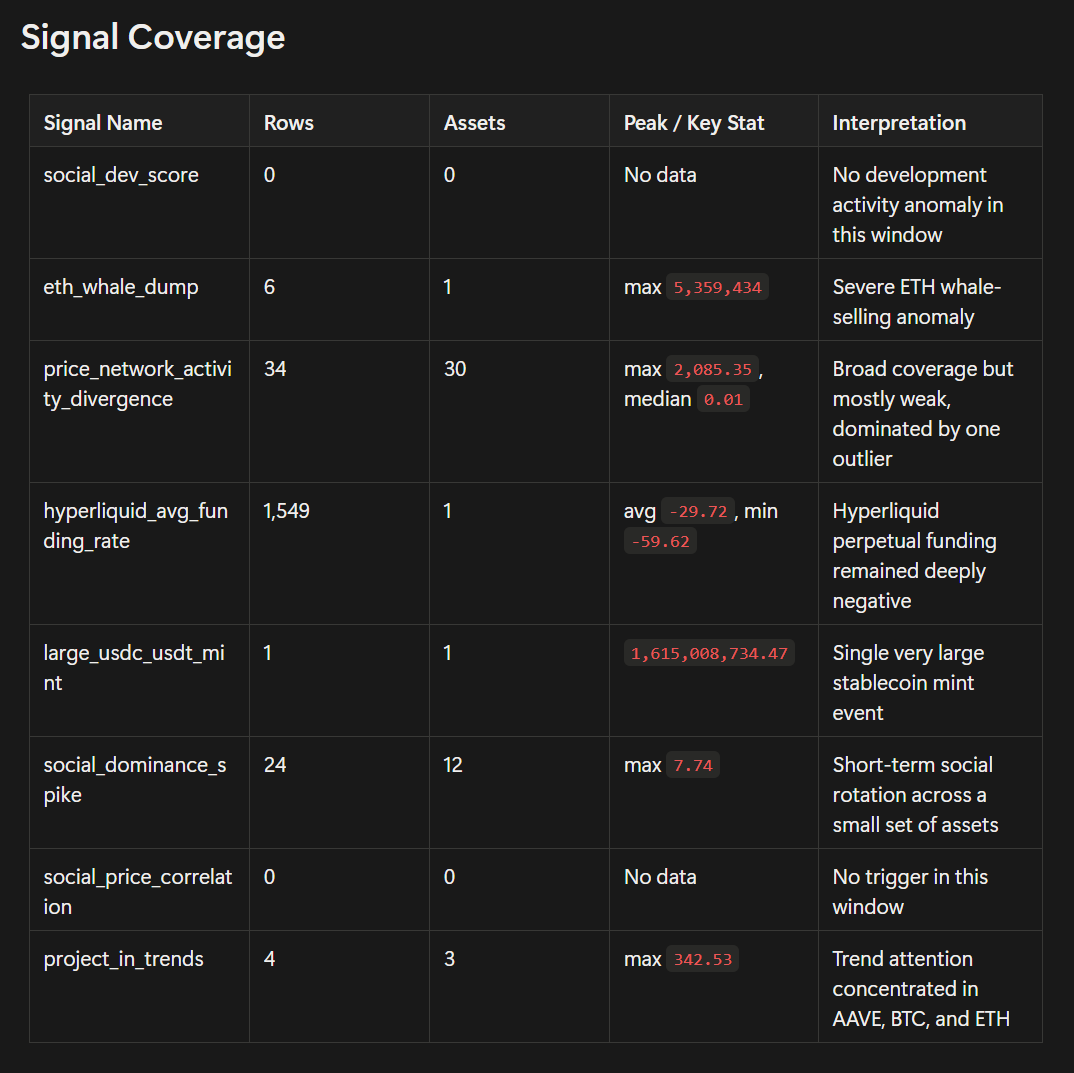
Over the past 7 days, the active signals were eth_whale_dump, price_network_activity_divergence, hyperliquid_avg_funding_rate, large_usdc_usdt_mint, social_dominance_spike, and project_in_trends, producing 1,618 records across 45 assets. The three dominant themes were clear: high-intensity eth_whale_dump activity on ethereum, persistently deep-negative hyperliquid_avg_funding_rate readings across 1,549 observations, and a single large_usdc_usdt_mint event on 2026-03-16 worth 1,615,008,734.47.
From a cross-asset perspective, ethereum appeared in both eth_whale_dump and project_in_trends, meaning it was simultaneously under whale selling pressure and in a high-attention regime. aave appeared in both project_in_trends and social_dominance_spike, which looks more like a narrative-driven attention expansion. By contrast, social_dev_score and social_price_correlation had no triggers during this window, so there was no evidence of development-activity anomalies or meaningful social-price correlation anomalies this week.
Signal Coverage
Key Findings
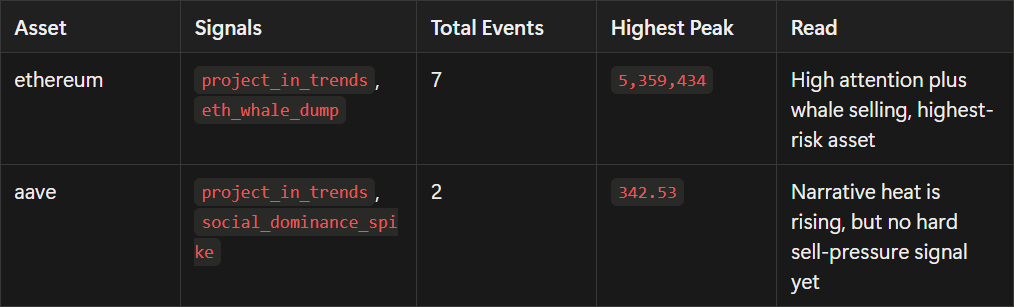
1. Ethereum was the clearest stress asset of the week
ethereum was the highest-priority asset to monitor because it triggered two different signal types:
eth_whale_dump: 6 events, average value2,382,972, peak5,359,434project_in_trends: 1 event, value143.17- The largest whale-dump event happened on
2026-03-13 15:45:47, followed by repeated events on2026-03-16and2026-03-17
This combination usually means the market is not just talking about ETH, but doing so while large holders are actively selling. If ETH continues to weaken over the next 24-72 hours, these signals should be treated as risk confirmation. If price absorbs the selling and rebounds quickly, the setup could flip into a squeeze scenario.
2. Hyperliquid showed a persistently one-sided derivatives structure
hyperliquid_avg_funding_rate was the highest-volume signal in the dataset, with 1,549 observations over 7 days, all in negative territory:
- average
29.72 - median
27.21 - p90
21.22 - min
59.62 - latest timestamp
2026-03-18 23:05:00
This indicates a persistently bearish or heavily crowded short positioning regime on Hyperliquid perpetuals. It does not automatically mean price must go lower, but it does imply elevated structural risk:
- If spot remains weak, negative funding reinforces risk-off conditions
- If price reverses sharply higher, deeply negative funding can fuel a short squeeze
3. The stablecoin mint was the key liquidity event
large_usdc_usdt_mint only triggered once, but the size was extremely large:
- value
1,615,008,734.47 - timestamp
2026-03-16 00:00:00
By itself, this is not a directional signal. It is better interpreted as a liquidity-preparation or capital-allocation event. The real question is where that newly minted stablecoin supply goes next:
- BTC and ETH spot markets
- DeFi lending and collateral flows, especially names like AAVE
- Exchange inflows
If the mint is followed by synchronized strength or capital deployment into majors and DeFi, its market impact becomes more meaningful. Without follow-through, it may remain a balance-sheet or settlement event.
Asset-Level Breakdown
Cross-signal assets
Only two assets appeared across multiple signal types during this window:
Social dominance rotation
social_dominance_spike was concentrated on 2026-03-17 and 2026-03-18, suggesting rapid social rotation:
tezos: 5 events, avg6.89, max7.74ankr: 5 events, avg4.79, max4.96kaspa: 3 events, avg/max5.52bittensor: 2 events, max4.791inch: 2 events, max4.00- Single-event names included
aave,worldcoin-org,ftx-token,usdd,pax-gold,quant, andmulti-collateral-dai
This signal looks more like narrative rotation than systemic market risk. The main question is not whether a single spike happened, but whether these names continue to retrigger over the next 1-2 days. Without repetition, most of these moves should be treated as short-lived attention bursts.
Project trends
project_in_trends only covered 3 assets, but the attention was concentrated:
aave:342.53at2026-03-13 15:00:00bitcoin: 2 events, avg203.98, max241.05ethereum:143.17at2026-03-16 16:00:00
The strongest single reading belonged to AAVE, followed by BTC. BTC triggered twice, which matters because it suggests sustained attention rather than a one-off news event. Combined with the large stablecoin mint, BTC and AAVE are both reasonable candidates for follow-up monitoring if fresh liquidity enters the market.
Price-network divergence
price_network_activity_divergence was highly uneven:
- 34 total records across 30 assets
- median only
0.01 - but
chain-key-ethereumprinted2,085.35 - the next notable value was
crvusdat1.00
This suggests the signal was not broadly strong across the board, but instead dominated by a very small number of outliers. In particular, chain-key-ethereum deserves caution:
- it may reflect a real extreme divergence between price behavior and network activity
- or it may be a statistical distortion driven by a niche or mapped asset
Without secondary validation, price_network_activity_divergence should be used as a supporting signal rather than a primary weekly market call.
Daily Timing Pattern
The daily timeline was also clear:
2026-03-13: the first ETH whale-dump event hit, while AAVE trend attention also appeared2026-03-14to2026-03-18: Hyperliquid funding stayed abnormal almost continuously2026-03-16: the large stablecoin mint occurred, while BTC and ETH trend attention began to rise2026-03-17to2026-03-18: social dominance spikes spread into multiple rotating themes
This sequence does not look like a simple one-directional market. A better reading is:
- First, ETH selling pressure appeared
- Then, derivatives positioning stayed structurally skewed
- Then, a major stablecoin liquidity event occurred
- Finally, social attention rotated into multiple thematic assets
That is more consistent with a volatile reallocation phase than with a clean trend market.
Risk Assessment
High priority
ethereumIt carries both sell-pressure and attention anomalies at the same time.hyperliquid_avg_funding_ratePersistently deep-negative funding means derivatives positioning is already imbalanced.large_usdc_usdt_mintThe size is too large to ignore; if deployment is confirmed, it can become a short-term catalyst.
Medium priority
aaveIt appears in both trend and social-dominance signals, making it one of the strongest narrative names, but it still lacks harder on-chain confirmation.bitcoinTwoproject_in_trendstriggers suggest steady attention growth. That matters more if capital deployment follows.
Lower priority / requires validation
price_network_activity_divergenceMost observations were tiny, with the aggregate picture driven by a few outliers.tezos,ankr,kaspa,bittensorThese are better treated as watchlist names than conviction signals.
Actionable Watchlist
- ETH first Watch whether
eth_whale_dumpretriggers between2026-03-20and2026-03-22, and whether price loses key support. - Hyperliquid funding normalization If funding rebounds quickly from around
20, that may indicate short overcrowding is being cleared. If it pushes back toward40or lower, risk-off pressure is still dominant. - Track stablecoin deployment Monitor whether the large mint is followed by stronger flows into BTC, ETH, AAVE, or major DeFi protocols.
- Separate narrative from flow Most names inside
social_dominance_spikedo not yet have confirming flow or on-chain signals, so they should remain on a narrative watchlist rather than a high-conviction list.
Bottom Line
The main takeaway from this signal set is not that the market has cleanly turned bullish or bearish. It is that market structure has become more imbalanced. The strongest risk signals came from ETH whale selling and persistently negative Hyperliquid funding. The biggest potential catalyst was the very large stablecoin mint on 2026-03-16. The most relevant follow-up assets were aave, bitcoin, and ethereum.
If capital deployment gets confirmed while ETH stops absorbing fresh whale-sell pressure, the market could shift into a high-volatility upward repricing phase. If ETH prints another large dump and funding remains deeply negative, then this anomaly cluster should be interpreted more as risk escalation than opportunity expansion.
Disclaimer: The opinions expressed in the post are for general informational purposes only and are not intended to provide specific advice or recommendations for any individual or on any specific security or investment product.