January 2026 Monthly Report

Following a fairly abysmal 2025 Q4 for crypto markets, Bitcoin and altcoins began to suddenly come on strong as 2026 kicked off. 2025 ended with Bitcoin sitting at ~$87.5K. However, with the help of smart money accumulation combined with retail FUD, crypto’s top asset was looking bright by January 15th, reaching a month-high of $97.7K. At that point, market confidence was elevated, social media commentary leaned bullish, and many traders expected a continuation toward six-figure prices. However, that optimism began to fade in the second half of the month as price action stalled, gold and silver became the latest “shiny new thing” that crypto retail increasingly turned to, and January, 2026 ended with Bitcoin falling below $77.7K for the first time since April, 2025, registering a -14% loss for the month.
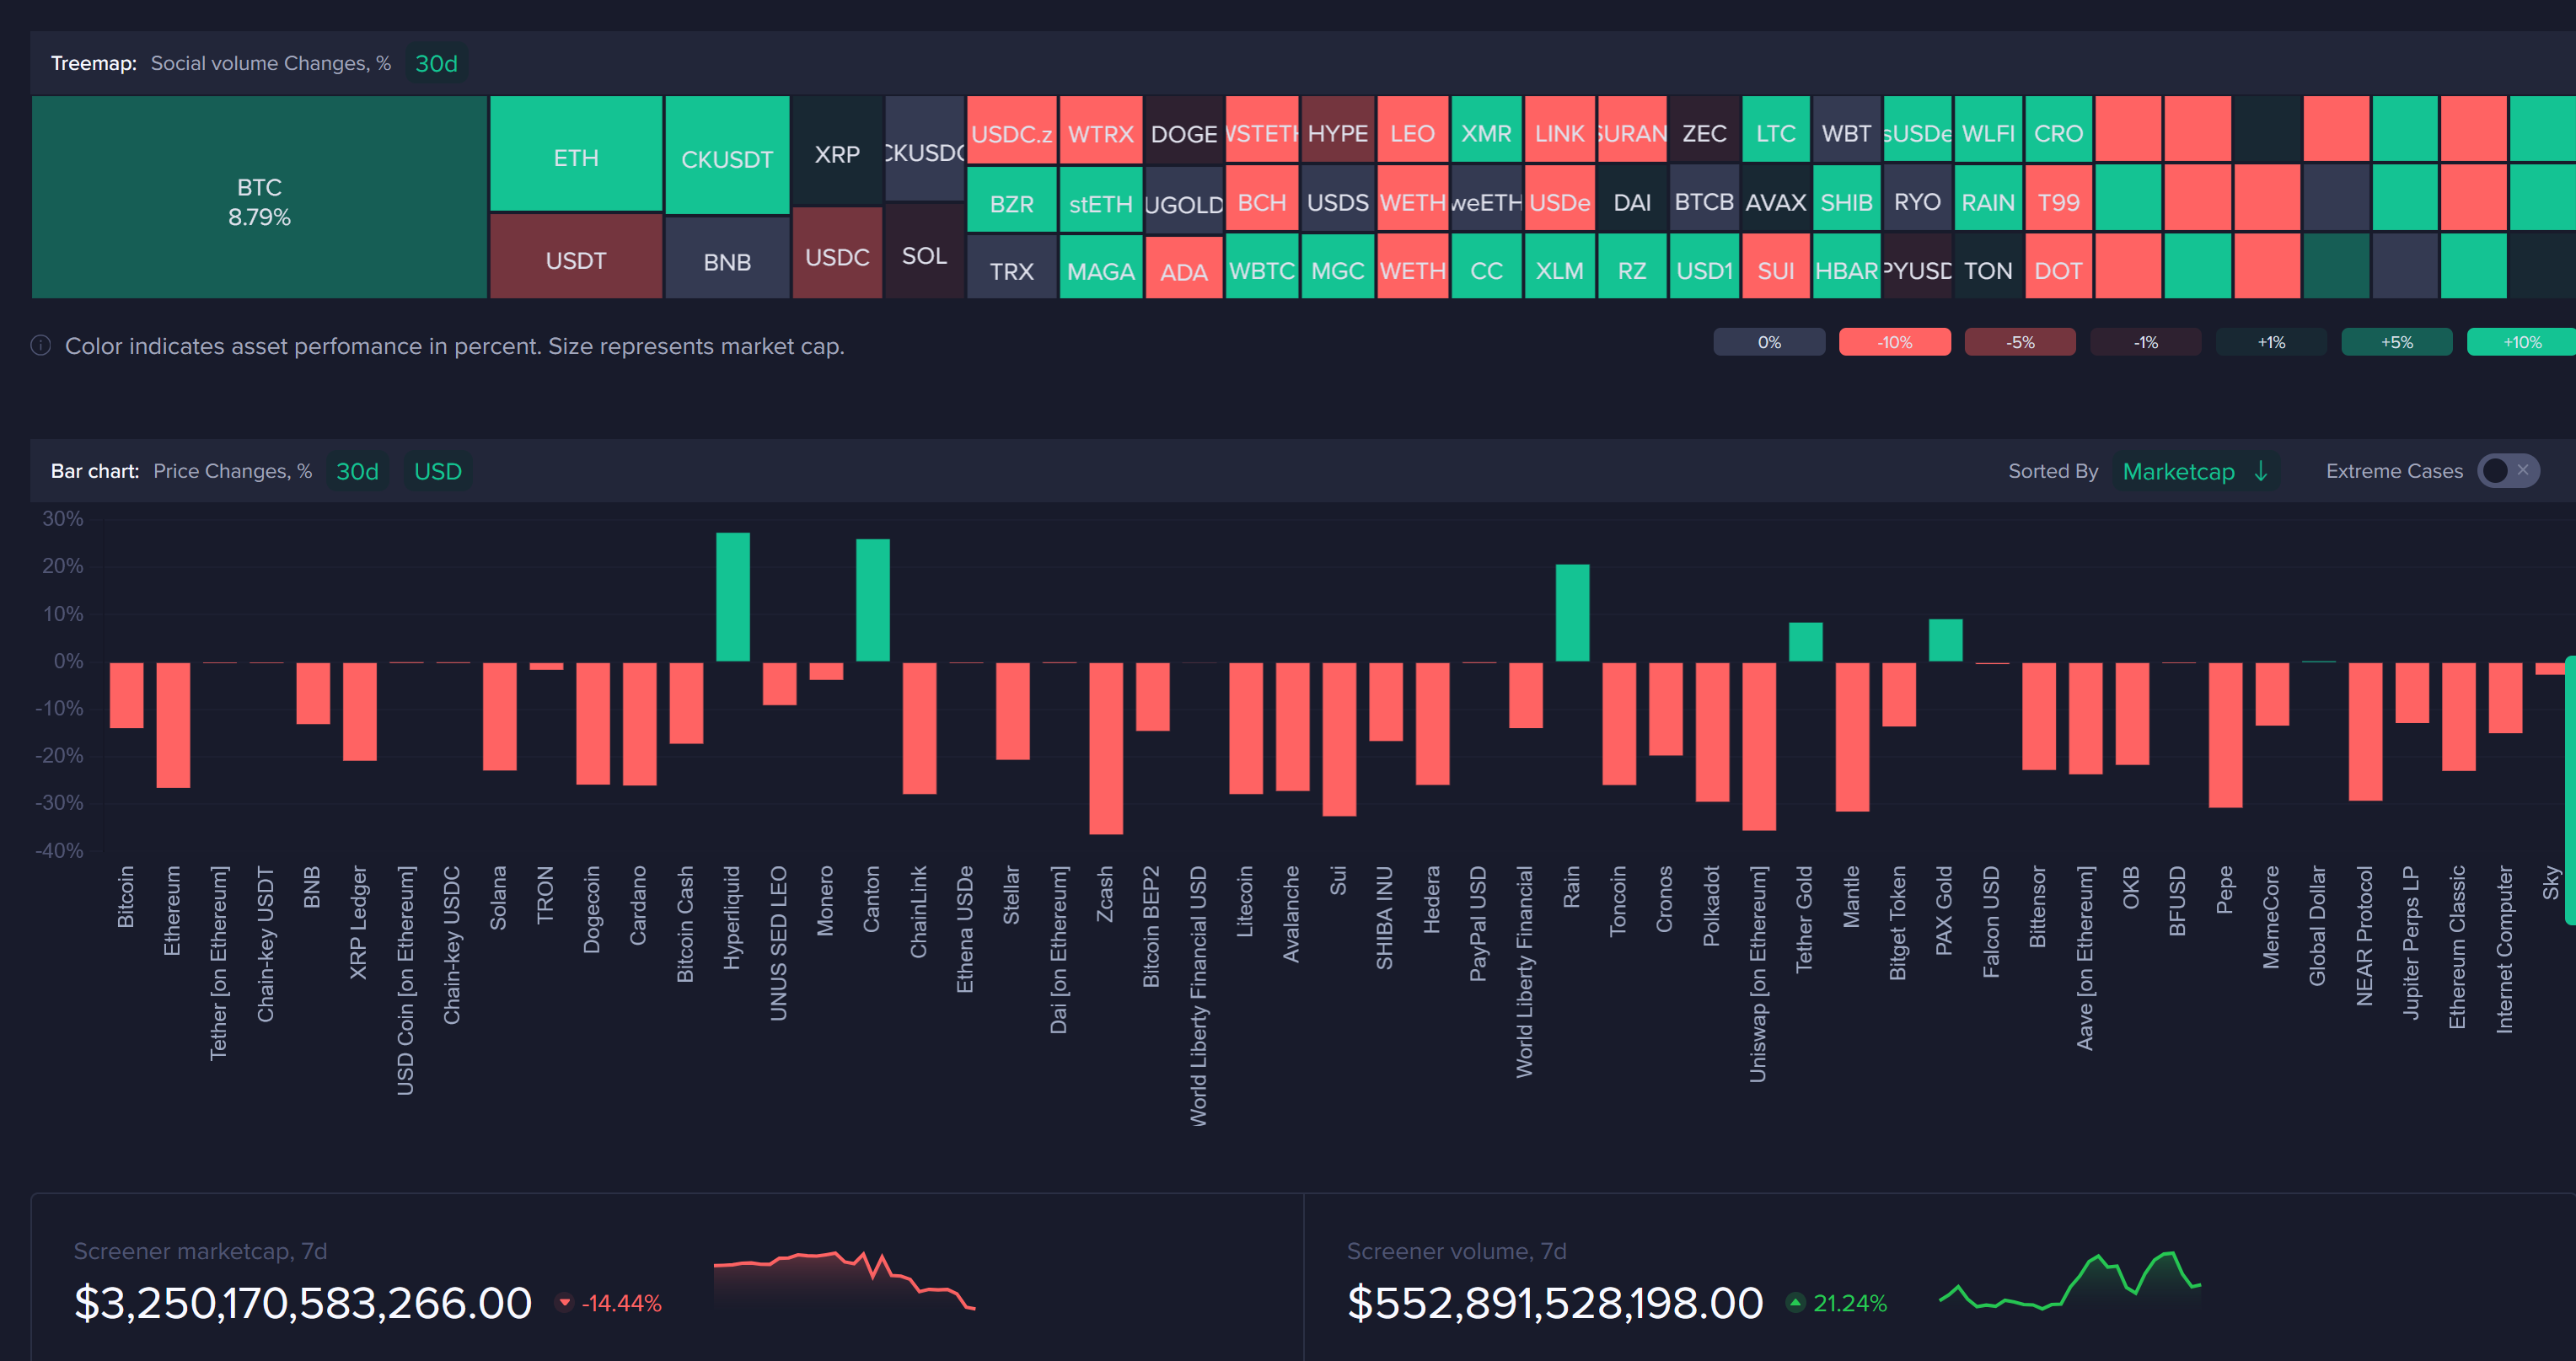
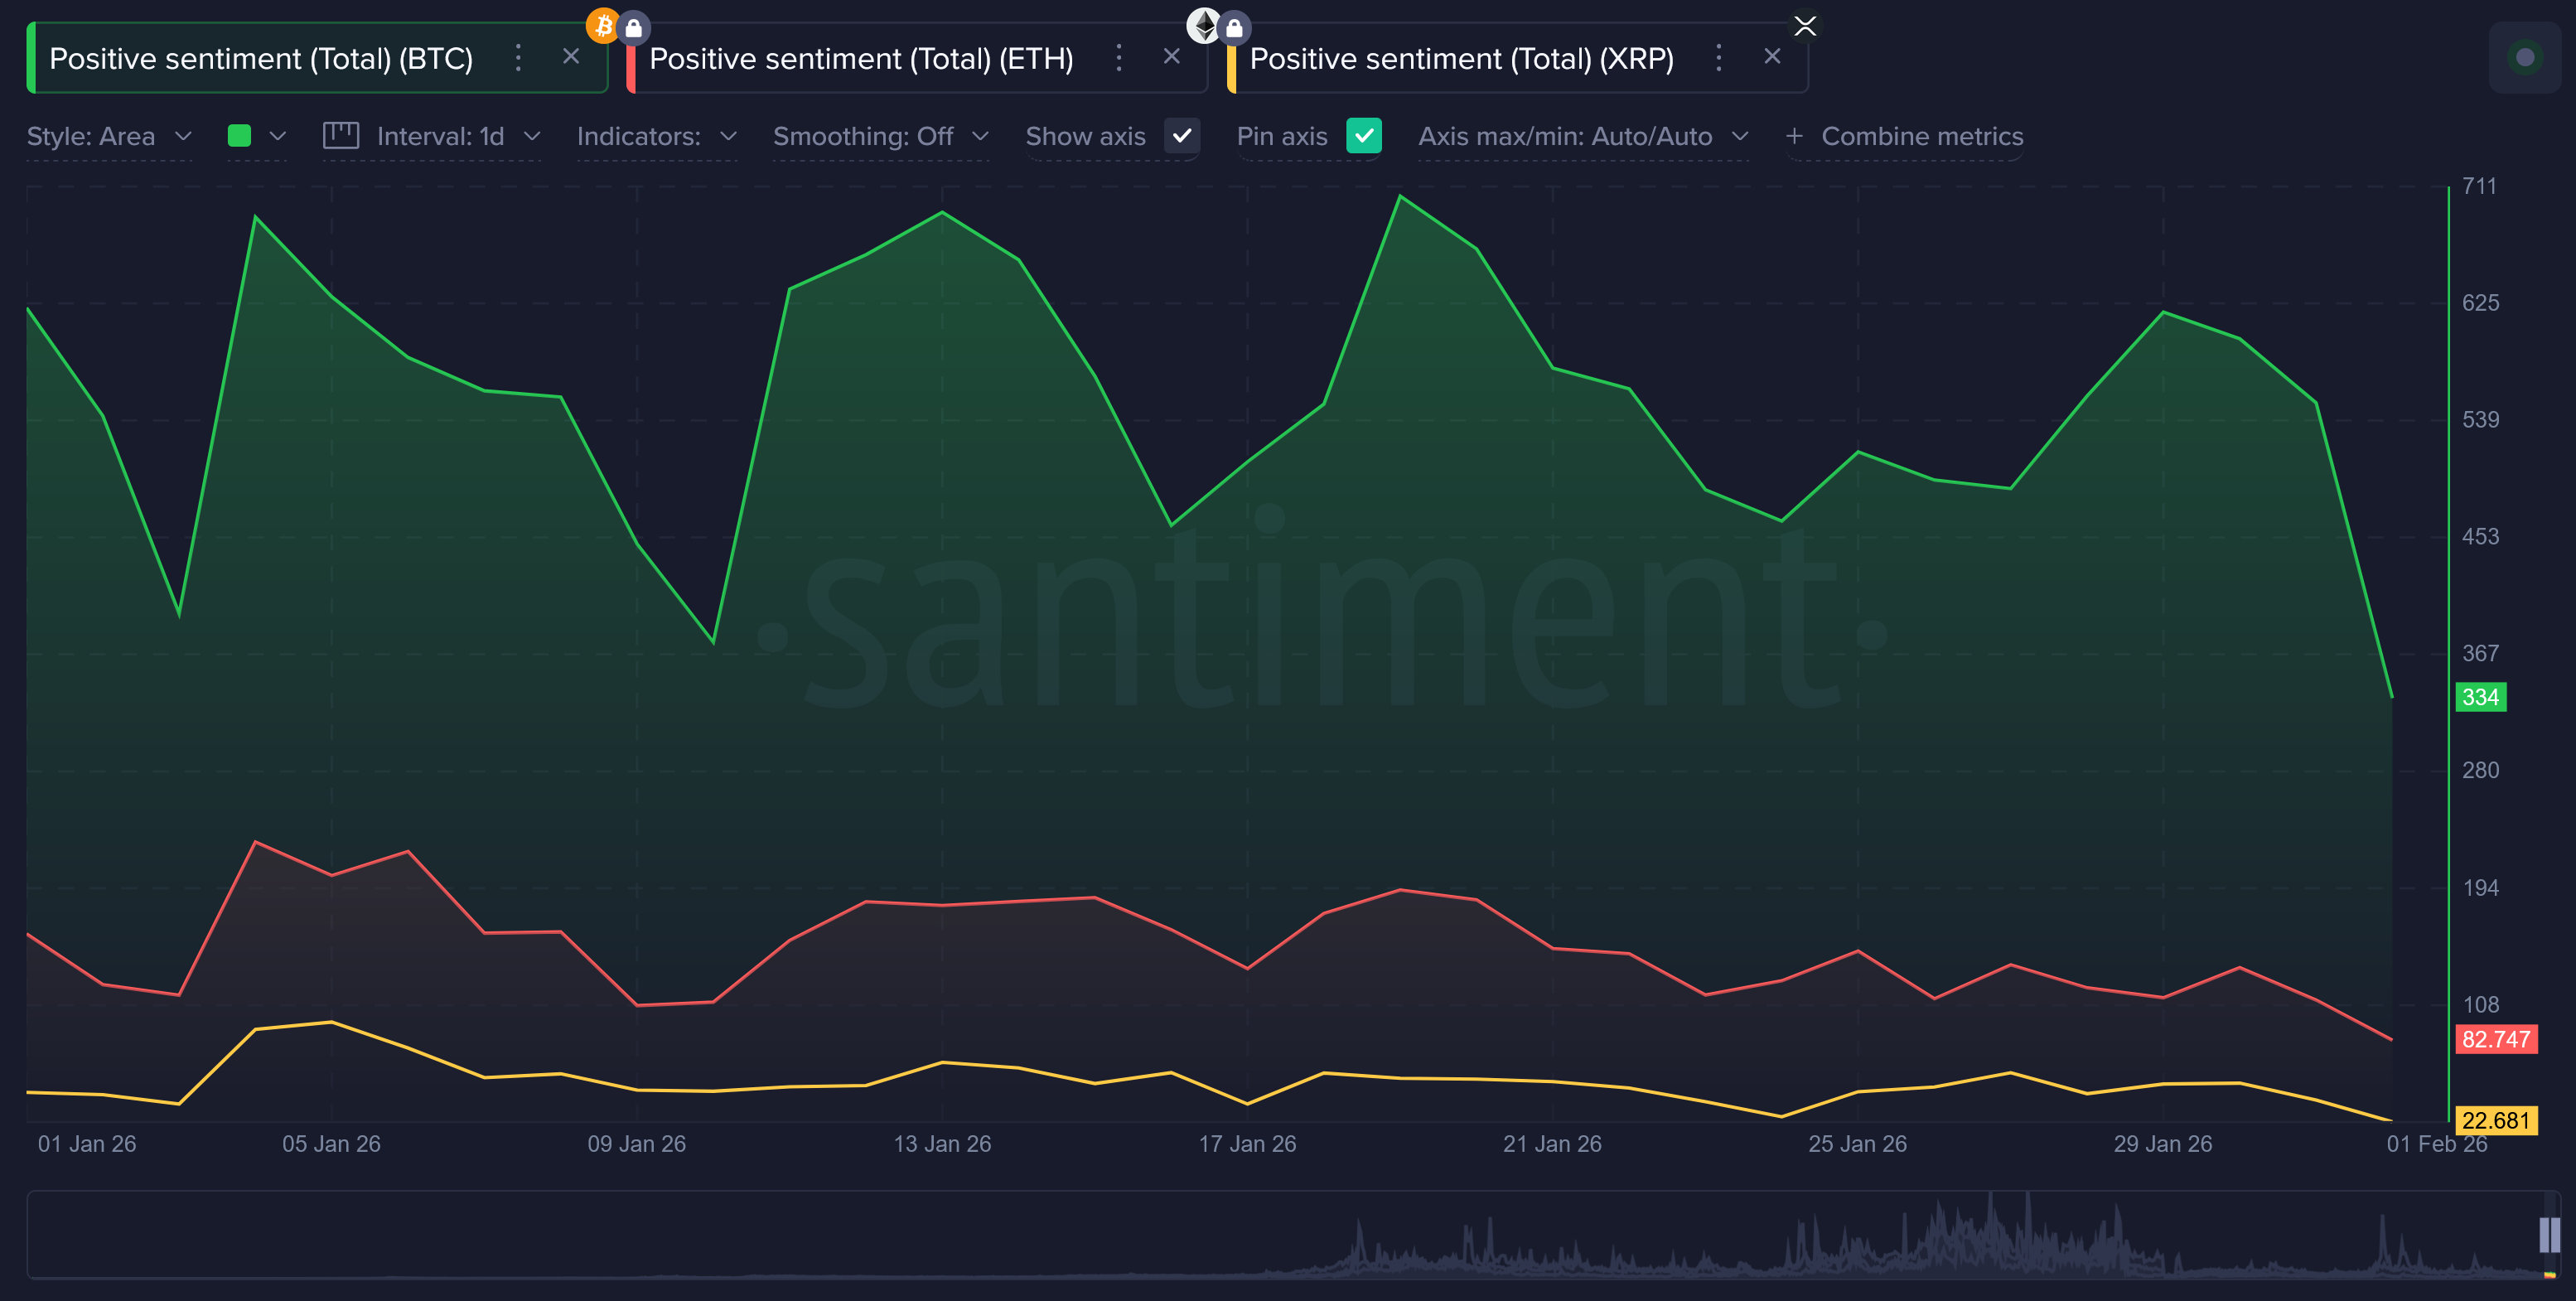
As Bitcoin and altcoins retraced, positive commentary has rapidly shrank. More and more traders have been hopping to other investment opportunities that appear more appealing to them, such as gold and silver. Each lower high in price has been met with reduced enthusiasm, and by late January, bearish narratives clearly dominated online discussion. This alignment between falling prices and weakening sentiment reflects how reactive social commentary often is during periods of uncertainty.
It’s hard to believe it’s been just under four months since Bitcoin’s $126K all-time high was being celebrated across public social media and private messaging groups. Now, traders are suddenly being met with potentially the most adversity (-39% for Bitcoin since that all-time high) that they’ve felt since the bloodbath of 2022. While not a guarantee, the increasing presumption of a bear market by retail decreases the likelihood of a bear market actually occurring. We explore several of Santiment’s top metrics and signals to get an idea of where we stand after the disappointing first month of 2026.
Bitcoin Social Sentiment Collapse
The sharp decline in Bitcoin’s sentiment ratio was one of January’s most jarring signals we’ve seen. When bearish commentary outweighs bullish discussion, it often reflects panic selling, loss of confidence, and emotional decision-making. The January 29th dip coincided with just an 0.86 ratio of bullish comments compared to bearish markets. The vast majority of the time, social media skews more bullish and there is a regular high level of bullish calls compared to bearish. But during the rare moments when the bullish crowd is statistically being outnumbered by the bearish crowd, it marks a potential turning point that is much needed for prices to reverse.
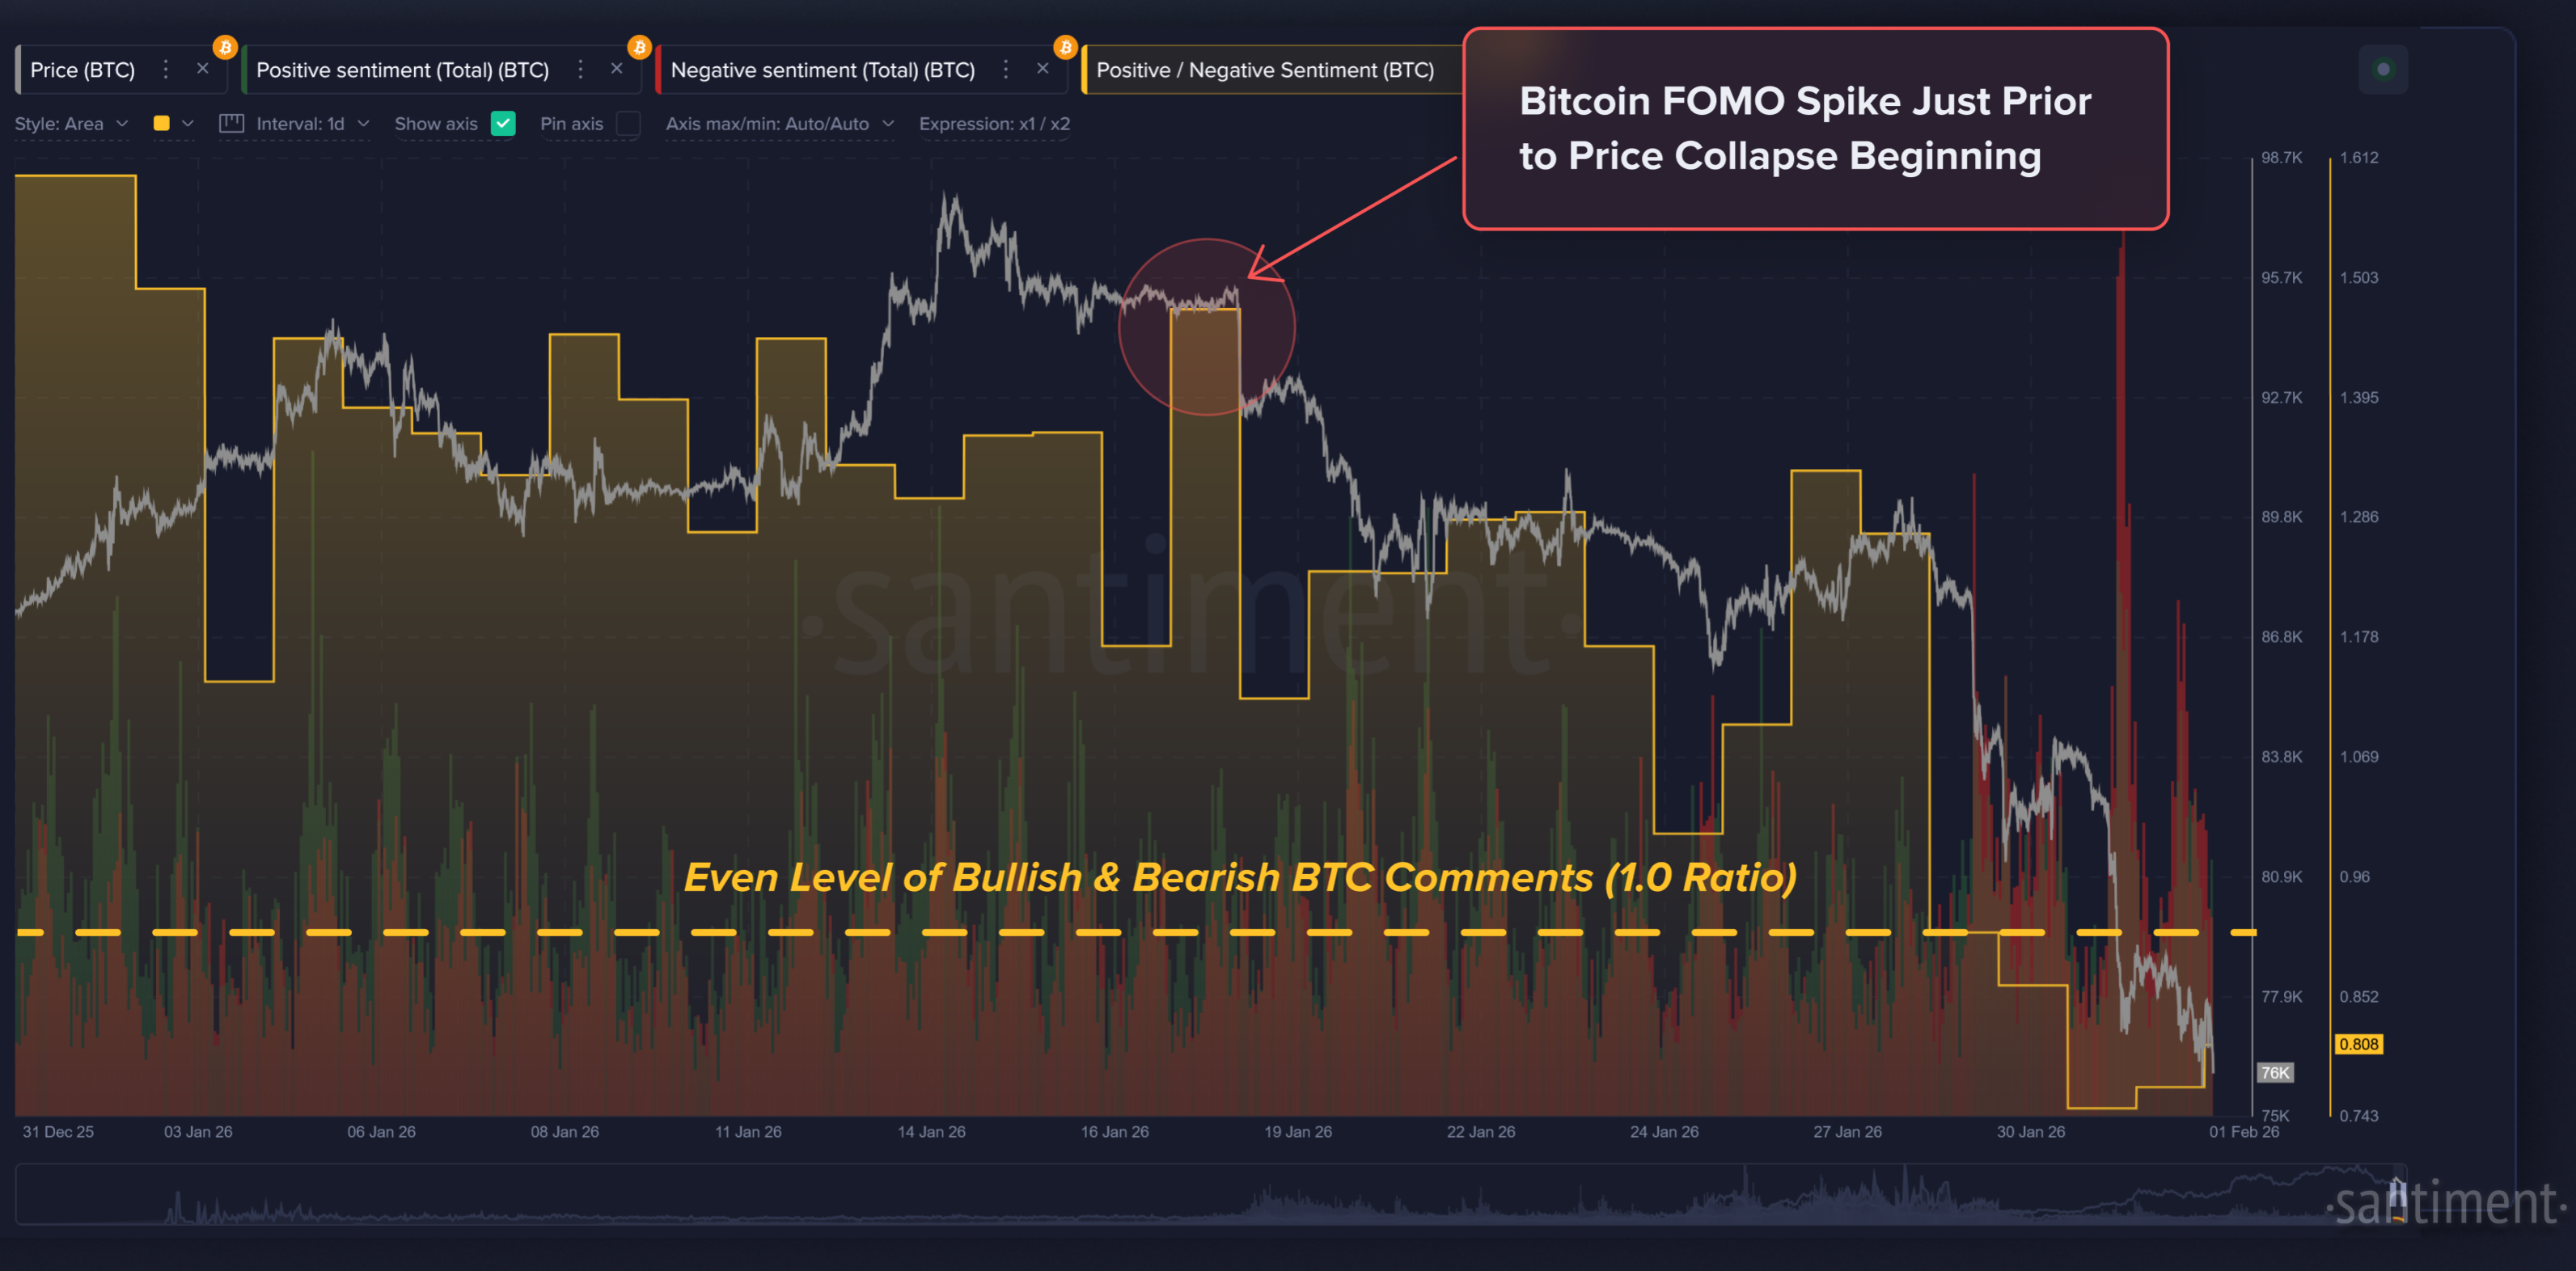
As we can see, the final three days of January (and even the start of February) have all seen extreme bearishness coming from the crowd. It’s also fascinating to see how linearly the ratio of positive vs. negative comments gradually fell throughout the month. Markets rarely bottom when optimism is high. Instead, turning points often form when sentiment is overwhelmingly negative. While sentiment alone should never be used as a trading signal, extreme fear has historically aligned with short-term stabilization or bounce attempts.
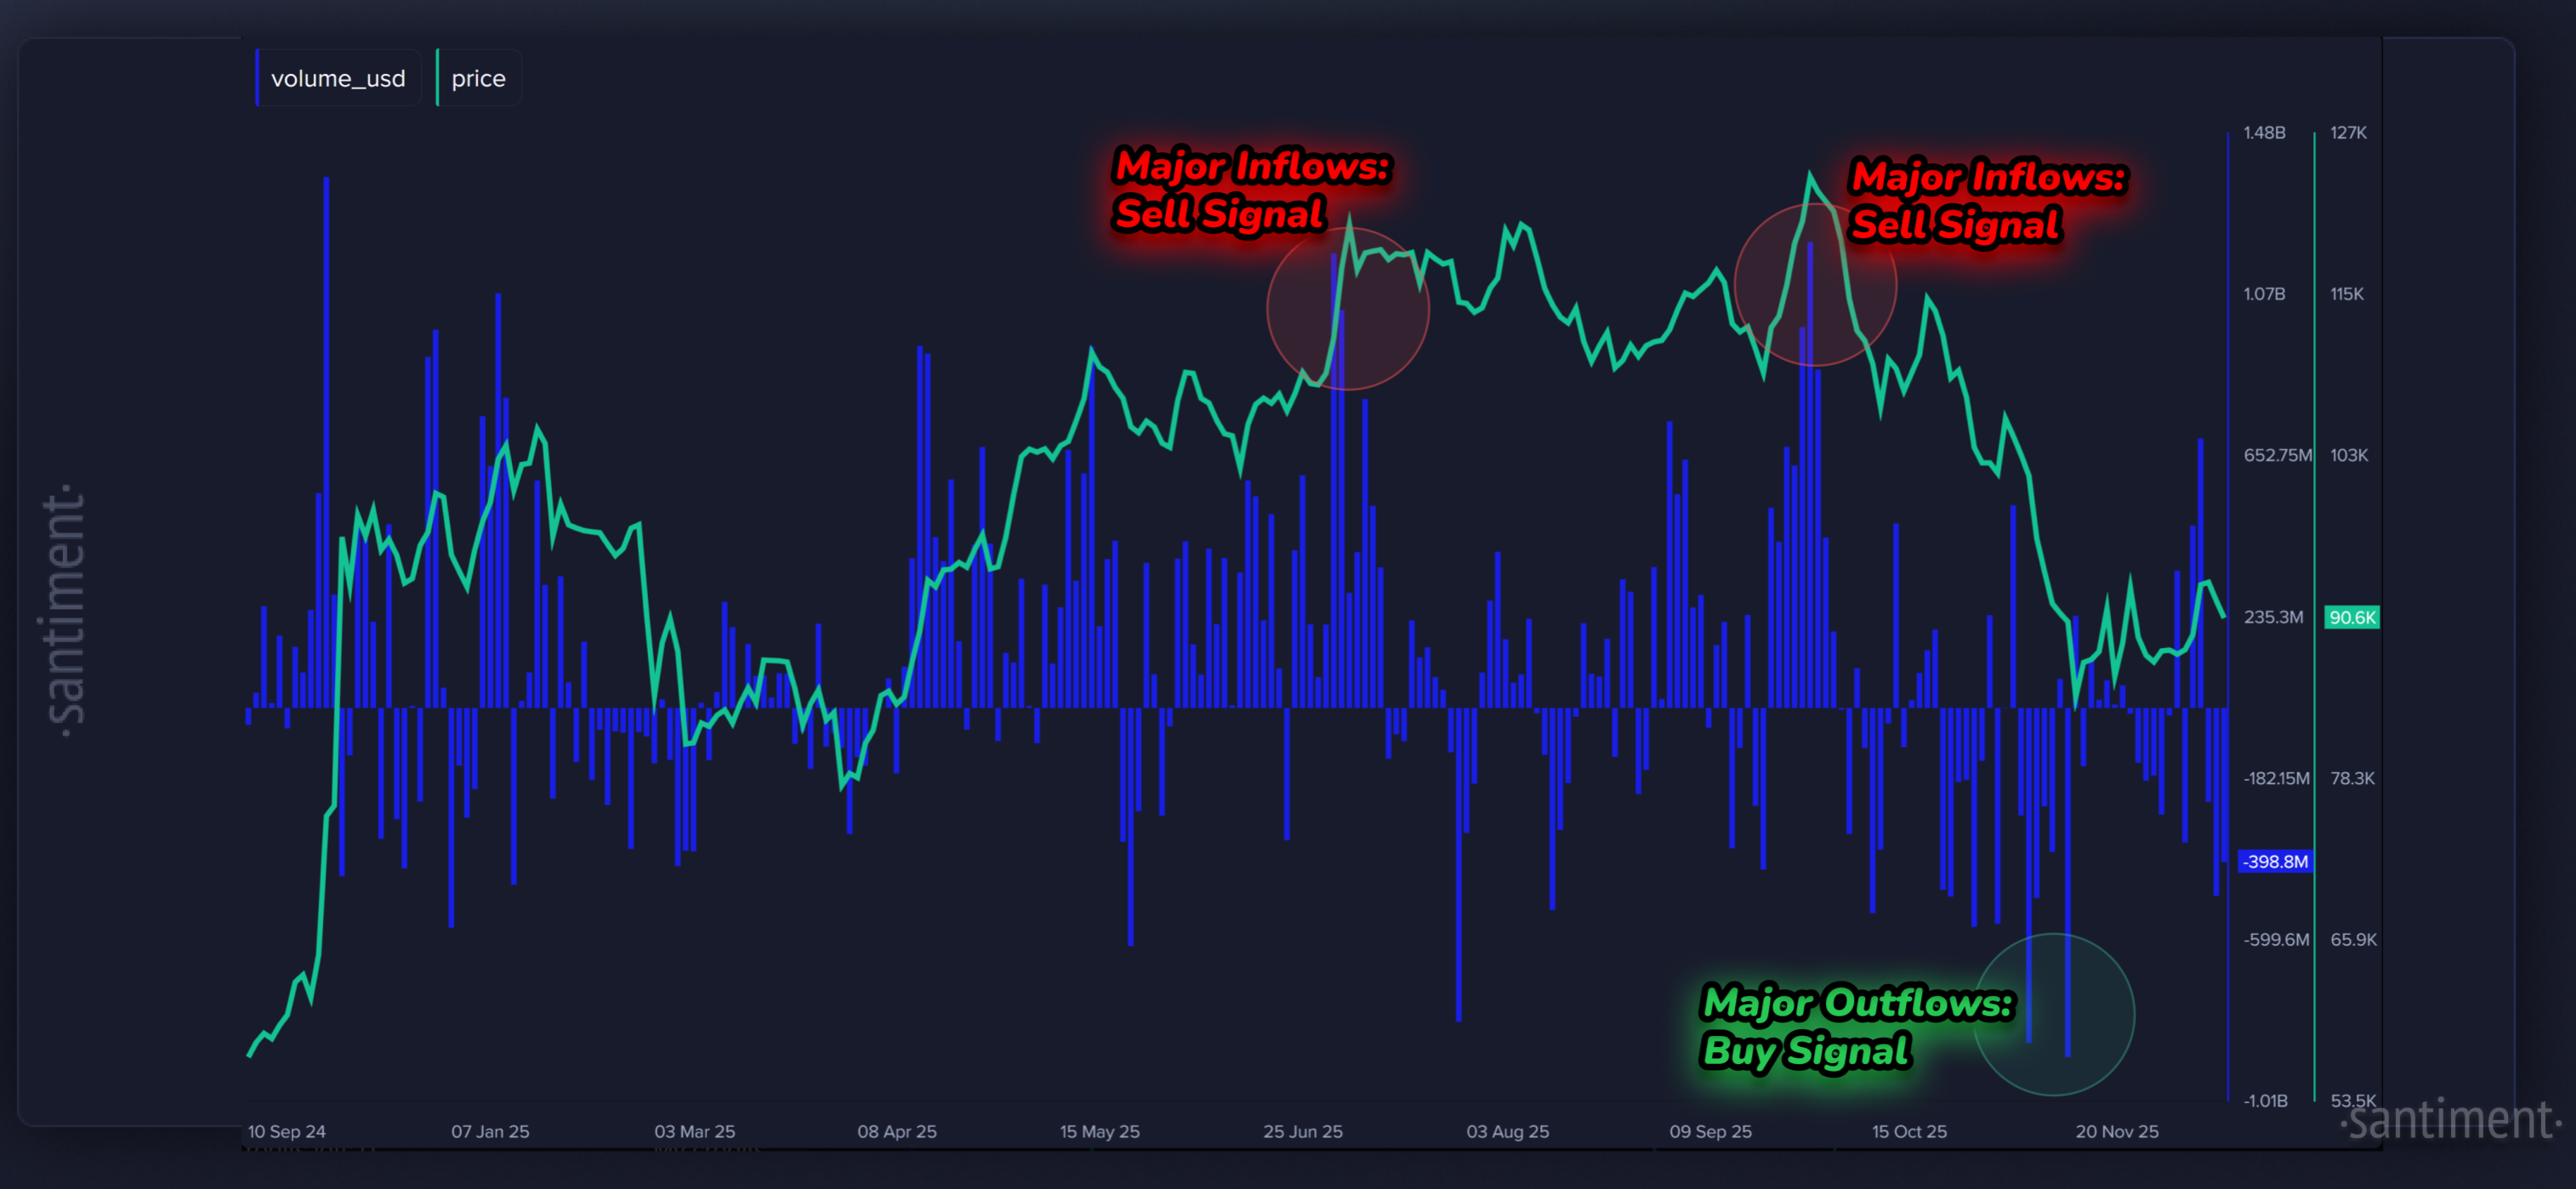
Smart Money Not Pouncing On Discounted Prices
The other helpful way to measure how retail truly is reacting to Bitcoin’s price swings is by looking at how the actual percentage of supply is fluctuating in wallets with less than 0.01 BTC. This is essentially a way of looking at whether the small traders are truly putting their money where their mouth is. And currently, the small retail money (represented by the red line below) has actually been increasing their supply while key stakeholders with 10 to 10,000 BTC (represented by the green line) are mildly offloading their bags during this dip.
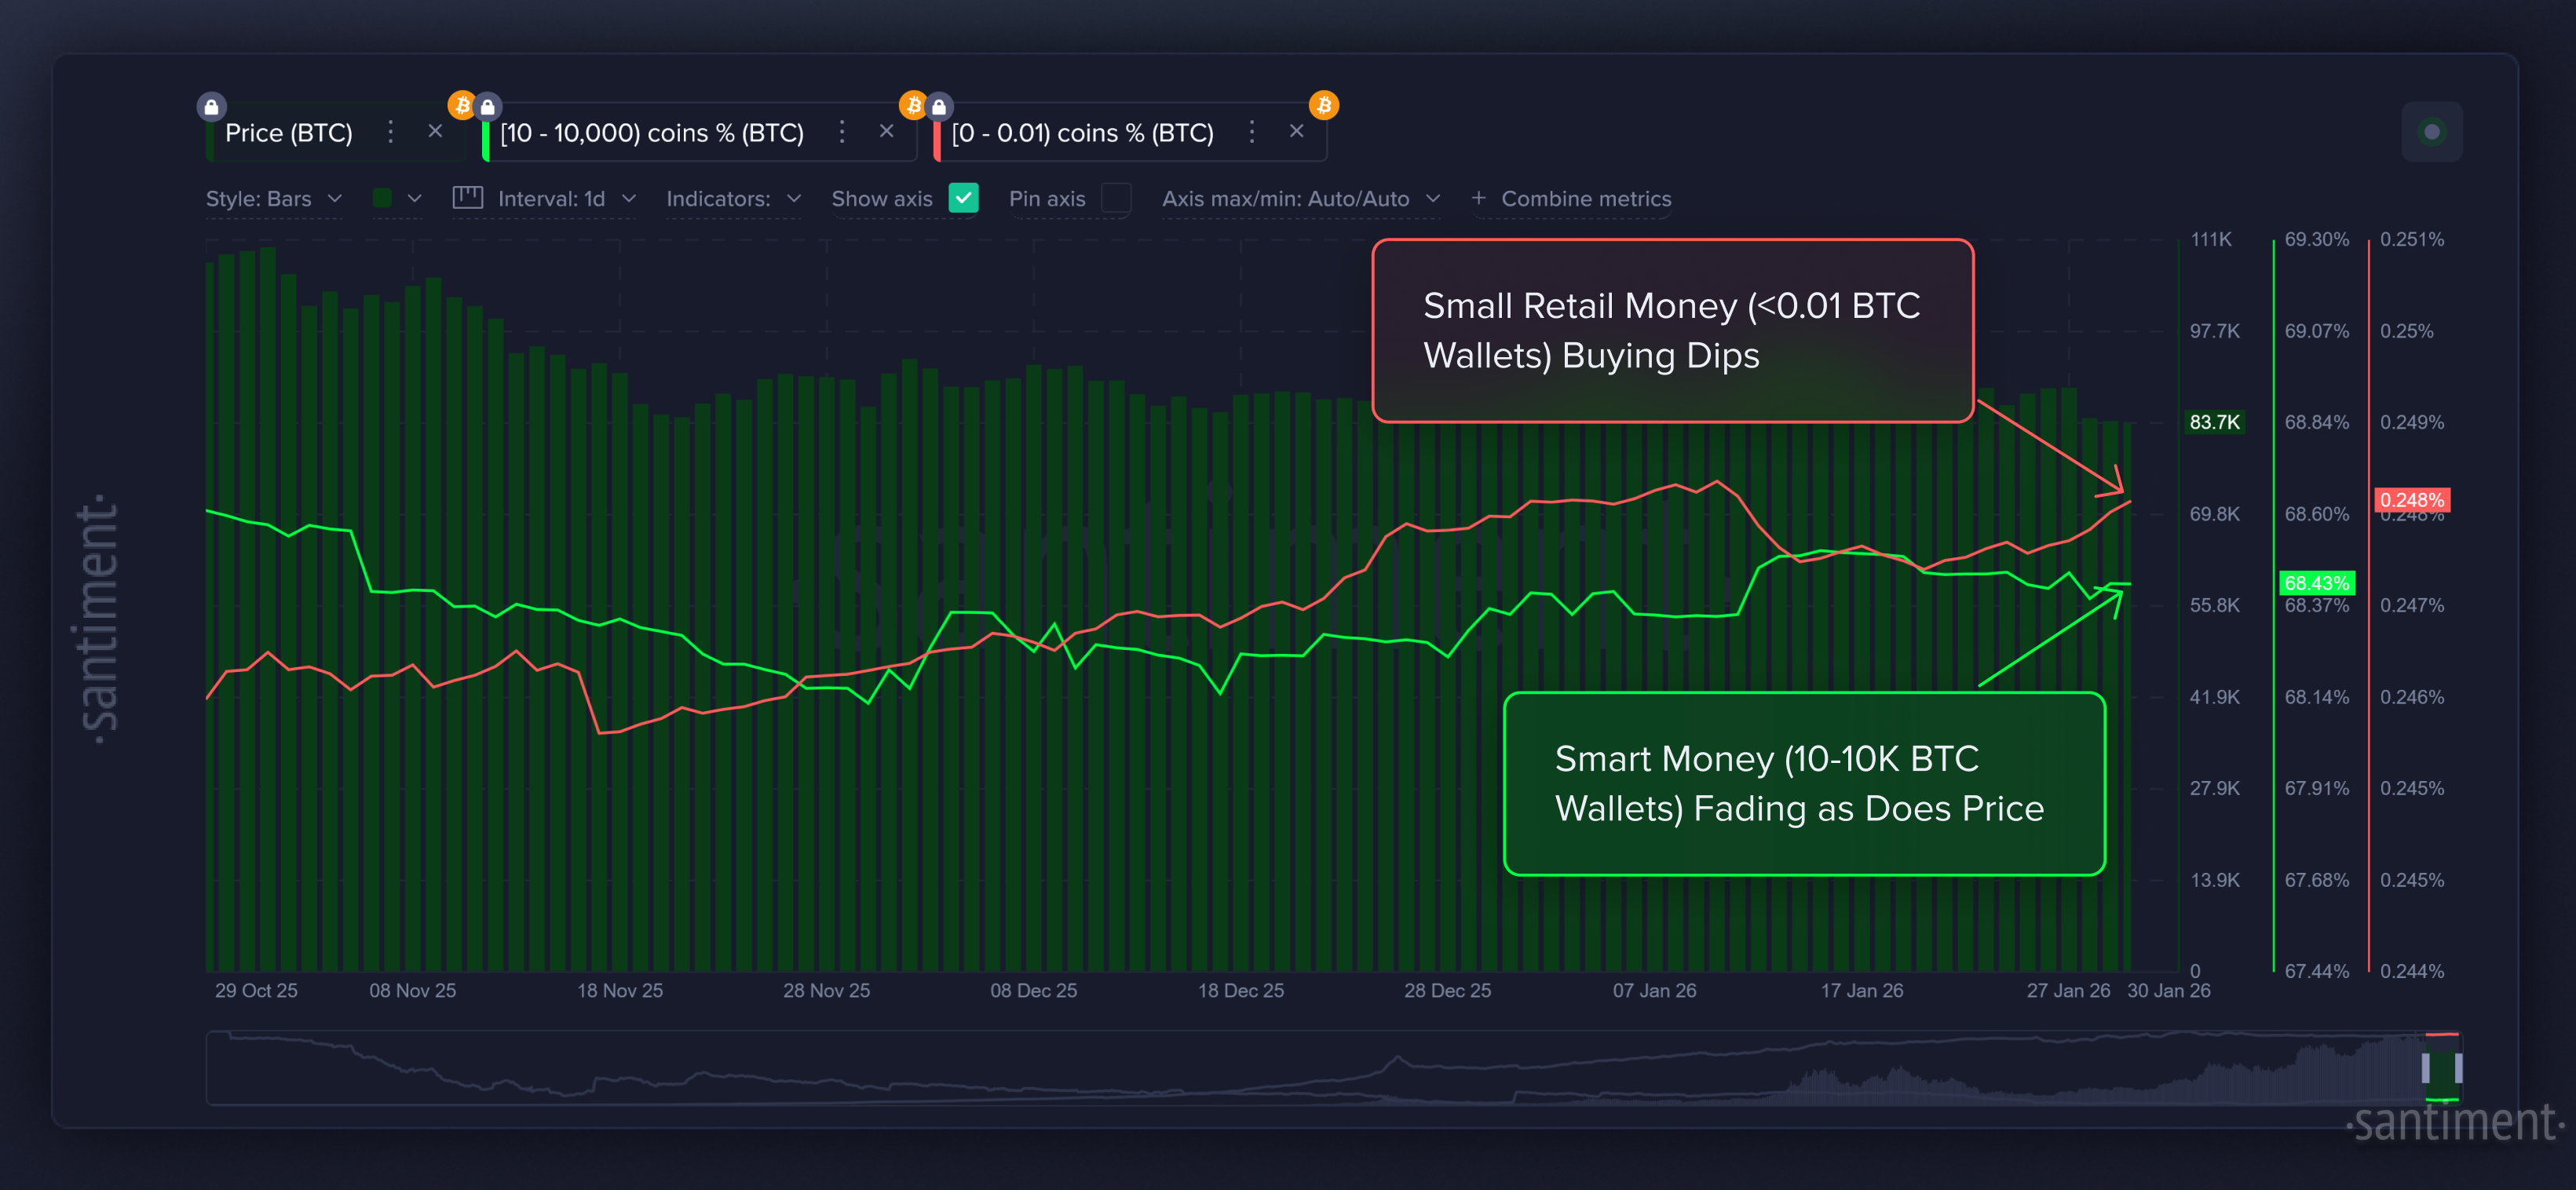
It’s actually quite atypical that the vocal majority of small traders are spamming very bearish comments publicly, yet accumulating BTC collectively behind the scenes. This tells us that there are still many retailers out there who believe that this is “dip buy” time, and are optimistic of an upcoming reversal. Ideally, we need to see small retail moving down, matching with the bearish social outlook that Santiment’s metrics are currently revealing. Until this happens, any market rebound may be limited.
Average Returns Signal There Will Be Some Inevitable Relief
At the same time, the Market Value to Realized Value (MVRV) metrics for Bitcoin paint a short-term encouraging picture. Average returns of traders in the past 30 days are down an average of -15.7% on their investments and trades, while those active in the past 365 days are down -24.2%.
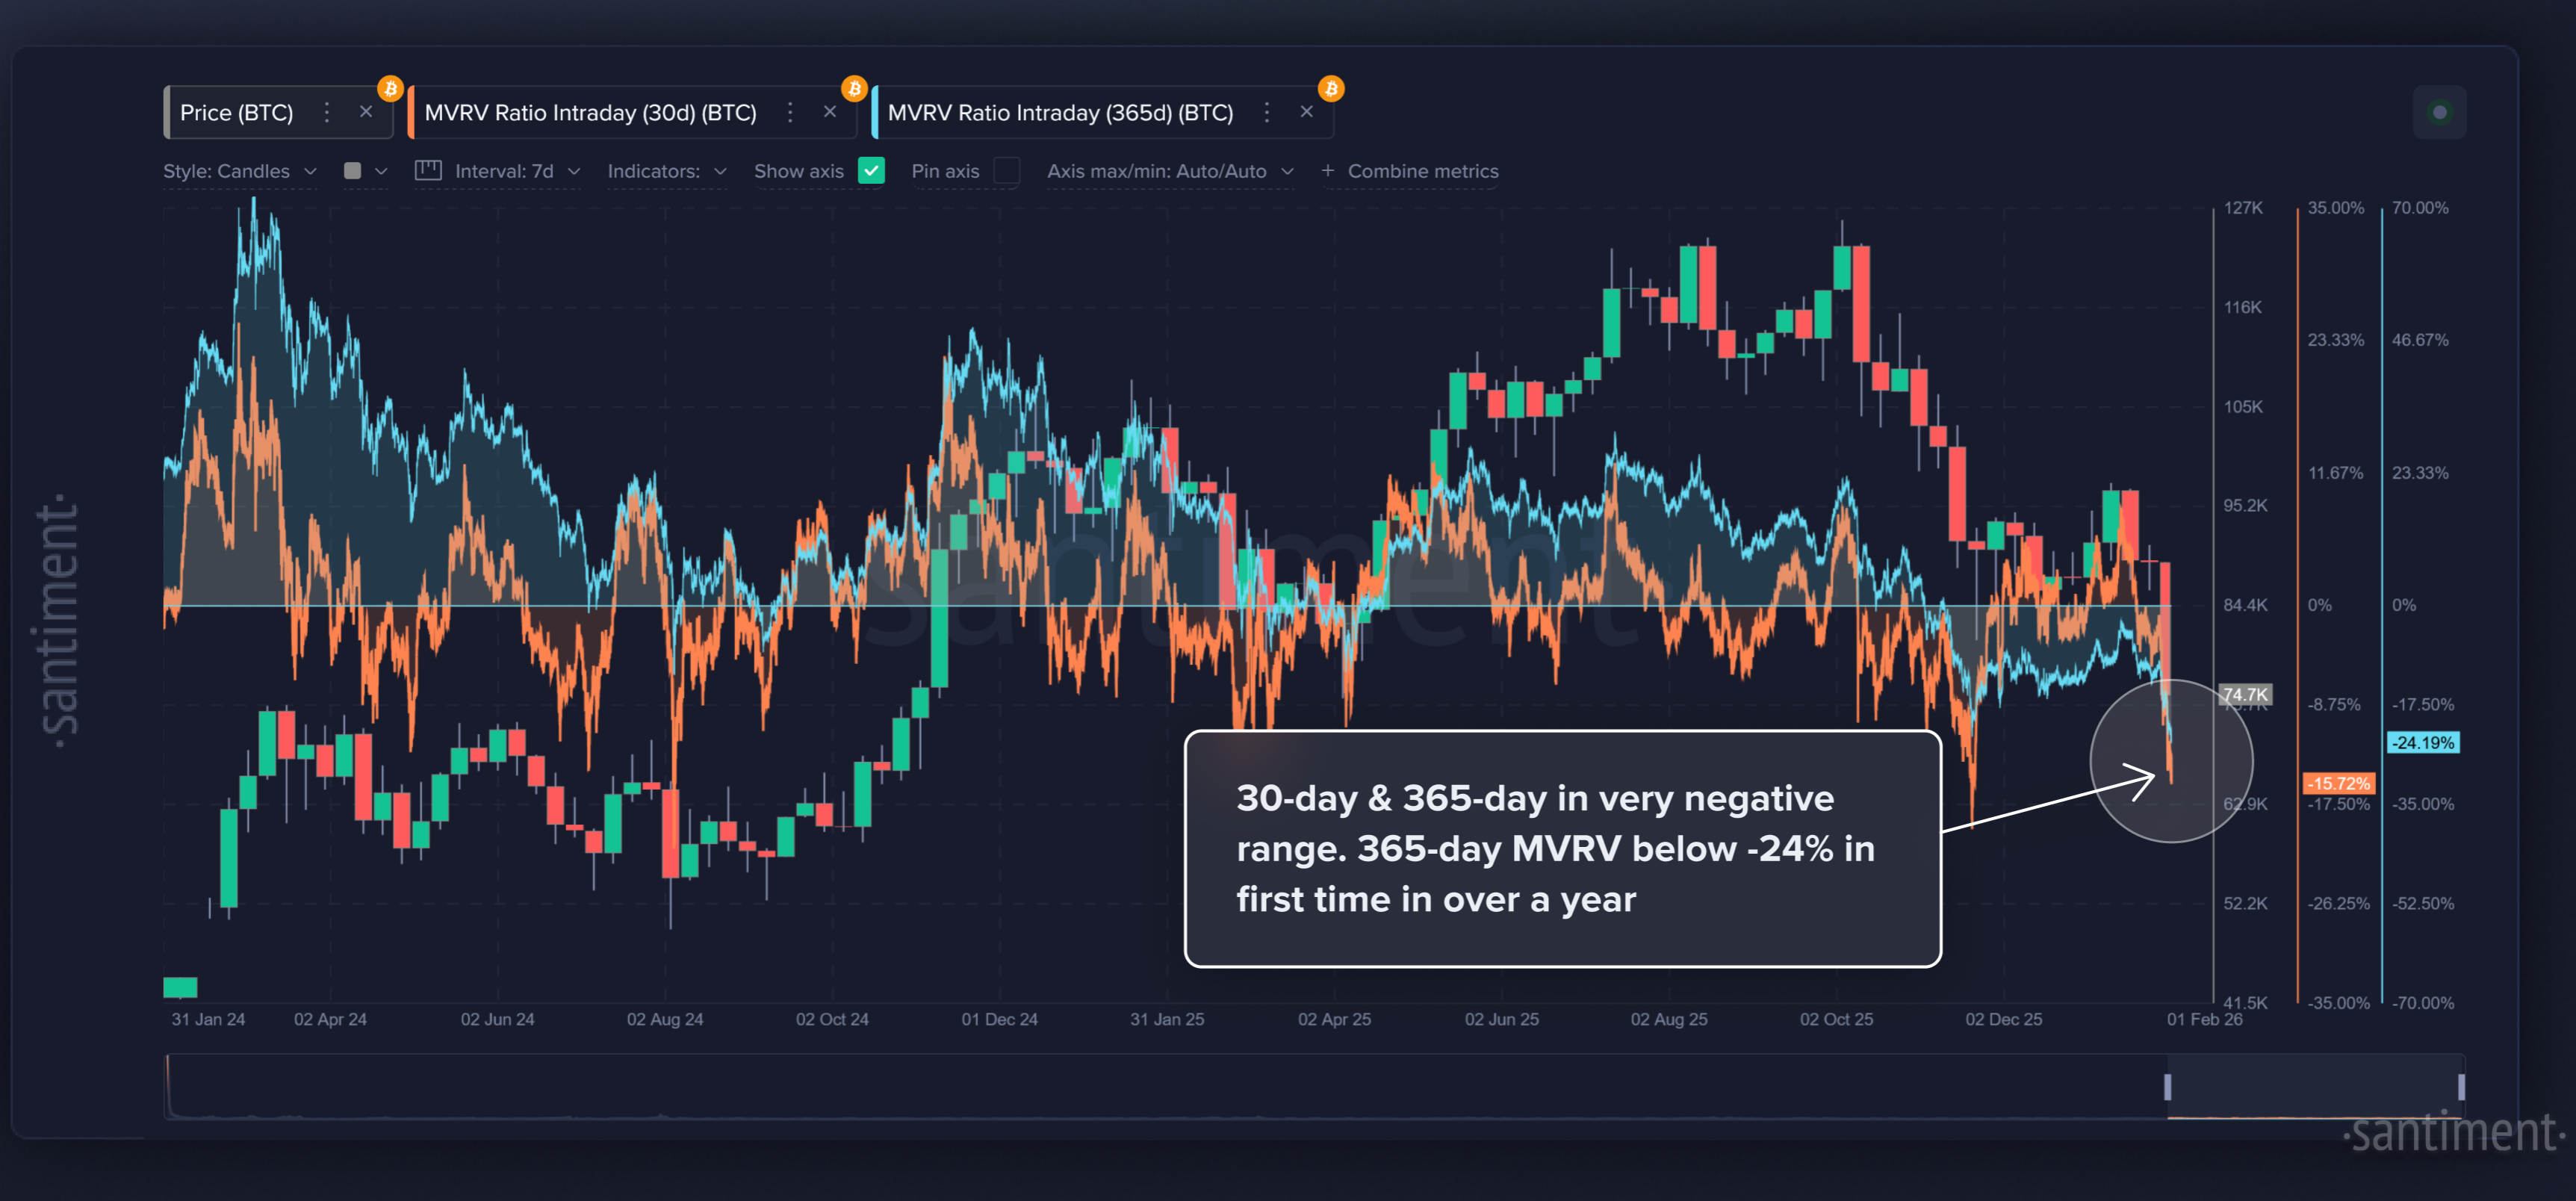
If you’re unfamiliar with how this metric works, MVRV is essentially measuring how much profit or loss the average holder of a coin is sitting on compared to when they bought. When the 30-day MVRV is negative, it means most recent buyers are down money, which historically signals lower risk and a better opportunity to enter because selling pressure is already exhausted. When the MVRV is strongly positive, it means traders are sitting in profit, which increases the risk of pullbacks as people are more tempted to take gains. In simple terms, negative MVRV suggests safer entry zones, while high positive MVRV suggests caution.
Stablecoin Supply Returns to Exchanges
Reinforcing the idea of capital hesitation, the total supply of major stablecoins rose during the final third of January. Stablecoins are often used as on-chain cash, so rising supply typically means money is reentering the crypto ecosystem for the purpose of being deployed, rather than sitting stagnantly in cold wallets. The below chart is actually measuring the average supply on exchanges of the 10 largest exchanges, so they are equally weighted to emphasize the importance of the influx of larger stablecoins (like Tether) moving to exchanges, or smaller ones (like First Digital USD).
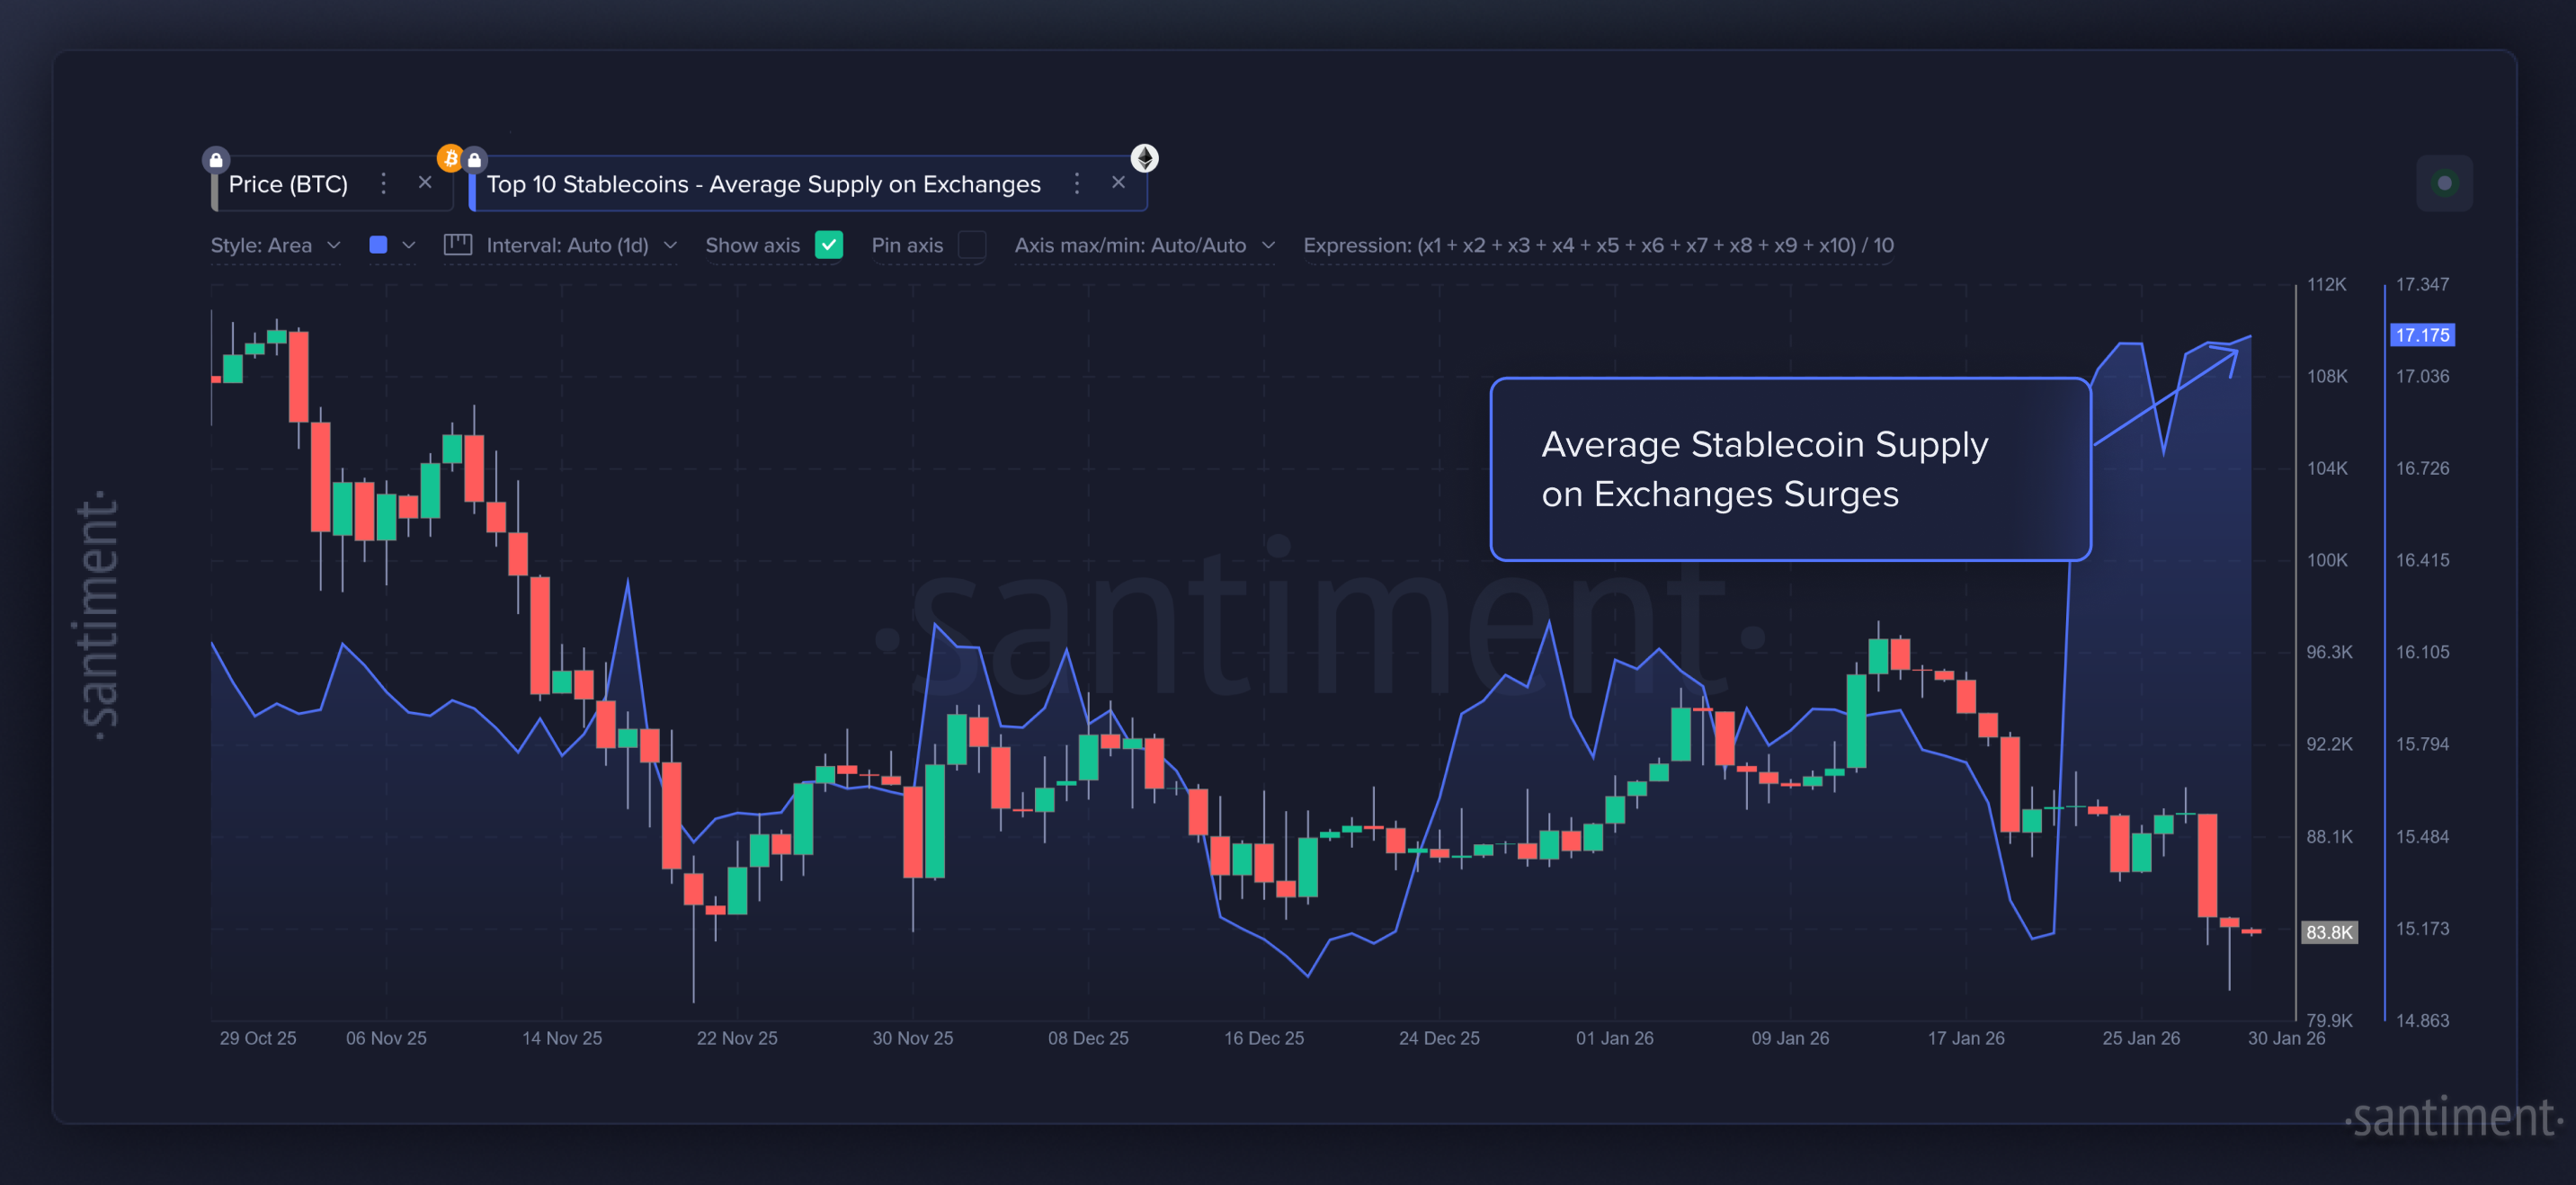
This ascension of stablecoins moving to exchanges suggests that traders are preparing dry powder rather than fully committing to risk just yet. Historically, spikes in exchange stablecoin balances often precede increased volatility, because capital is positioned and ready to rotate into Bitcoin or altcoins once confidence (essentially from larger traders, not smaller ones) improves. In other words, the liquidity is present among key stakeholders, but sentiment is cautious. This available stablecoin funding creates an environment where sharp moves can happen once a narrative or catalyst breaks the stalemate or decline in market movements.
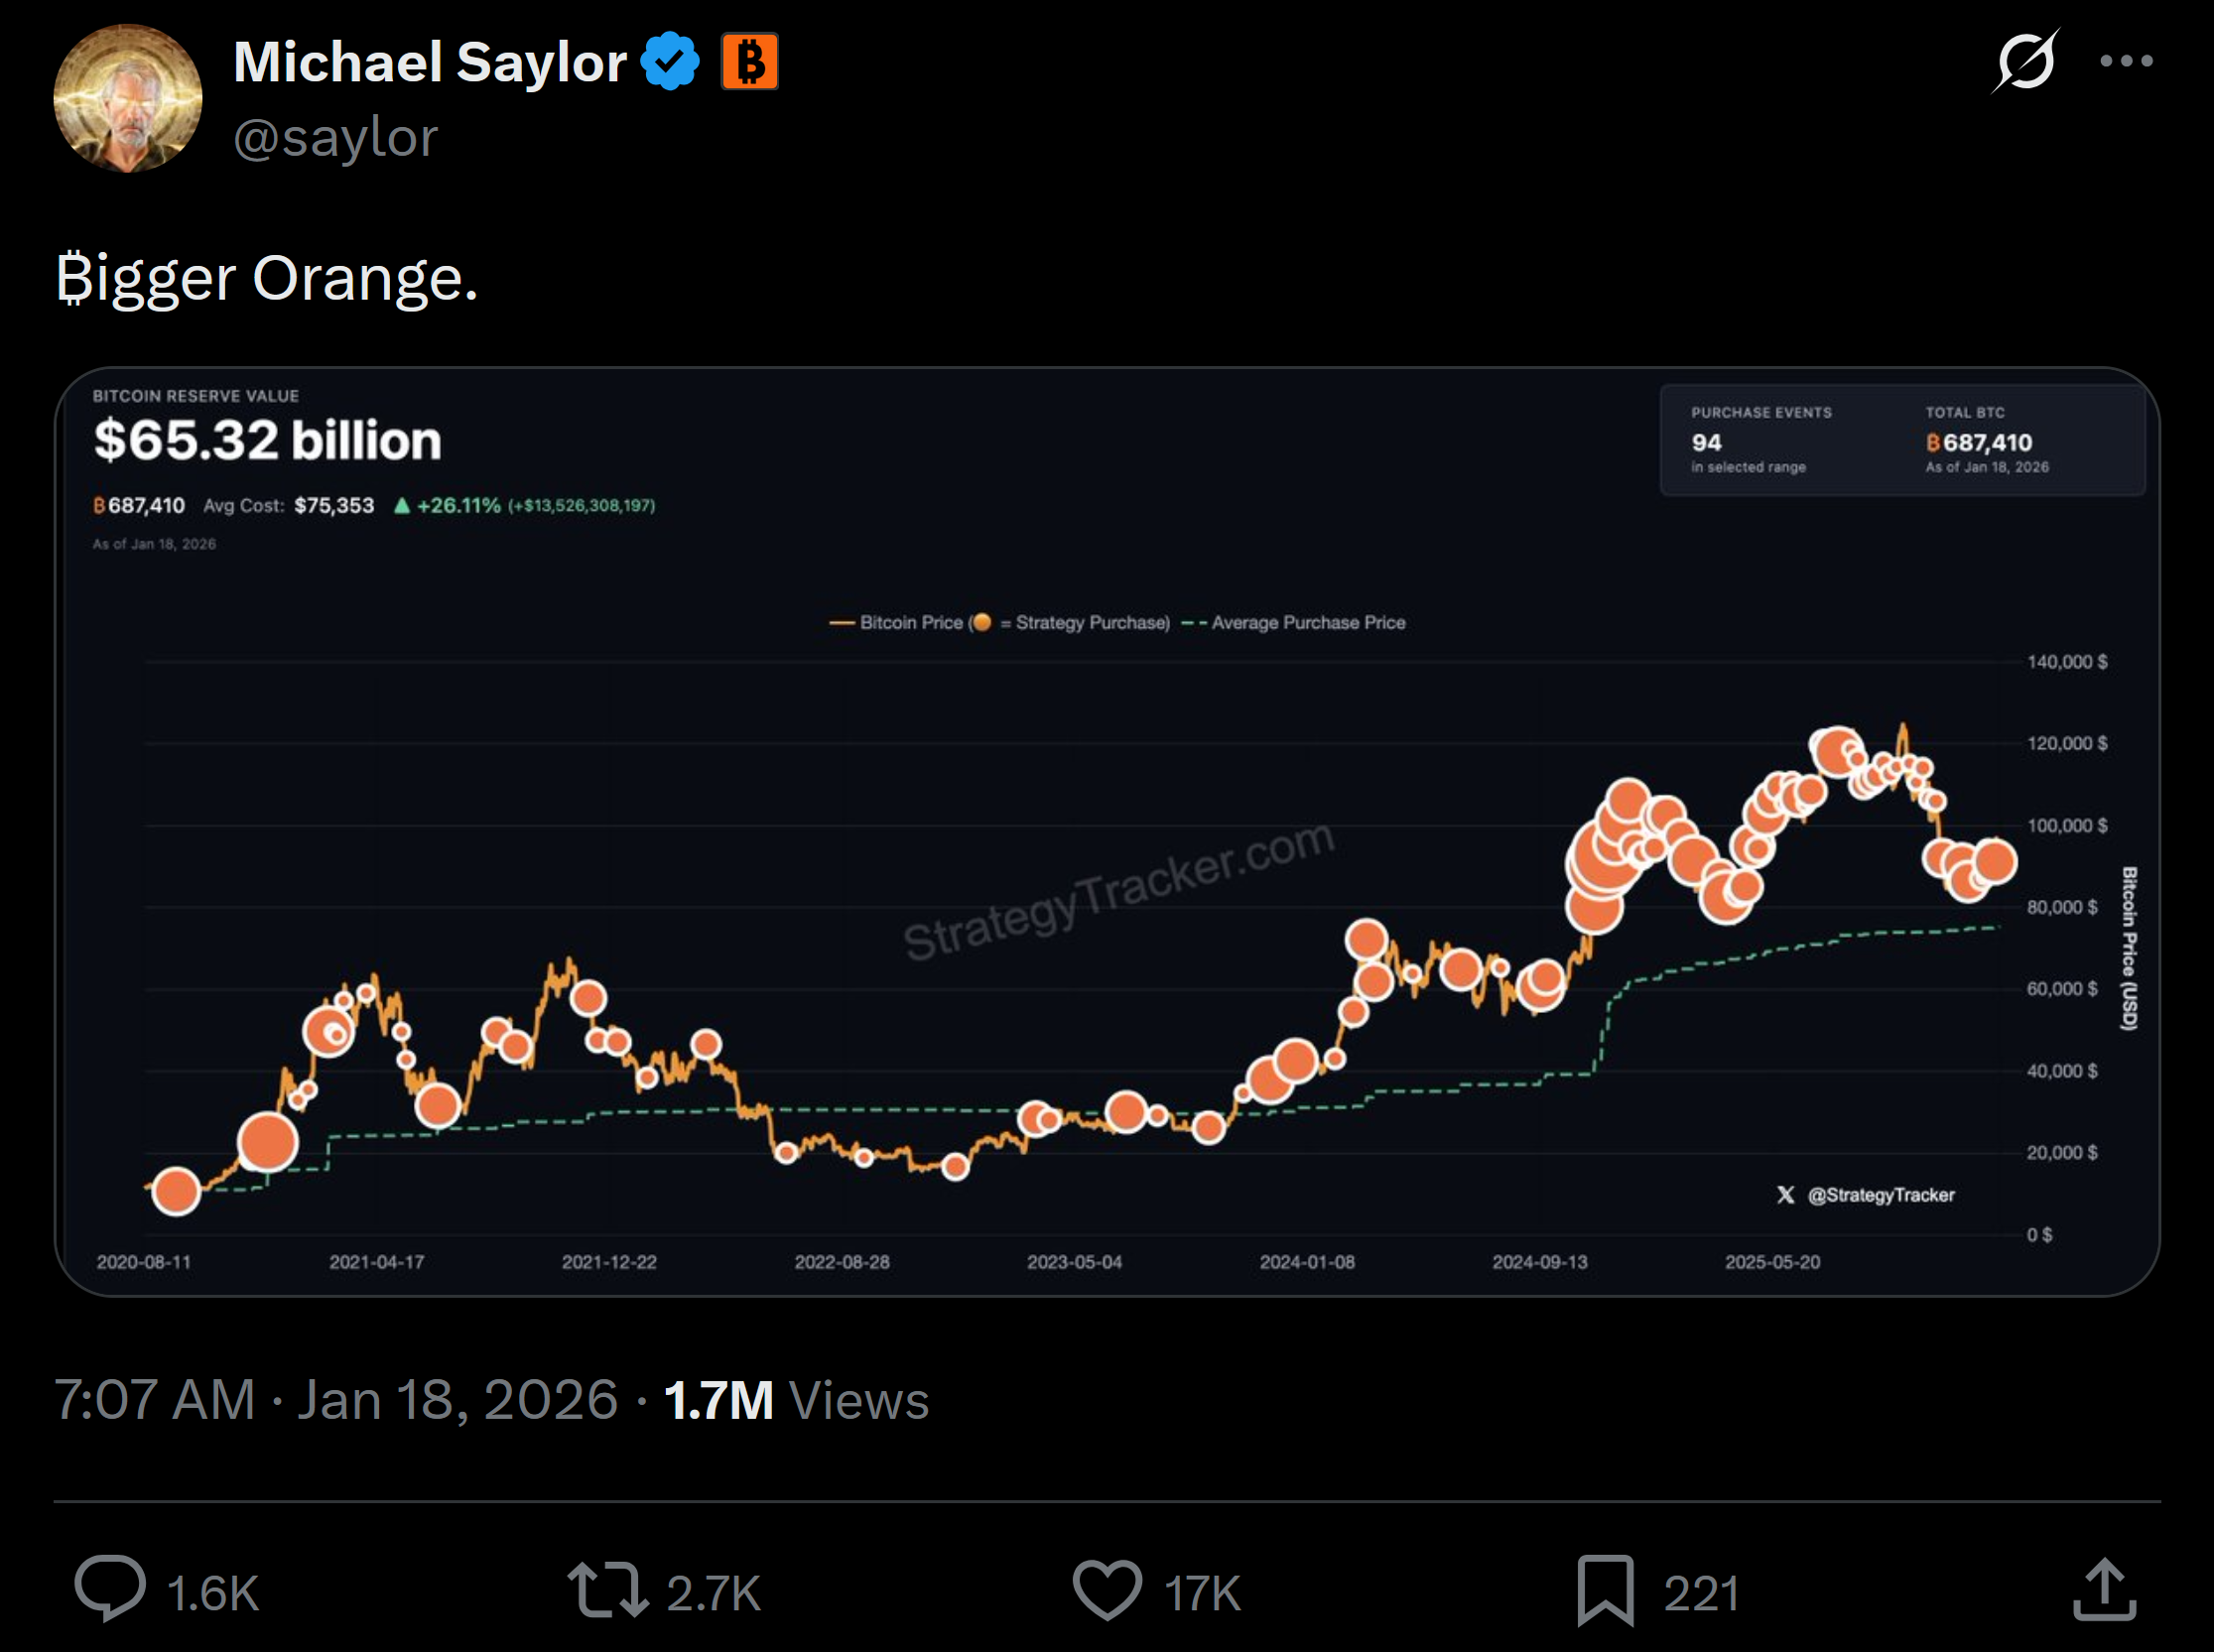
Saylor Resumes Aggressive Bitcoin Accumulation
Against a backdrop of weakening sentiment and cautious capital flows, corporate Bitcoin accumulation stood out. Michael Saylor resumed aggressive buying in mid to late January after a brief slowdown around the start of the New Year. Most of the capital came from selling MicroStrategy (MSTR) shares, with roughly 10–15% raised through STRC, which continued to trade near or above $100, signaling strong investor demand.
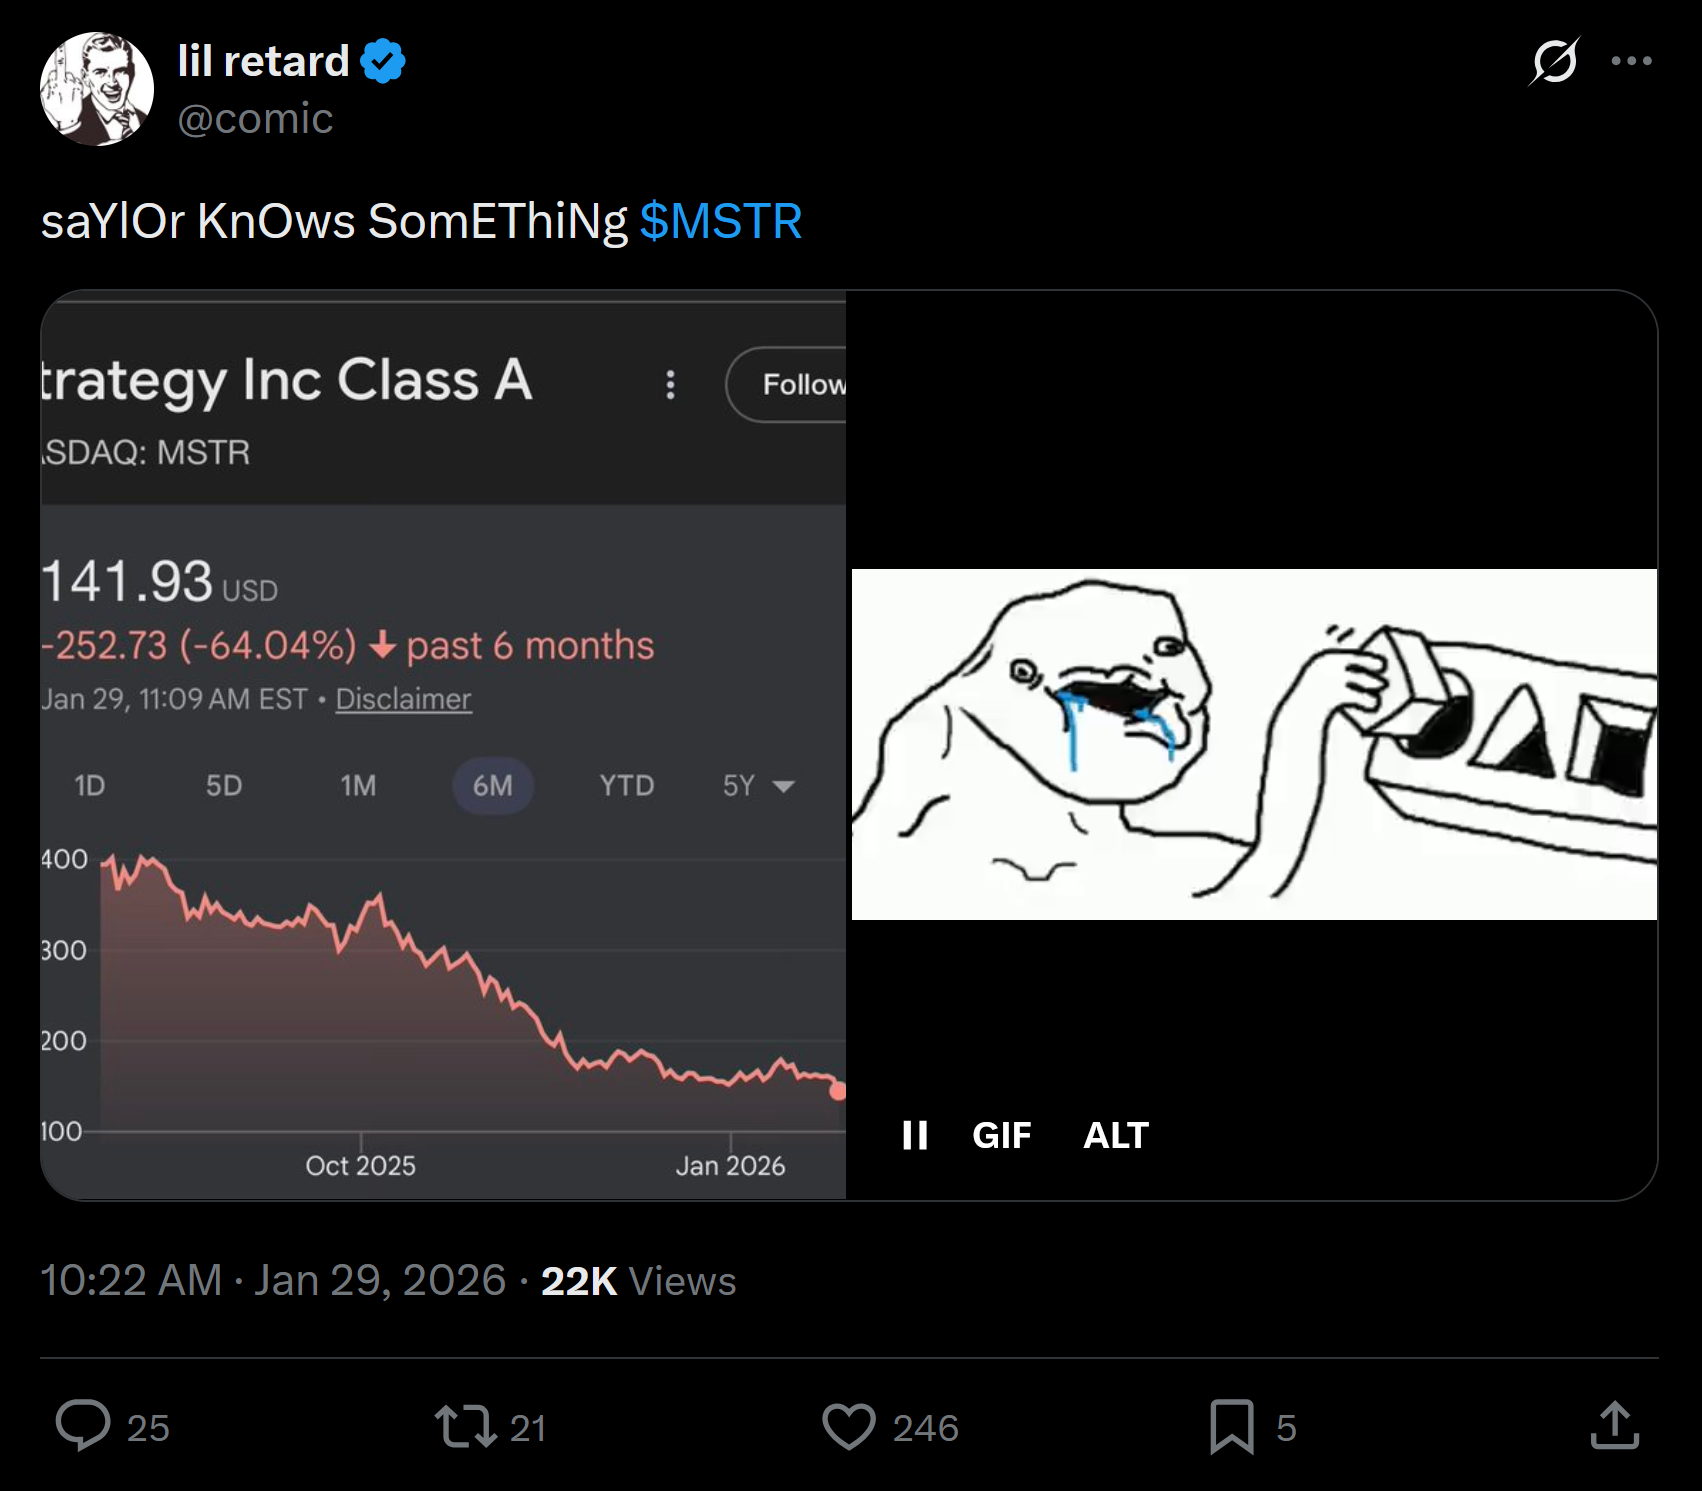
MSTR itself has dropped by more than -64%, and traders can’t help but create content mocking the many followers that still believe in the company, and Saylor himself.
ETF Inflows Acting as a Counter Signal
January further confirmed that Bitcoin ETF inflows are no longer a straightforward bullish indicator. Large inflow days increasingly aligned with local price tops, while periods of low or negative flows often coincided with short-term bottoms.
This pattern suggests ETF buyers are behaving reactively rather than strategically. Many appear driven by fear of missing out rather than long-term allocation models. As sentiment weakens, ETF flow data should be interpreted carefully, especially by newer market participants.
Gold and Silver Capitulation Theoretically Boosts Bitcoin’s Relative Strength
Late January saw a dramatic sell-off in traditional safe havens, with gold and silver losing over $10 trillion in combined market capitalization within 24 hours. The move followed policy uncertainty and appeared driven by liquidation from overbought conditions.
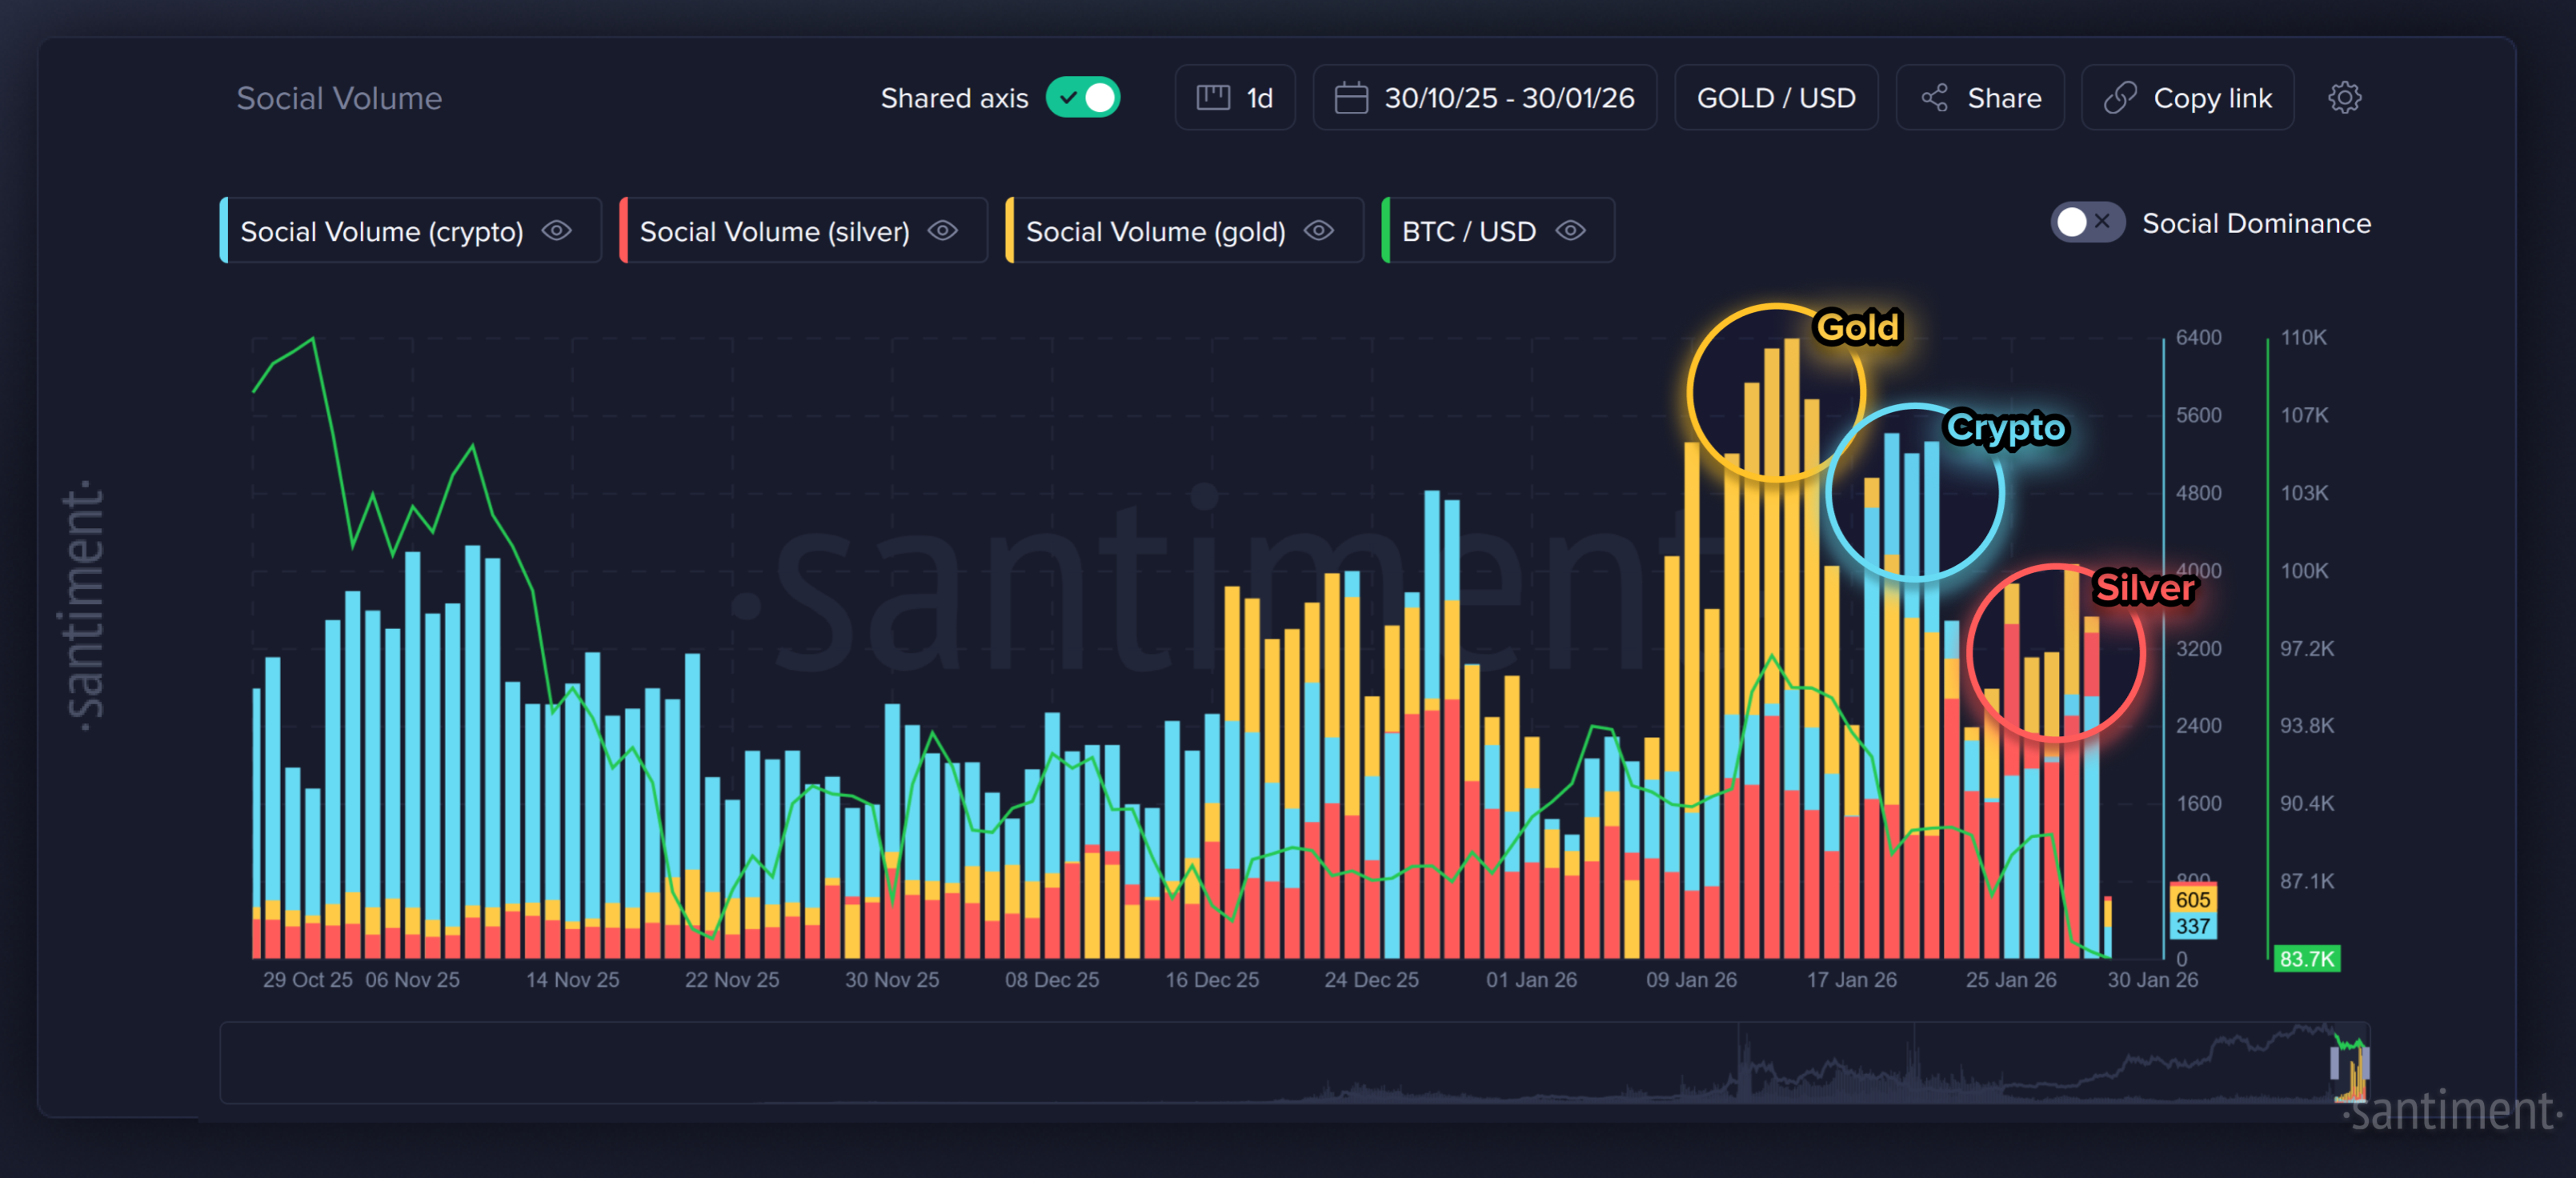
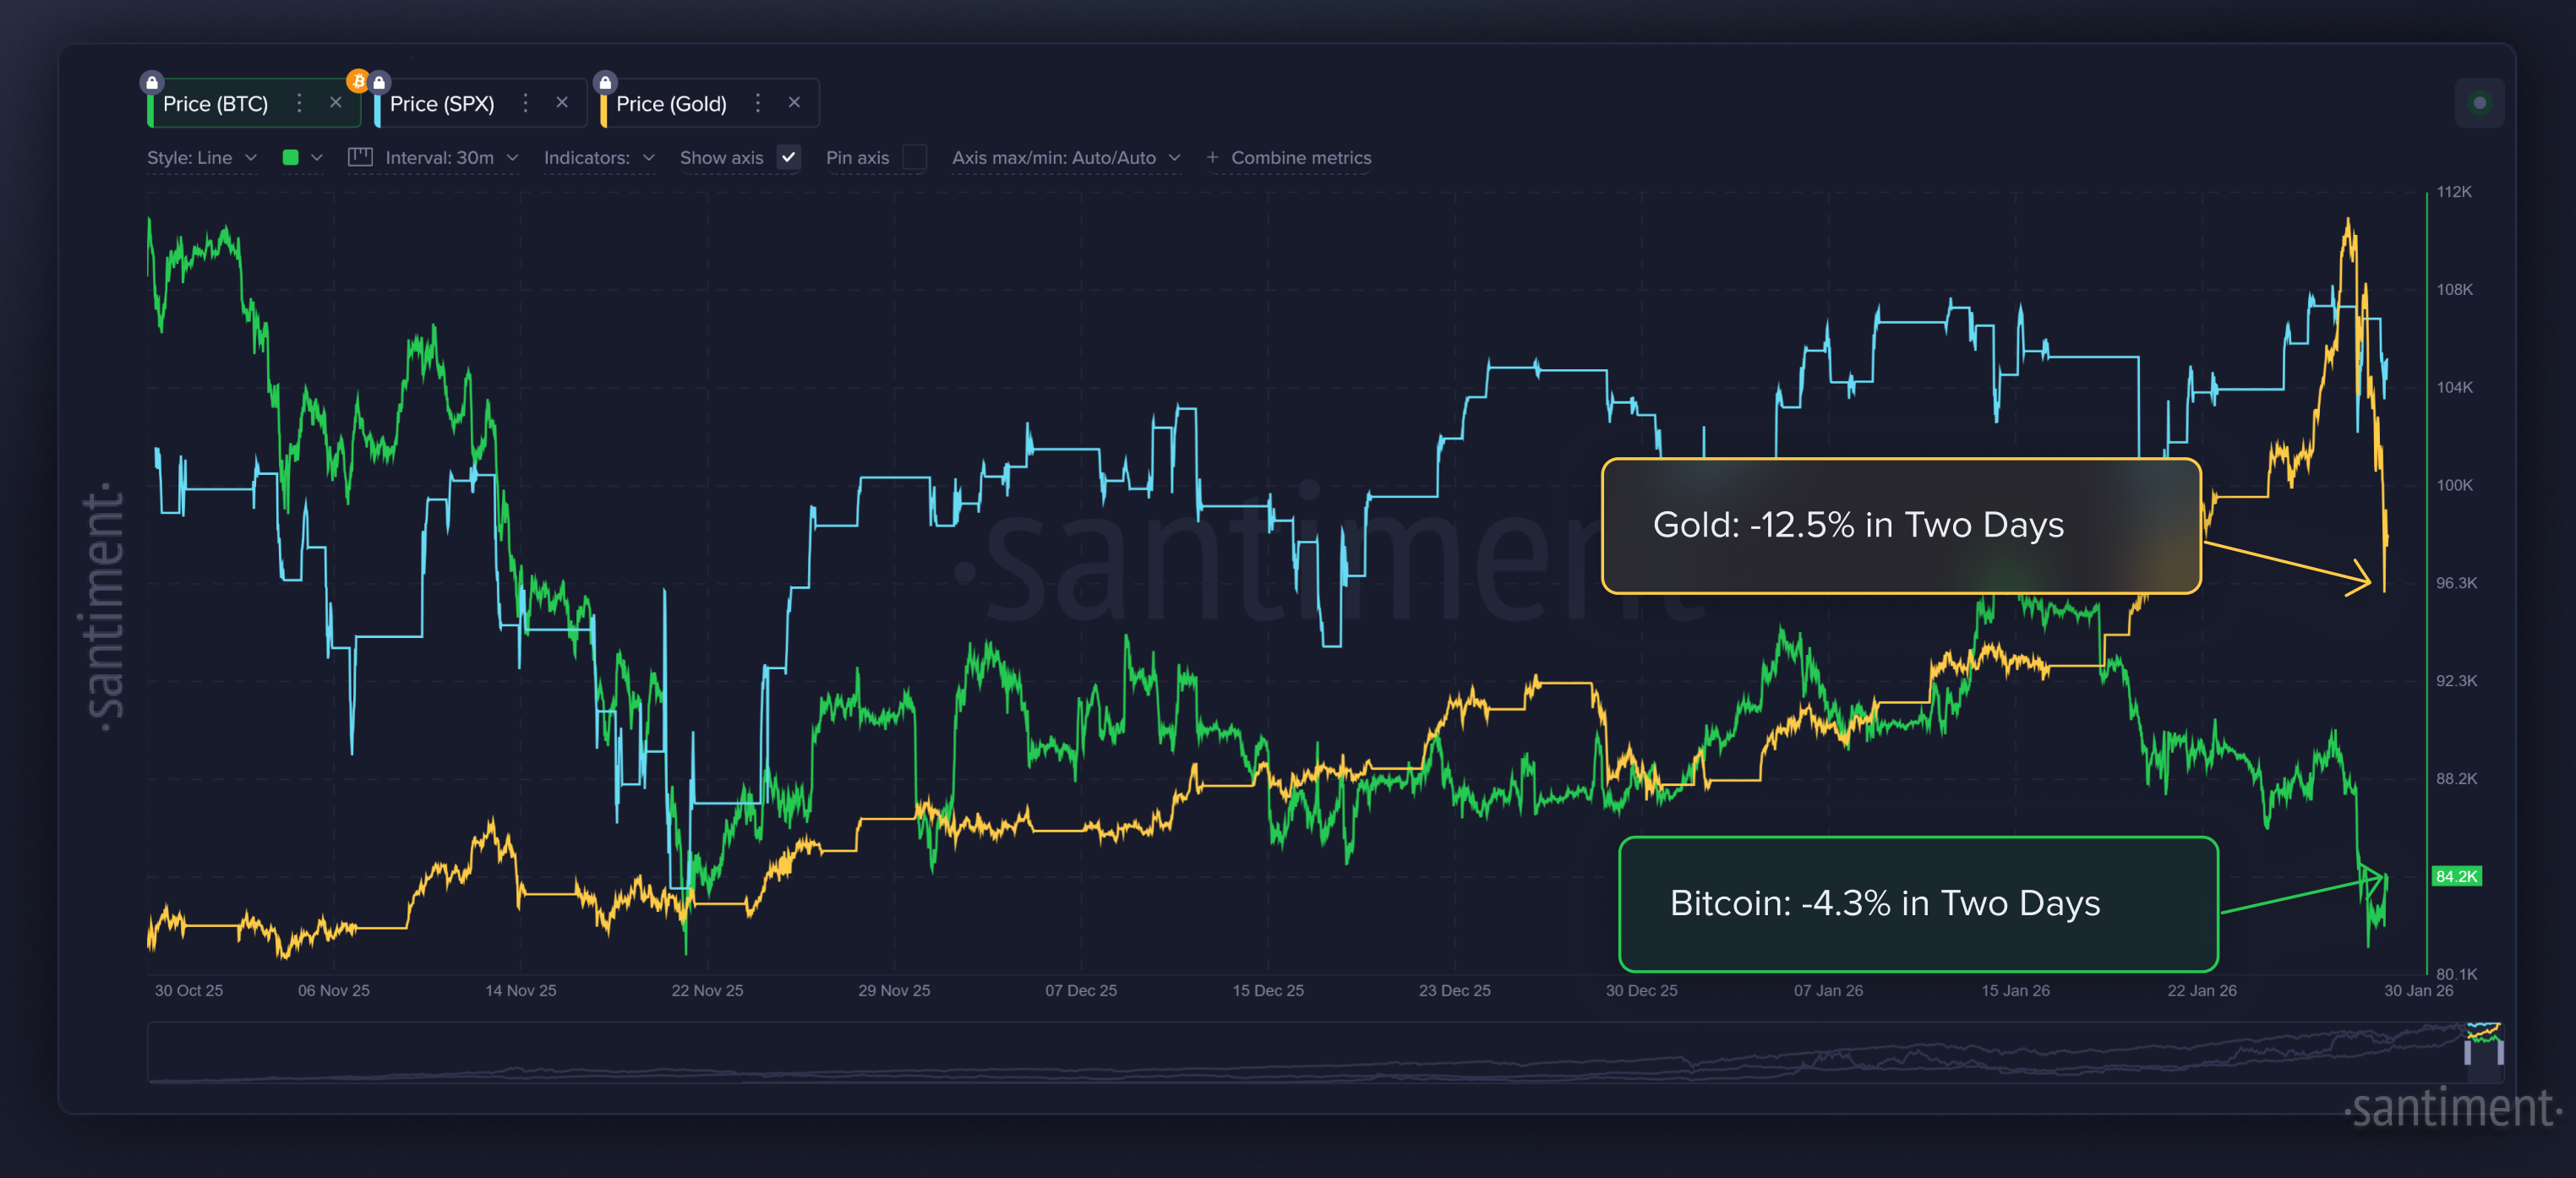
While Bitcoin also declined during this period, it outperformed precious metals, strengthening the narrative that it is increasingly viewed as a modern alternative store of value. This relative resilience helped stabilize crypto sentiment during an otherwise turbulent macro moment.
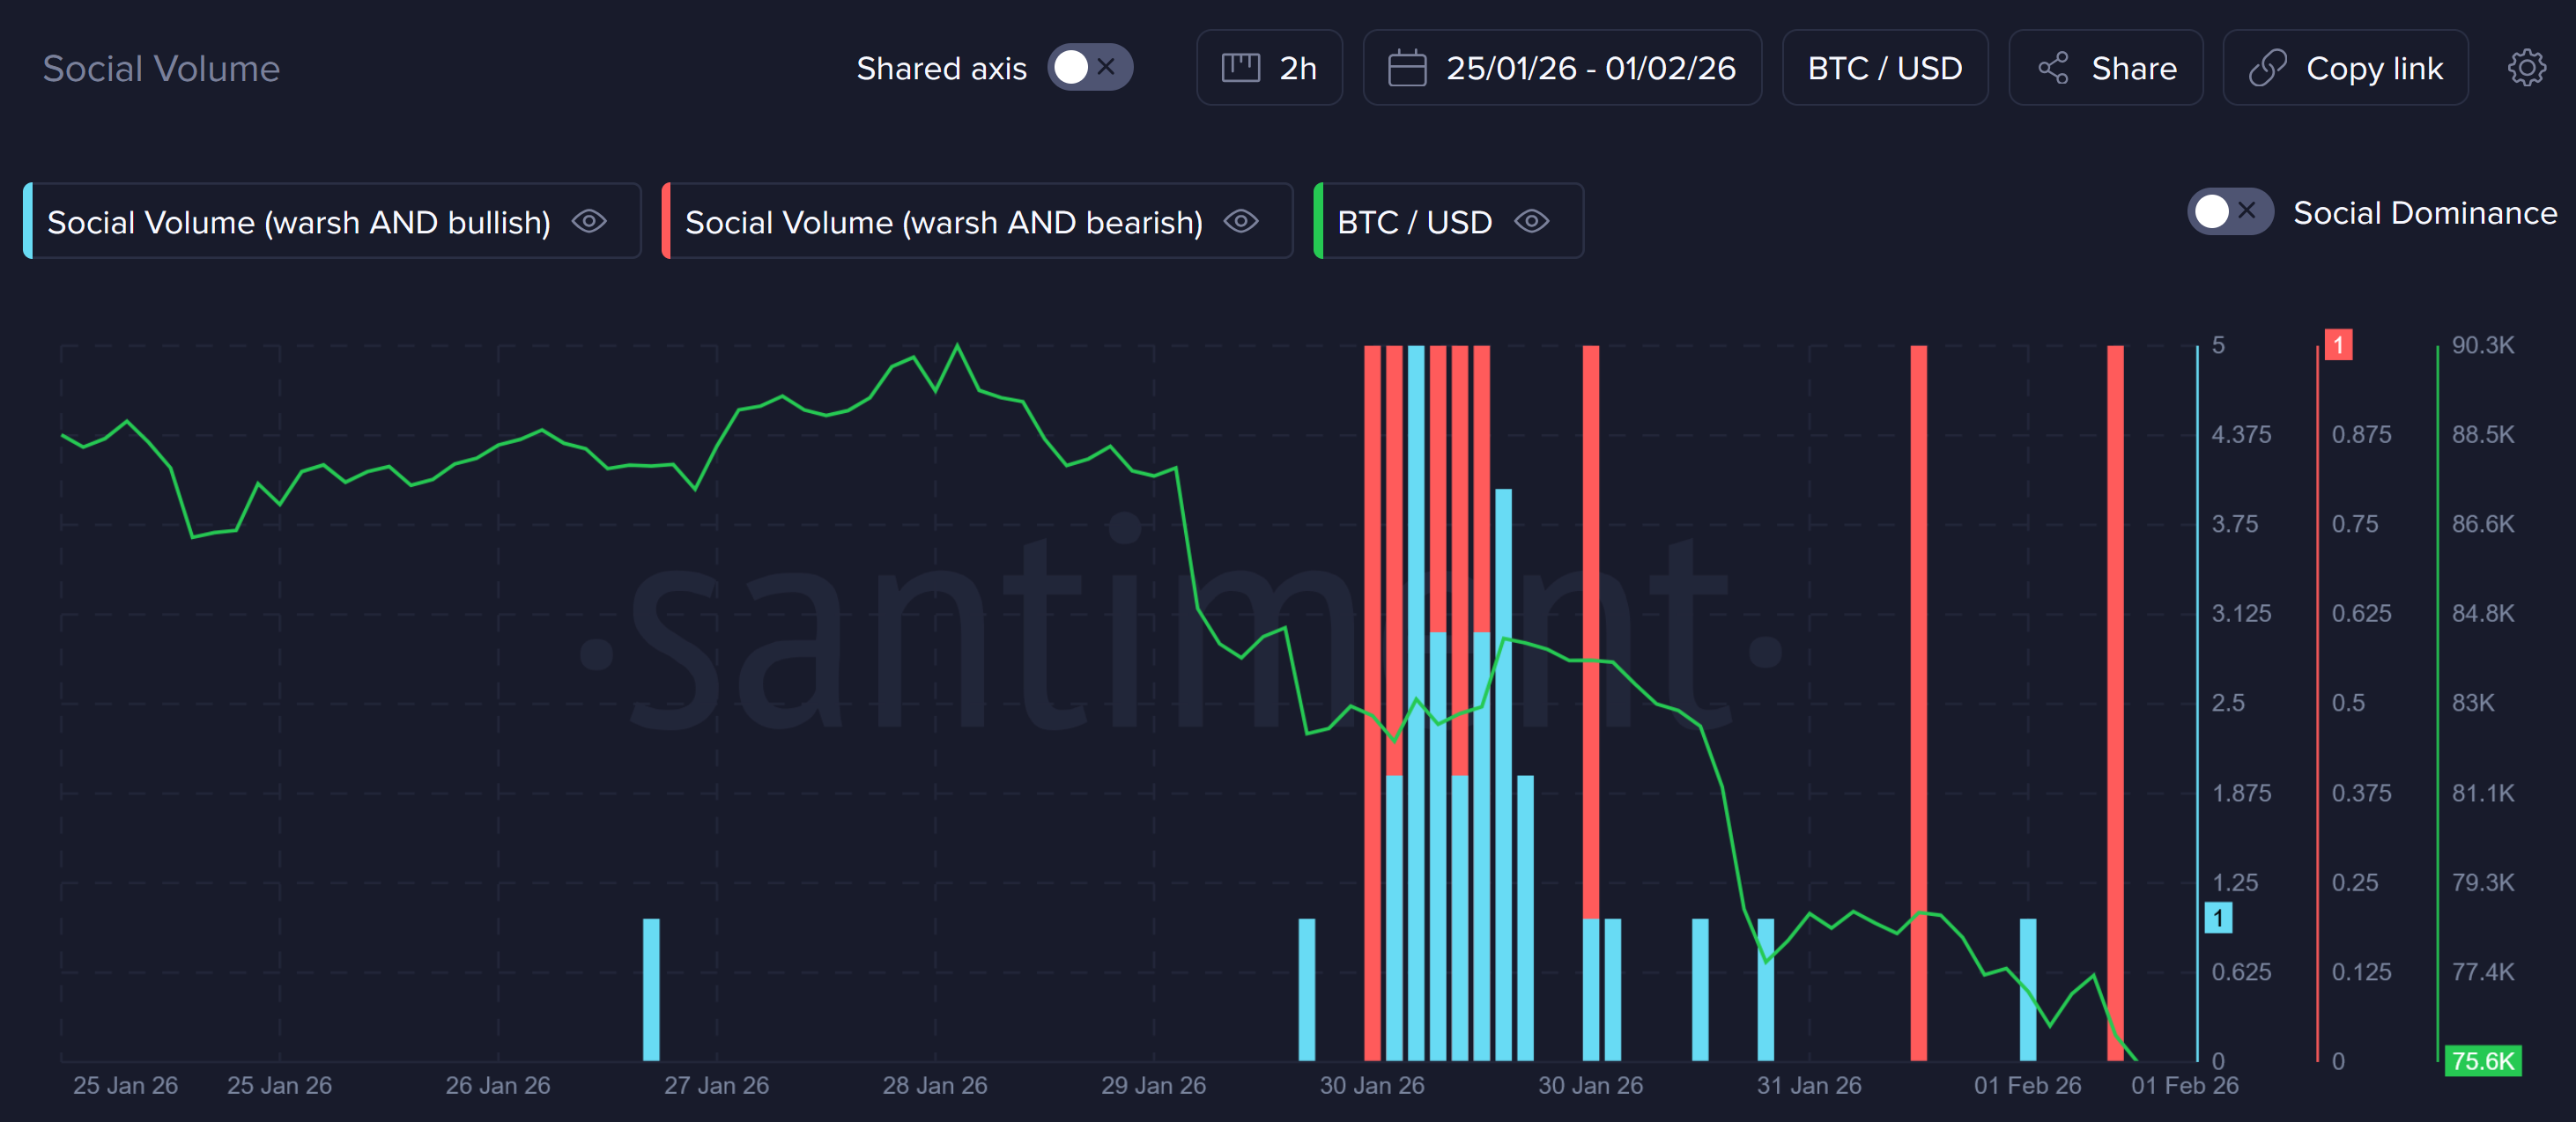
Federal Reserve Leadership Shift Changes Macro Expectations
President Trump’s nomination of Kevin Warsh as Federal Reserve Chair added another layer of complexity to January’s macro environment. Warsh has publicly stated that Bitcoin functions as “new gold” for younger generations, a stance that contrasts sharply with traditional monetary thinking.

Markets reacted unevenly, but Bitcoin showed signs of renewed interest following the announcement. While policy shifts take time, leadership changes at the Fed can reshape long-term capital flows, especially for risk assets like crypto. We can see a clear “buy the rumor, sell the news” effect when Warsh’s nomination from Trum began to circulate on January 30th. There was an initial wave of bullish and (moreso) bearish reactions to the news, markets proceeded to move up slightly, and as the narrative switched to slightly bullish, markets quickly free-fell.
Ethena’s Growth Stalls as Funding Rates Compress
Ethena’s stablecoin, USDe, has been experiencing a recent supply contraction happening alongside ever-rising distribution. Even as total supply has fallen hard since the October peak, the number of holders has continued climbing, recently surpassing 40K non-empty wallets on the network. This suggests USDe is being spread across more wallets rather than disappearing from usage entirely. The most likely interpretation is that large holders have been redeeming or unwinding positions (shrinking supply) during the market cooldown, while USDe still finds steady demand across DeFi wallets and smaller participants (rising holders). In other words, USDe looks like it’s deleveraging in size, but expanding in footprint.
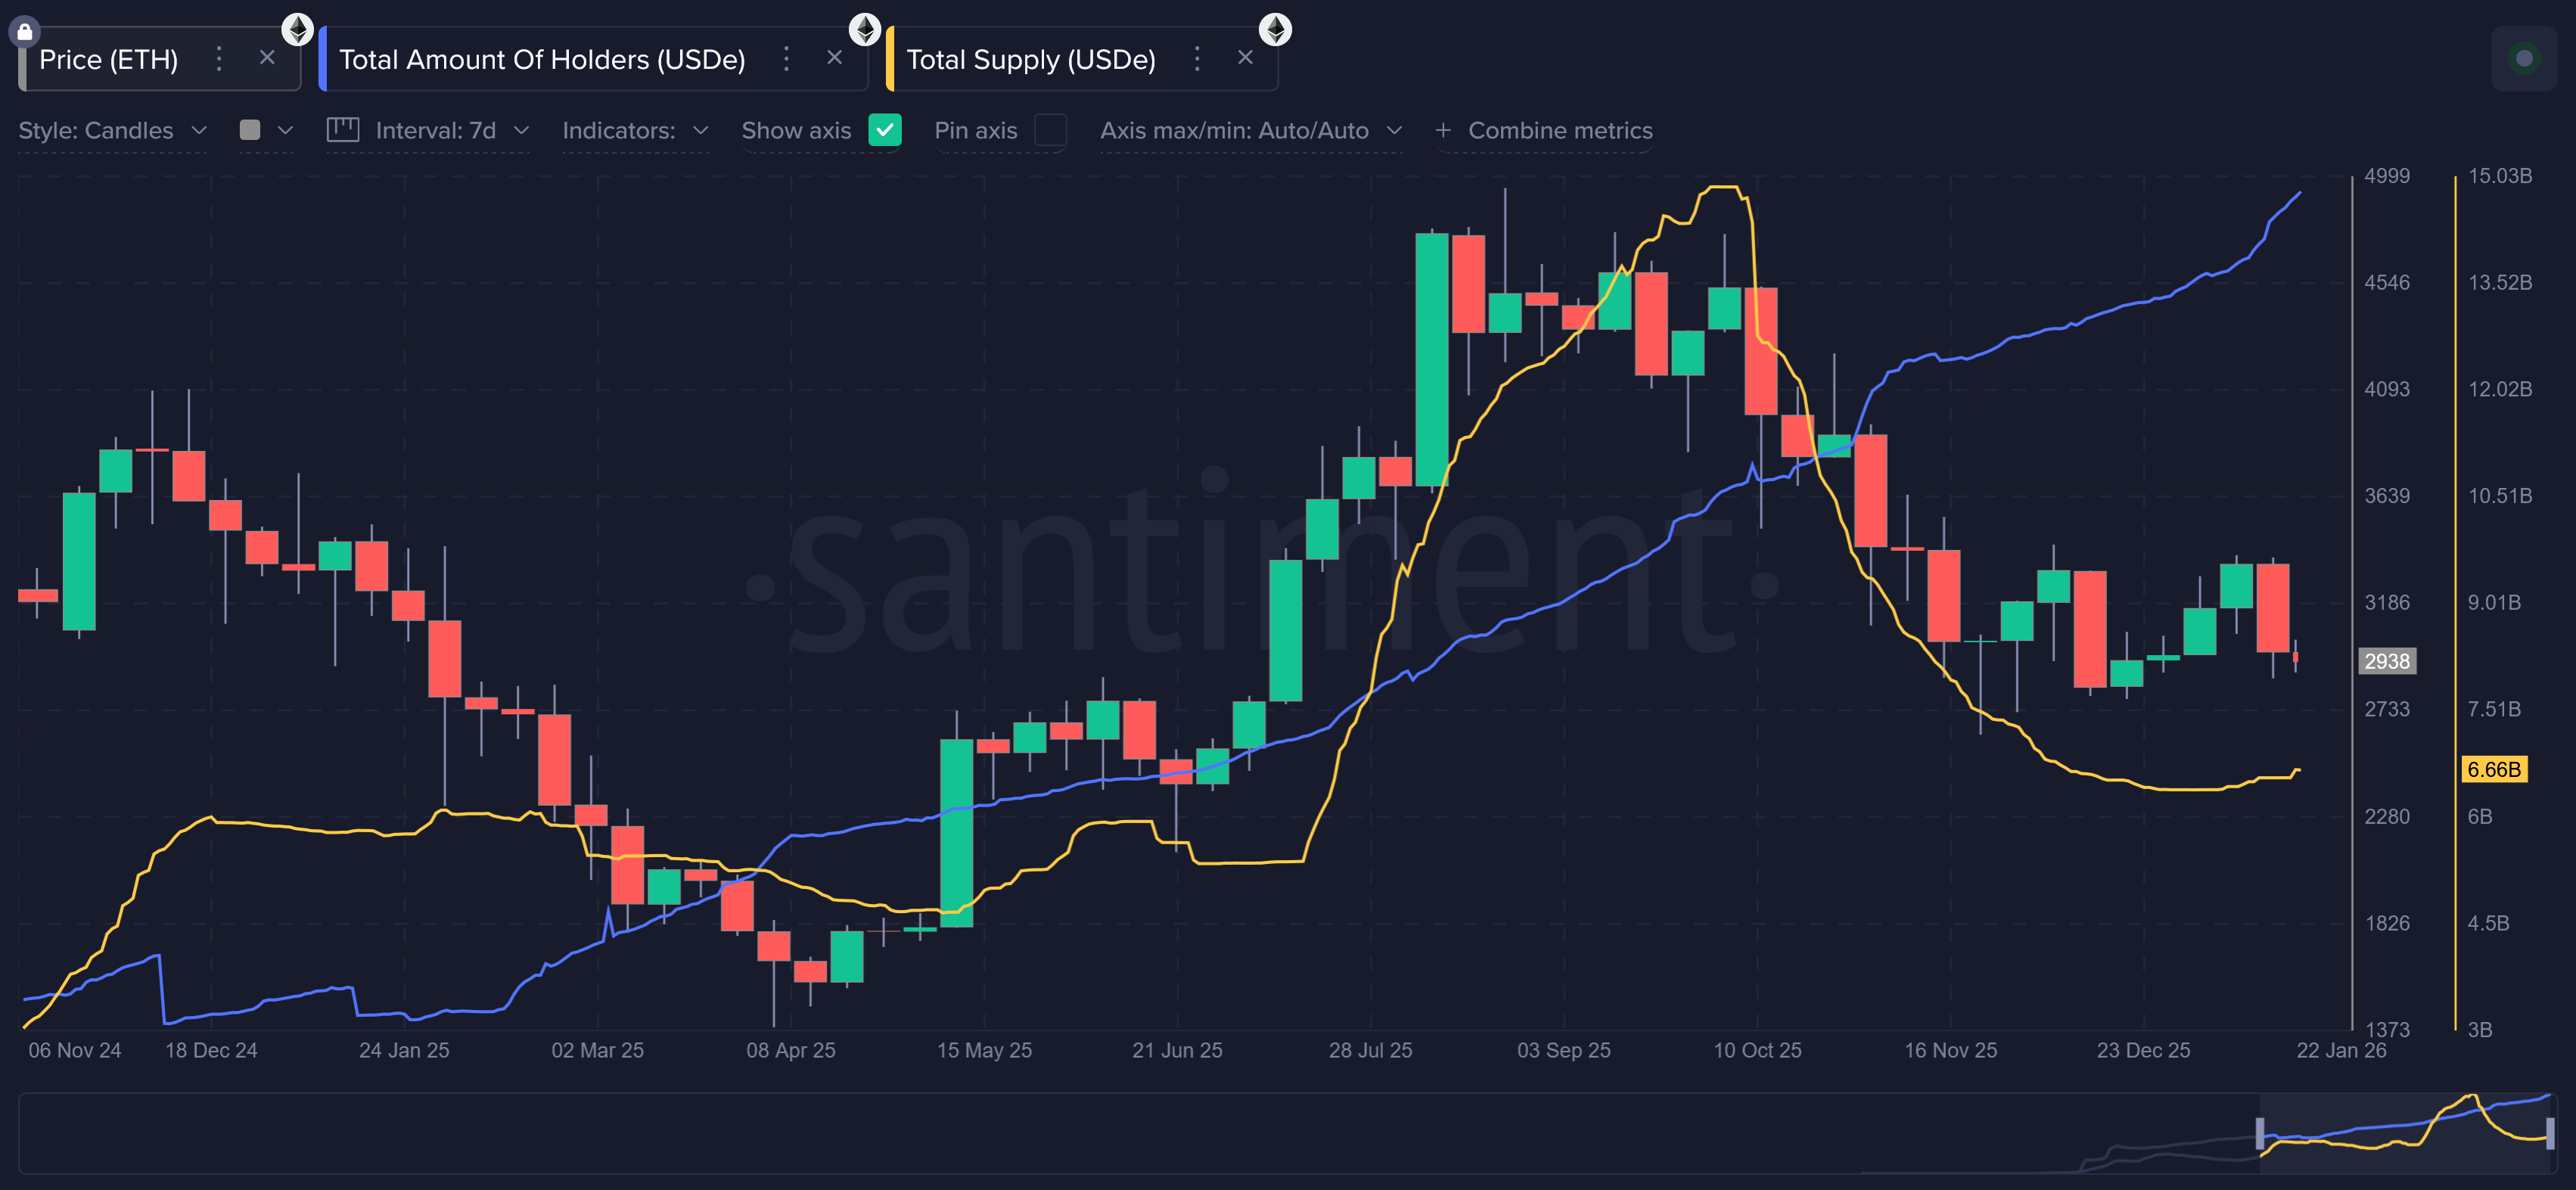
This divergence aligns with cooling funding rates tied to USDe’s yield mechanism, which reduces the incentive for large leveraged players to maintain oversized positions. As funding compresses, supply naturally contracts from whales unwinding trades, while smaller holders continue using USDe for everyday DeFi liquidity rather than pure carry trades. This slowdown serves as a reminder that yield-driven protocols are highly sensitive to market conditions. As traders reduce leverage and risk, returns shrink, and growth narratives can reverse quickly.
Perpetual DEX Interest On Decline
Perpetual decentralized exchanges were one of the hottest trading trends over the past year, but recent activity suggests the excitement may be cooling. Trading volumes across several major perp platforms have pulled back as volatility dropped and short-term trading opportunities became harder to find. Many traders originally came for aggressive incentive programs and token farming rewards, but once those bonuses slowed, participation did too. This shift has led to growing conversation that the “perp DEX meta” may be maturing or even getting overcrowded, with fewer easy returns attracting speculative capital than before. Perhaps not so coincidentally, the hype surrounding Perpetual DEX’s peaked just as Bitcoin hit its all-time high four months ago.
Tokens tied directly to this sector have reflected that fatigue. Hyperliquid’s HYPE token has faced pressure as reduced trading activity translates into weaker fee generation and less enthusiasm around growth expectations. Meanwhile, Lighter’s LIT token disappointed many early investors after launch, struggling to maintain momentum once farming incentives faded and traders rotated elsewhere. Together, their performance has reinforced the perception that perpetual DEXs are moving from a hype-driven expansion phase into a more competitive, lower-margin environment where only the strongest platforms may retain long-term attention.
Trove ICO Scandal Undermines Trust
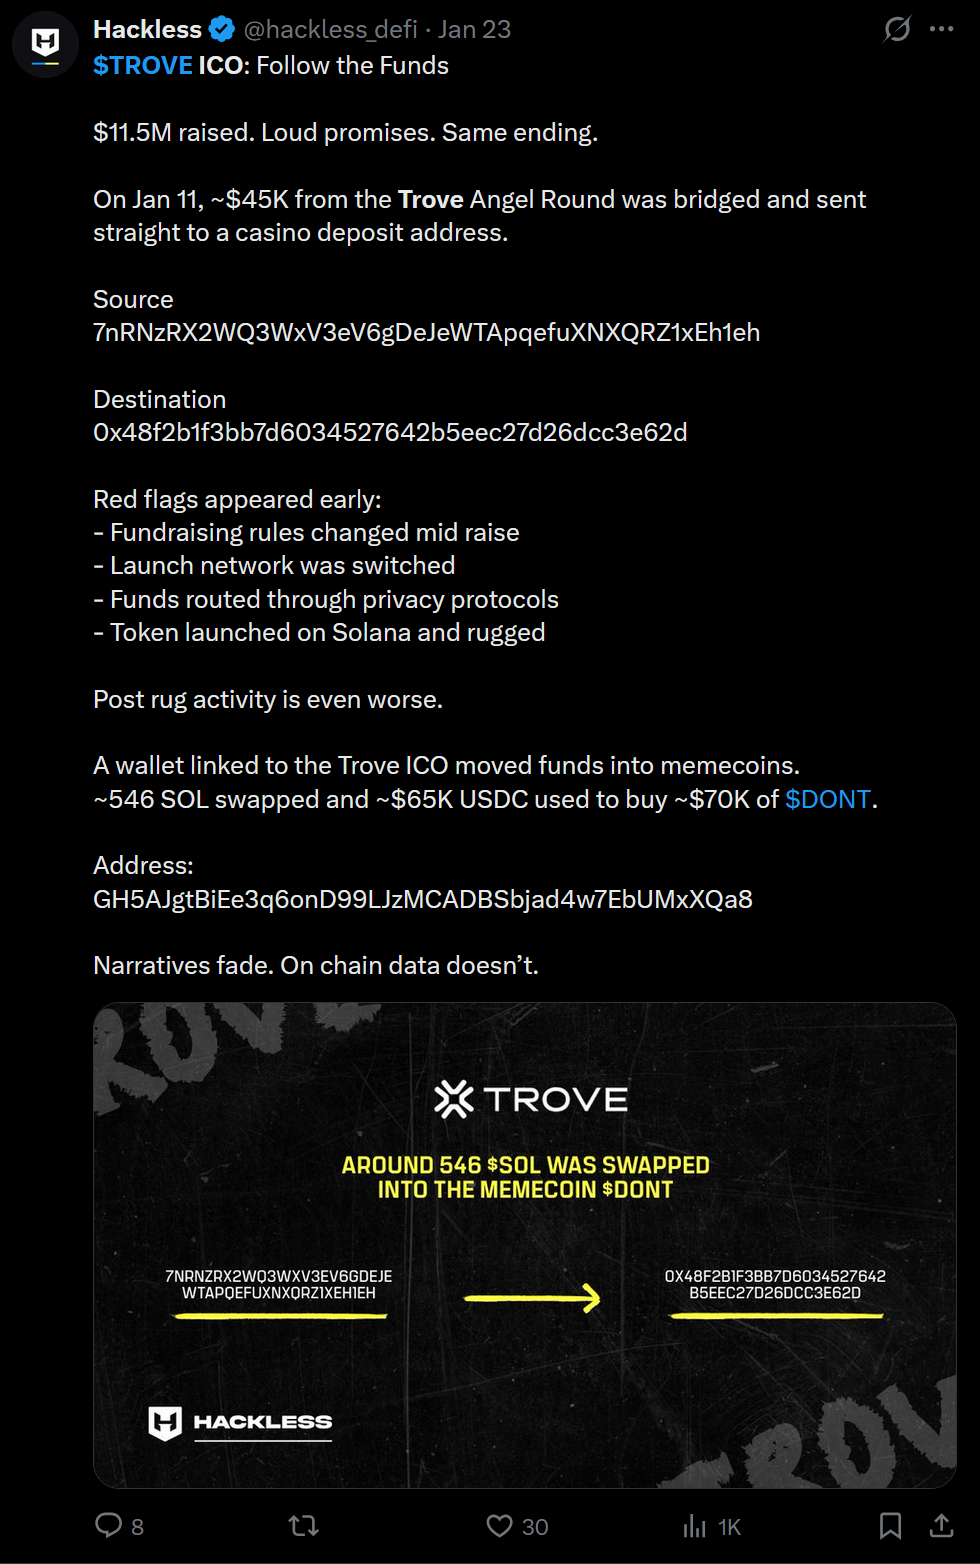
January closed with a major credibility blow following the Trove ICO collapse. After raising over $20 million with promises of a cross-asset trading platform, the team pivoted chains, failed to return excess funds, and saw the token crash roughly 99% post-launch. Why? Well, this looked to be quite a deliberate move.
On-chain investigators quickly began tracing where portions of the raise actually went. According to blockchain security firm Hackless, a wallet tied to the Trove angel round bridged funds and routed roughly $45K to an address associated with a casino deposit shortly after the raise. Their analysis also highlighted multiple early warning signs: fundraising terms changed mid-raise, the launch network was switched, and funds were reportedly passed through privacy rails before the token ultimately launched and collapsed on Solana. While the team never publicly confirmed these movements, the transparency of blockchain records fueled immediate skepticism about intent.
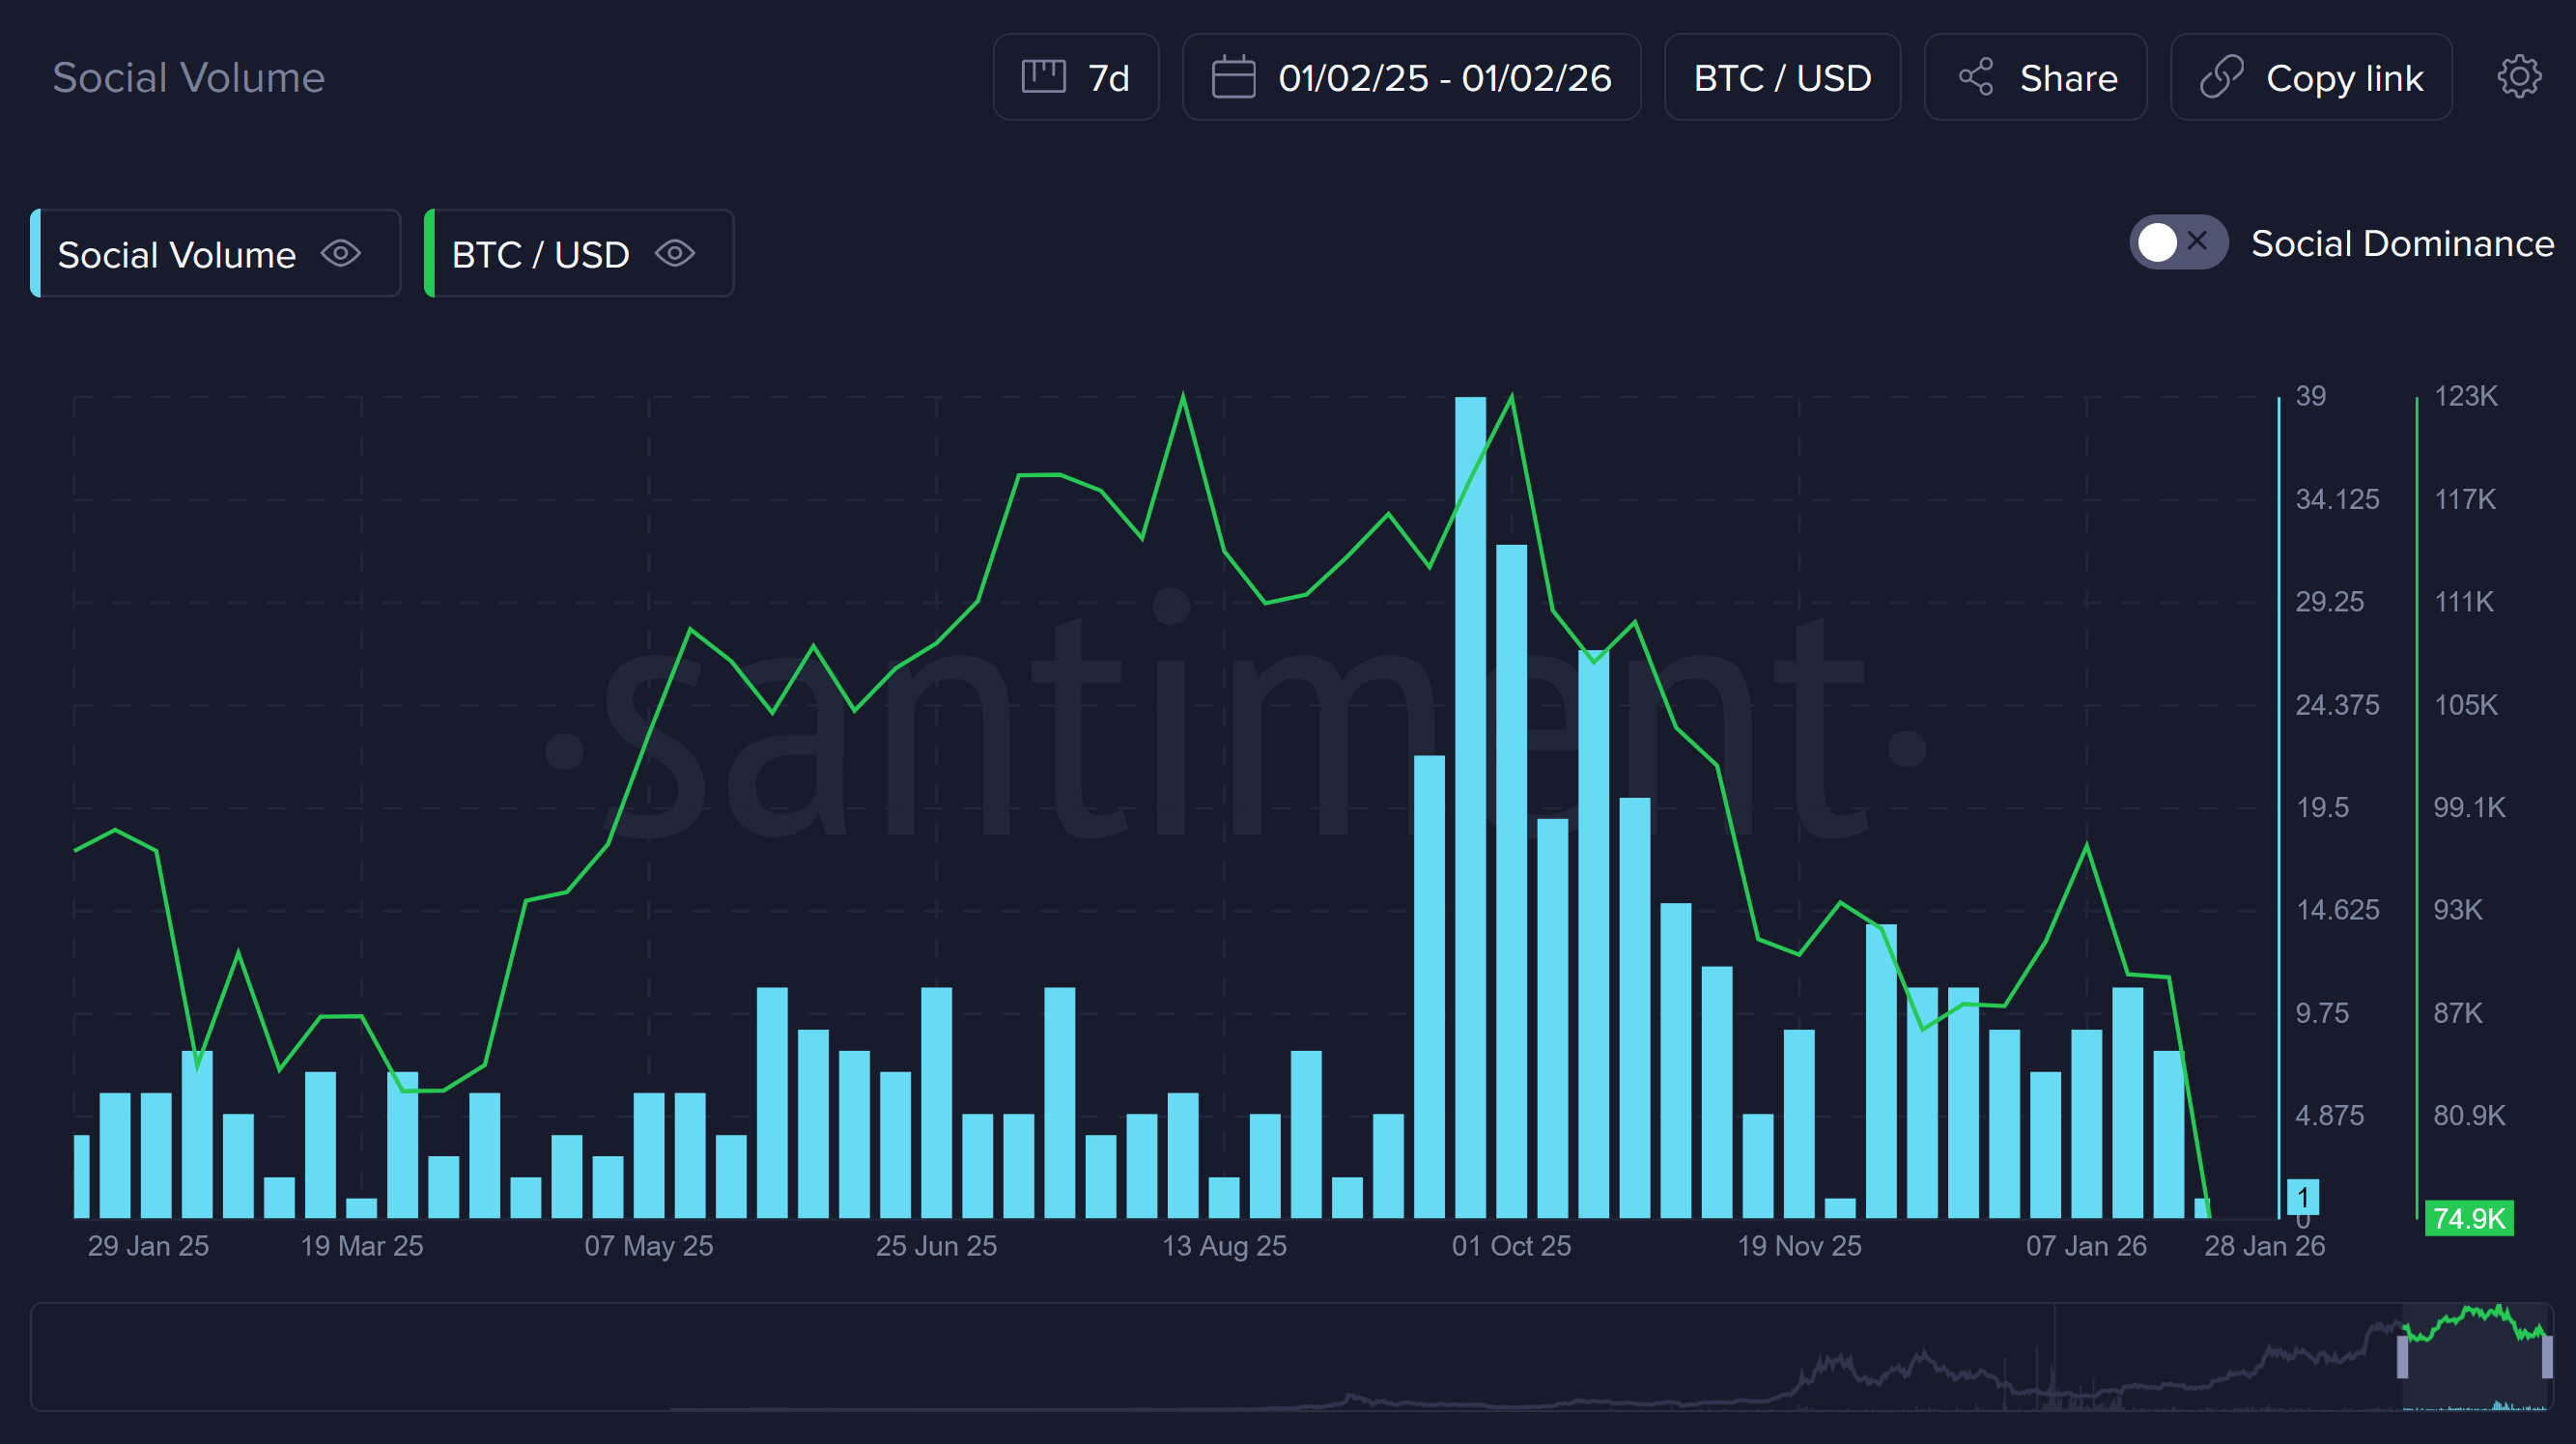
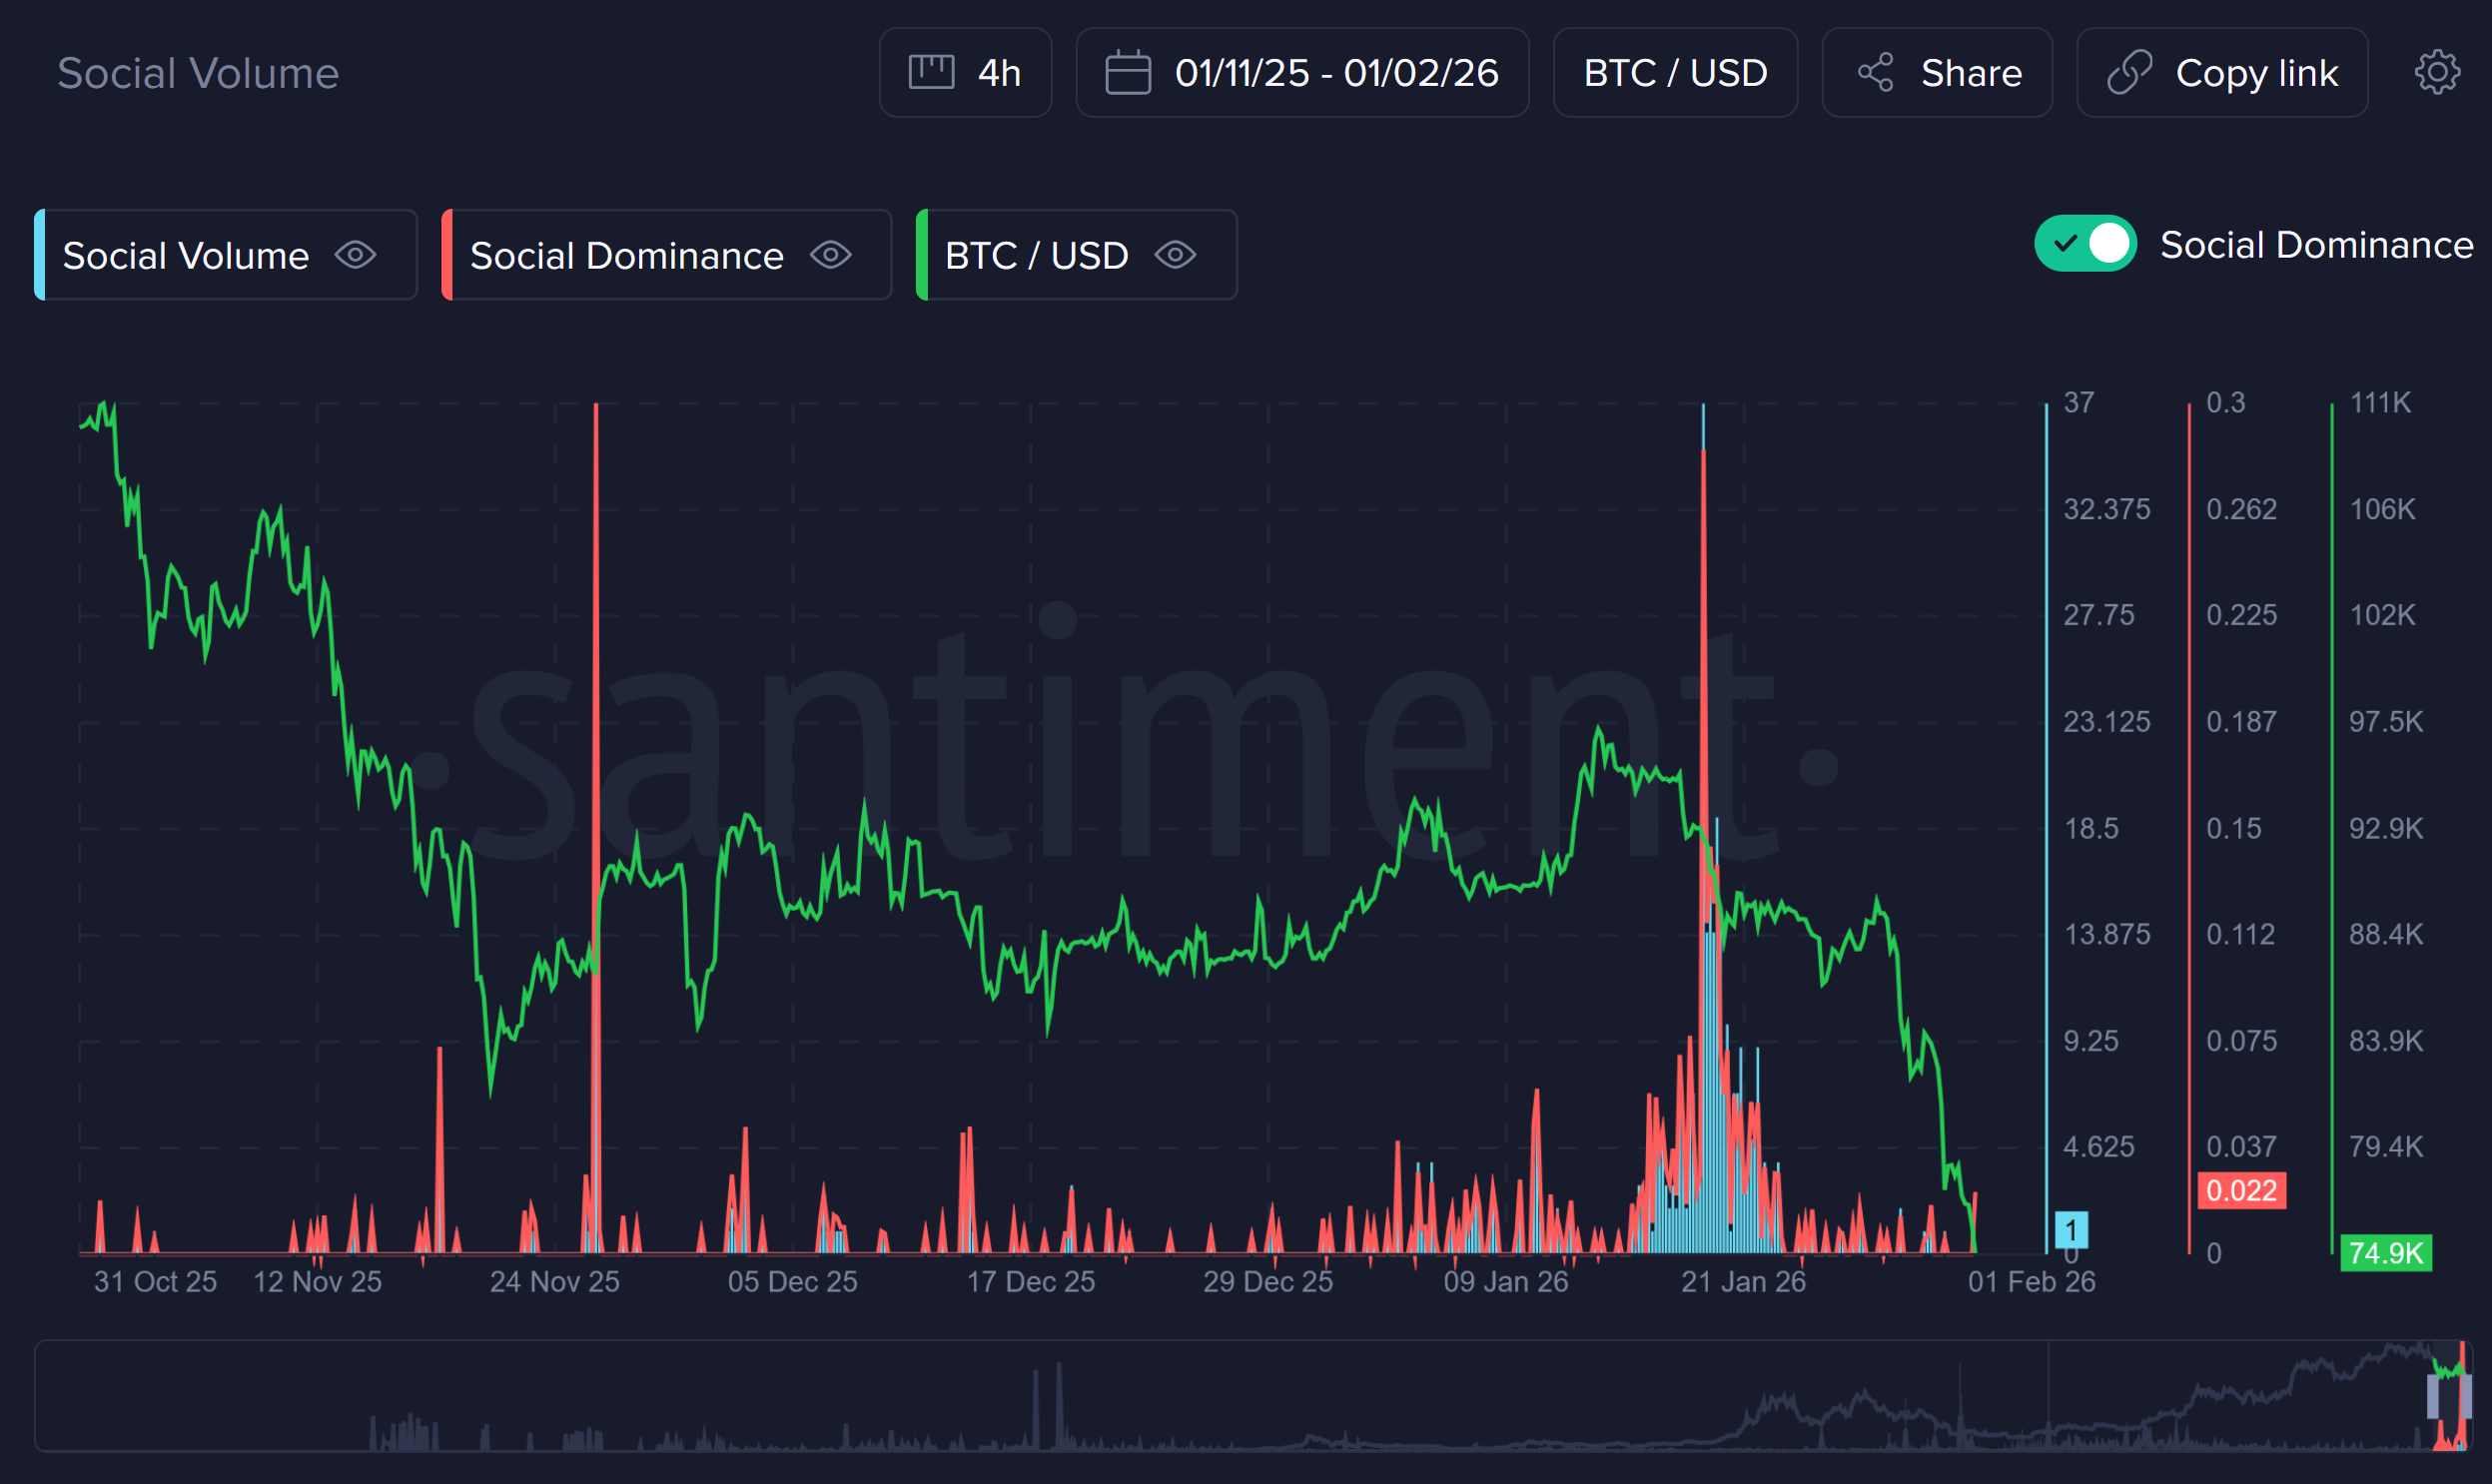
Independent analysts tracking the same wallet cluster observed additional swaps into memecoins after the token crash, including transactions involving SOL and stablecoins that appeared unrelated to platform development. Community researchers on X and Telegram circulated transaction receipts showing capital rotating into speculative assets rather than infrastructure spending. We can see from a social perspective how the hype around Trove coincided with a market-wide rise back in late November. But the collapse of it likely shook the confidence of the average traders’ view of crypto.
The backlash has extended to influencers accused of undisclosed paid promotions, and the community is still putting the pieces together. Regardless, this has reinforced one of crypto’s oldest lessons: hype, endorsements, and big raises do not replace transparency, execution, or accountability.
Looking Ahead to February
January was defined by retail gaining hope mid-month, then being let down just as retailers were beginning to smell $100K Bitcoin again. Now in February, conditions are much different with a strong bearish sentiment, cautious capital, and growing selectivity. There are some key metrics suggesting a short-term rebound, with the aforementioned beraish retailers and extreme negative MVRV’s on the short and long term scale. But ultimately, institutionals will need to find a reason to jump back into cryptocurrency if traders are hoping to see another bull cycle sometime soon. As always, keep an eye on sentiment, supply distribution, and macroeconomic context as we look ahead to 2026 beginning to unfold.
-----
Free two-week trials to Sanbase PRO (to access all mentioned Santiment data in this article, and plenty more) are AVAILABLE HERE!
-----
Disclaimer: The opinions expressed in the post are for general informational purposes only and are not intended to provide specific advice or recommendations for any individual or on any specific security or investment product.