Deep Dive: Finding Buy Signals While Feeling Rock Bottom

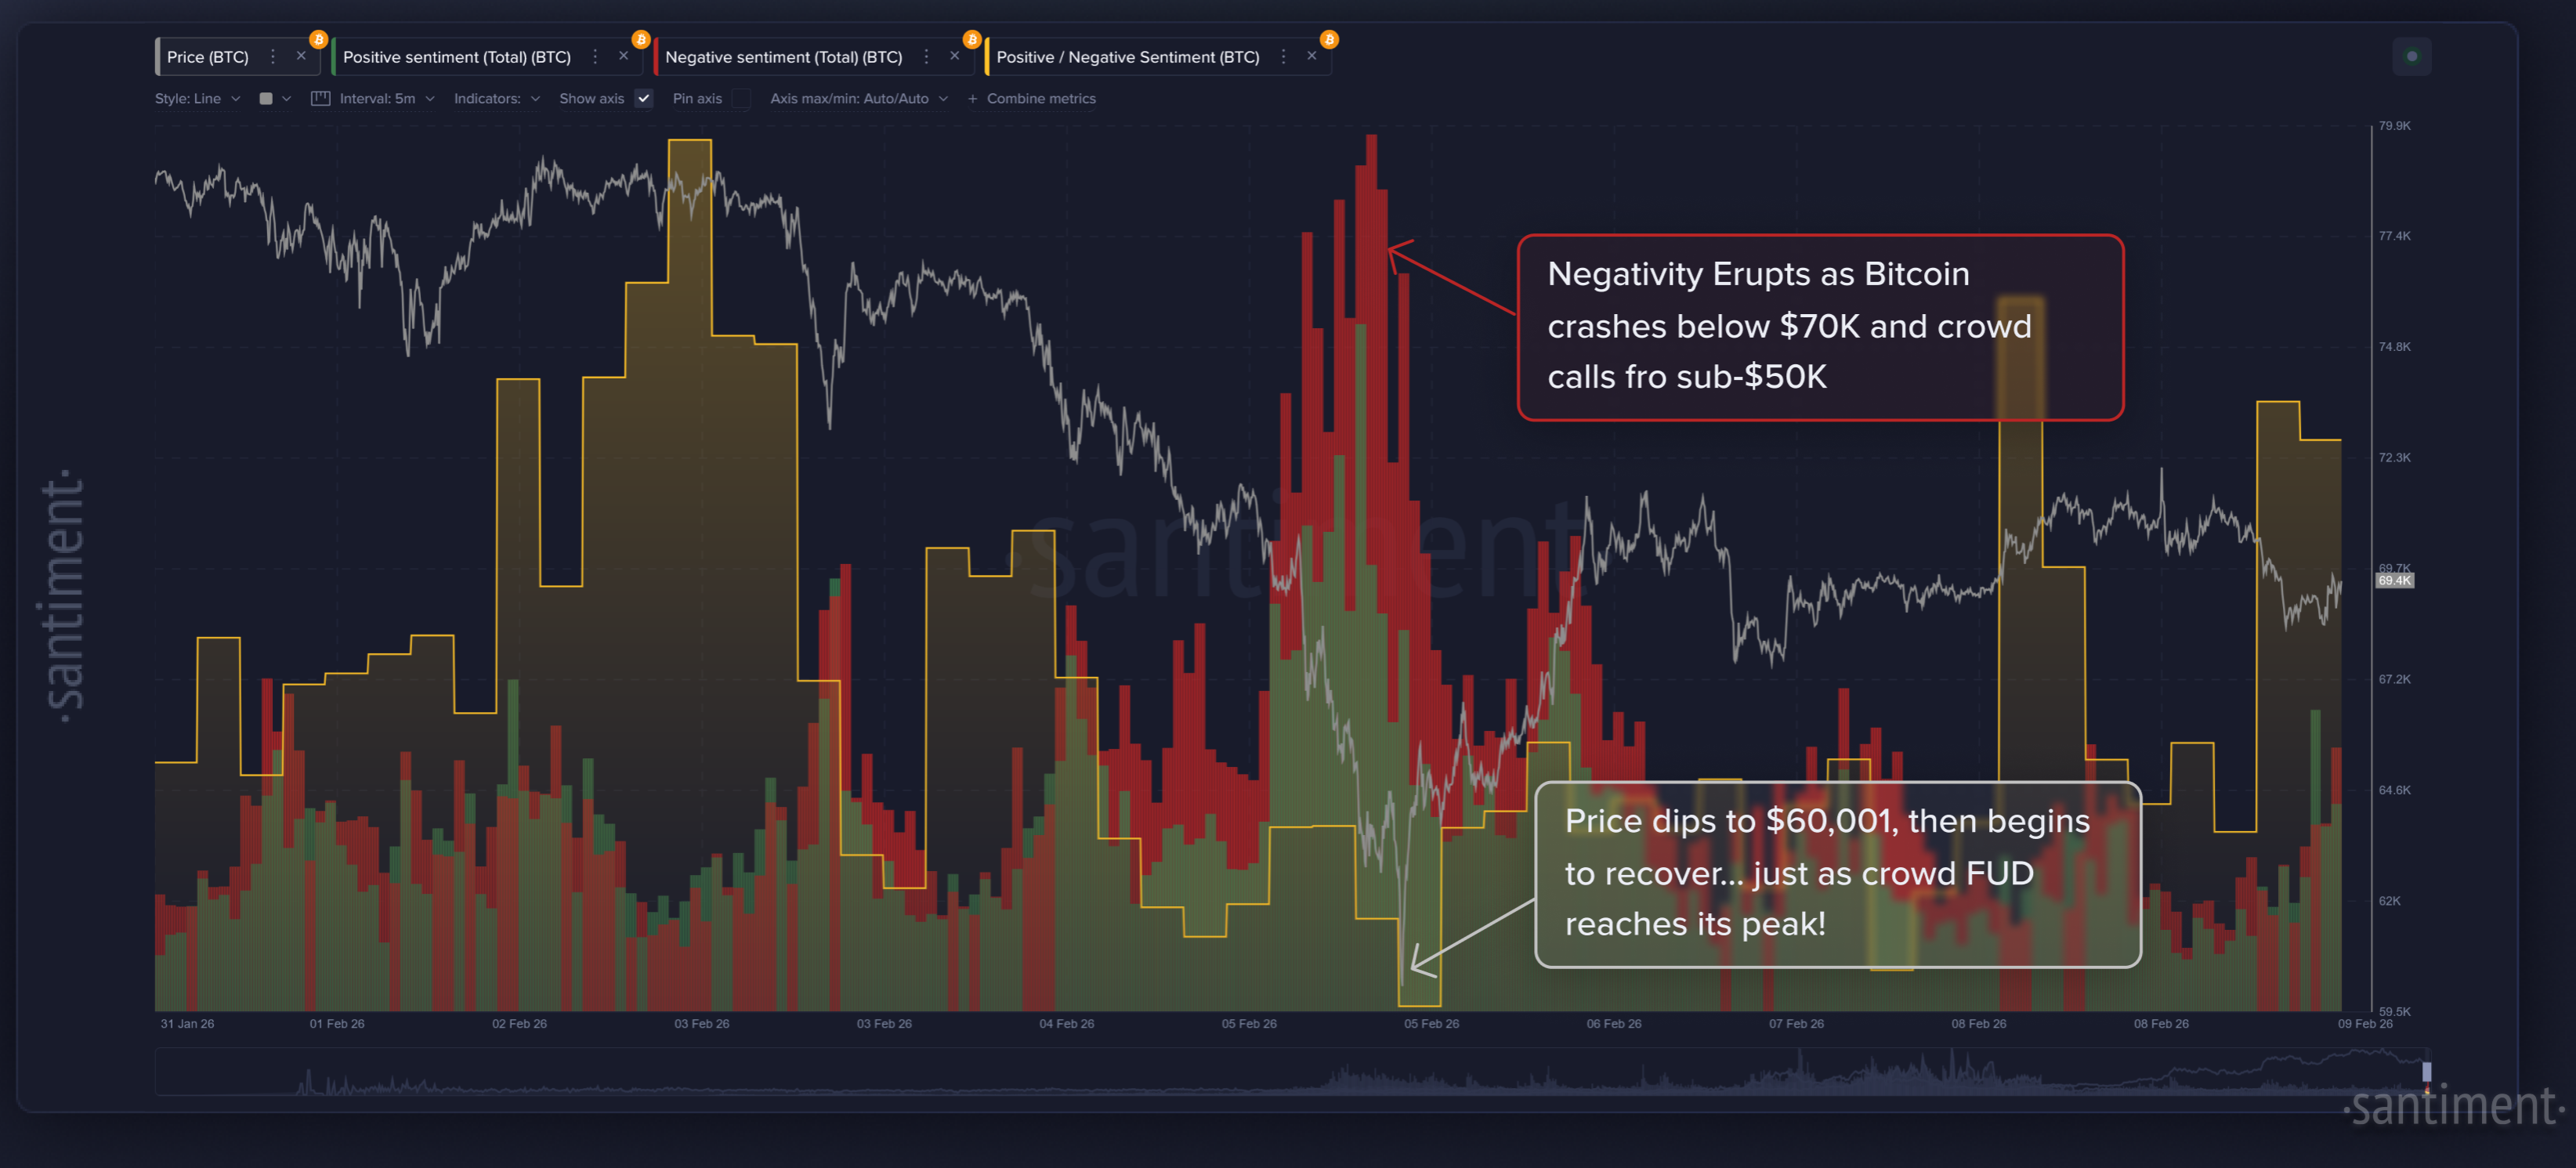
After some fairly widespread panic to start February, Bitcoin (and crypto) has settled into a bit of a recovery pattern now. Bottoming out at $60,001 back on Thursday, cryptocurrency's top market cap asset rebounded a staggering +19% in just under 24 hours following the FUD.
Was this a coincidence? Hardly. It was just the latest example of how cryptocurrencies ebb and flow based on the opposite direction that the crowd is leaning. As we can see in the chart below, when negativity gets high, it's usually because prices are getting low in a hurry. And once you see the predictions of doom for cryptocurrency, it's generally the best time to officially buy the dip.
In this article, we will go over examples like this, as well as others, to help you identify when you can make the best informed decisions to actually buy a dip. Hint: it's generally when the crowd stops being interested in buying the dip themselves. Remember that identifying what a "dip" actually is can often come down to what you make of the markets, and what timeframe you're looking at. Is a -1.7% dip (in 2 hours) worth buying? Well, maybe if you're swing trading on an hourly basis. But generally, we're going to see average traders reacting on a weekly basis, because that's actually the time basis that the average trader realistically has the bandwidth to trade.
Here is the social volume and dominance across social media for when the crowd mentions the words "buy", "buying", or "bought" in association with the word "dip":
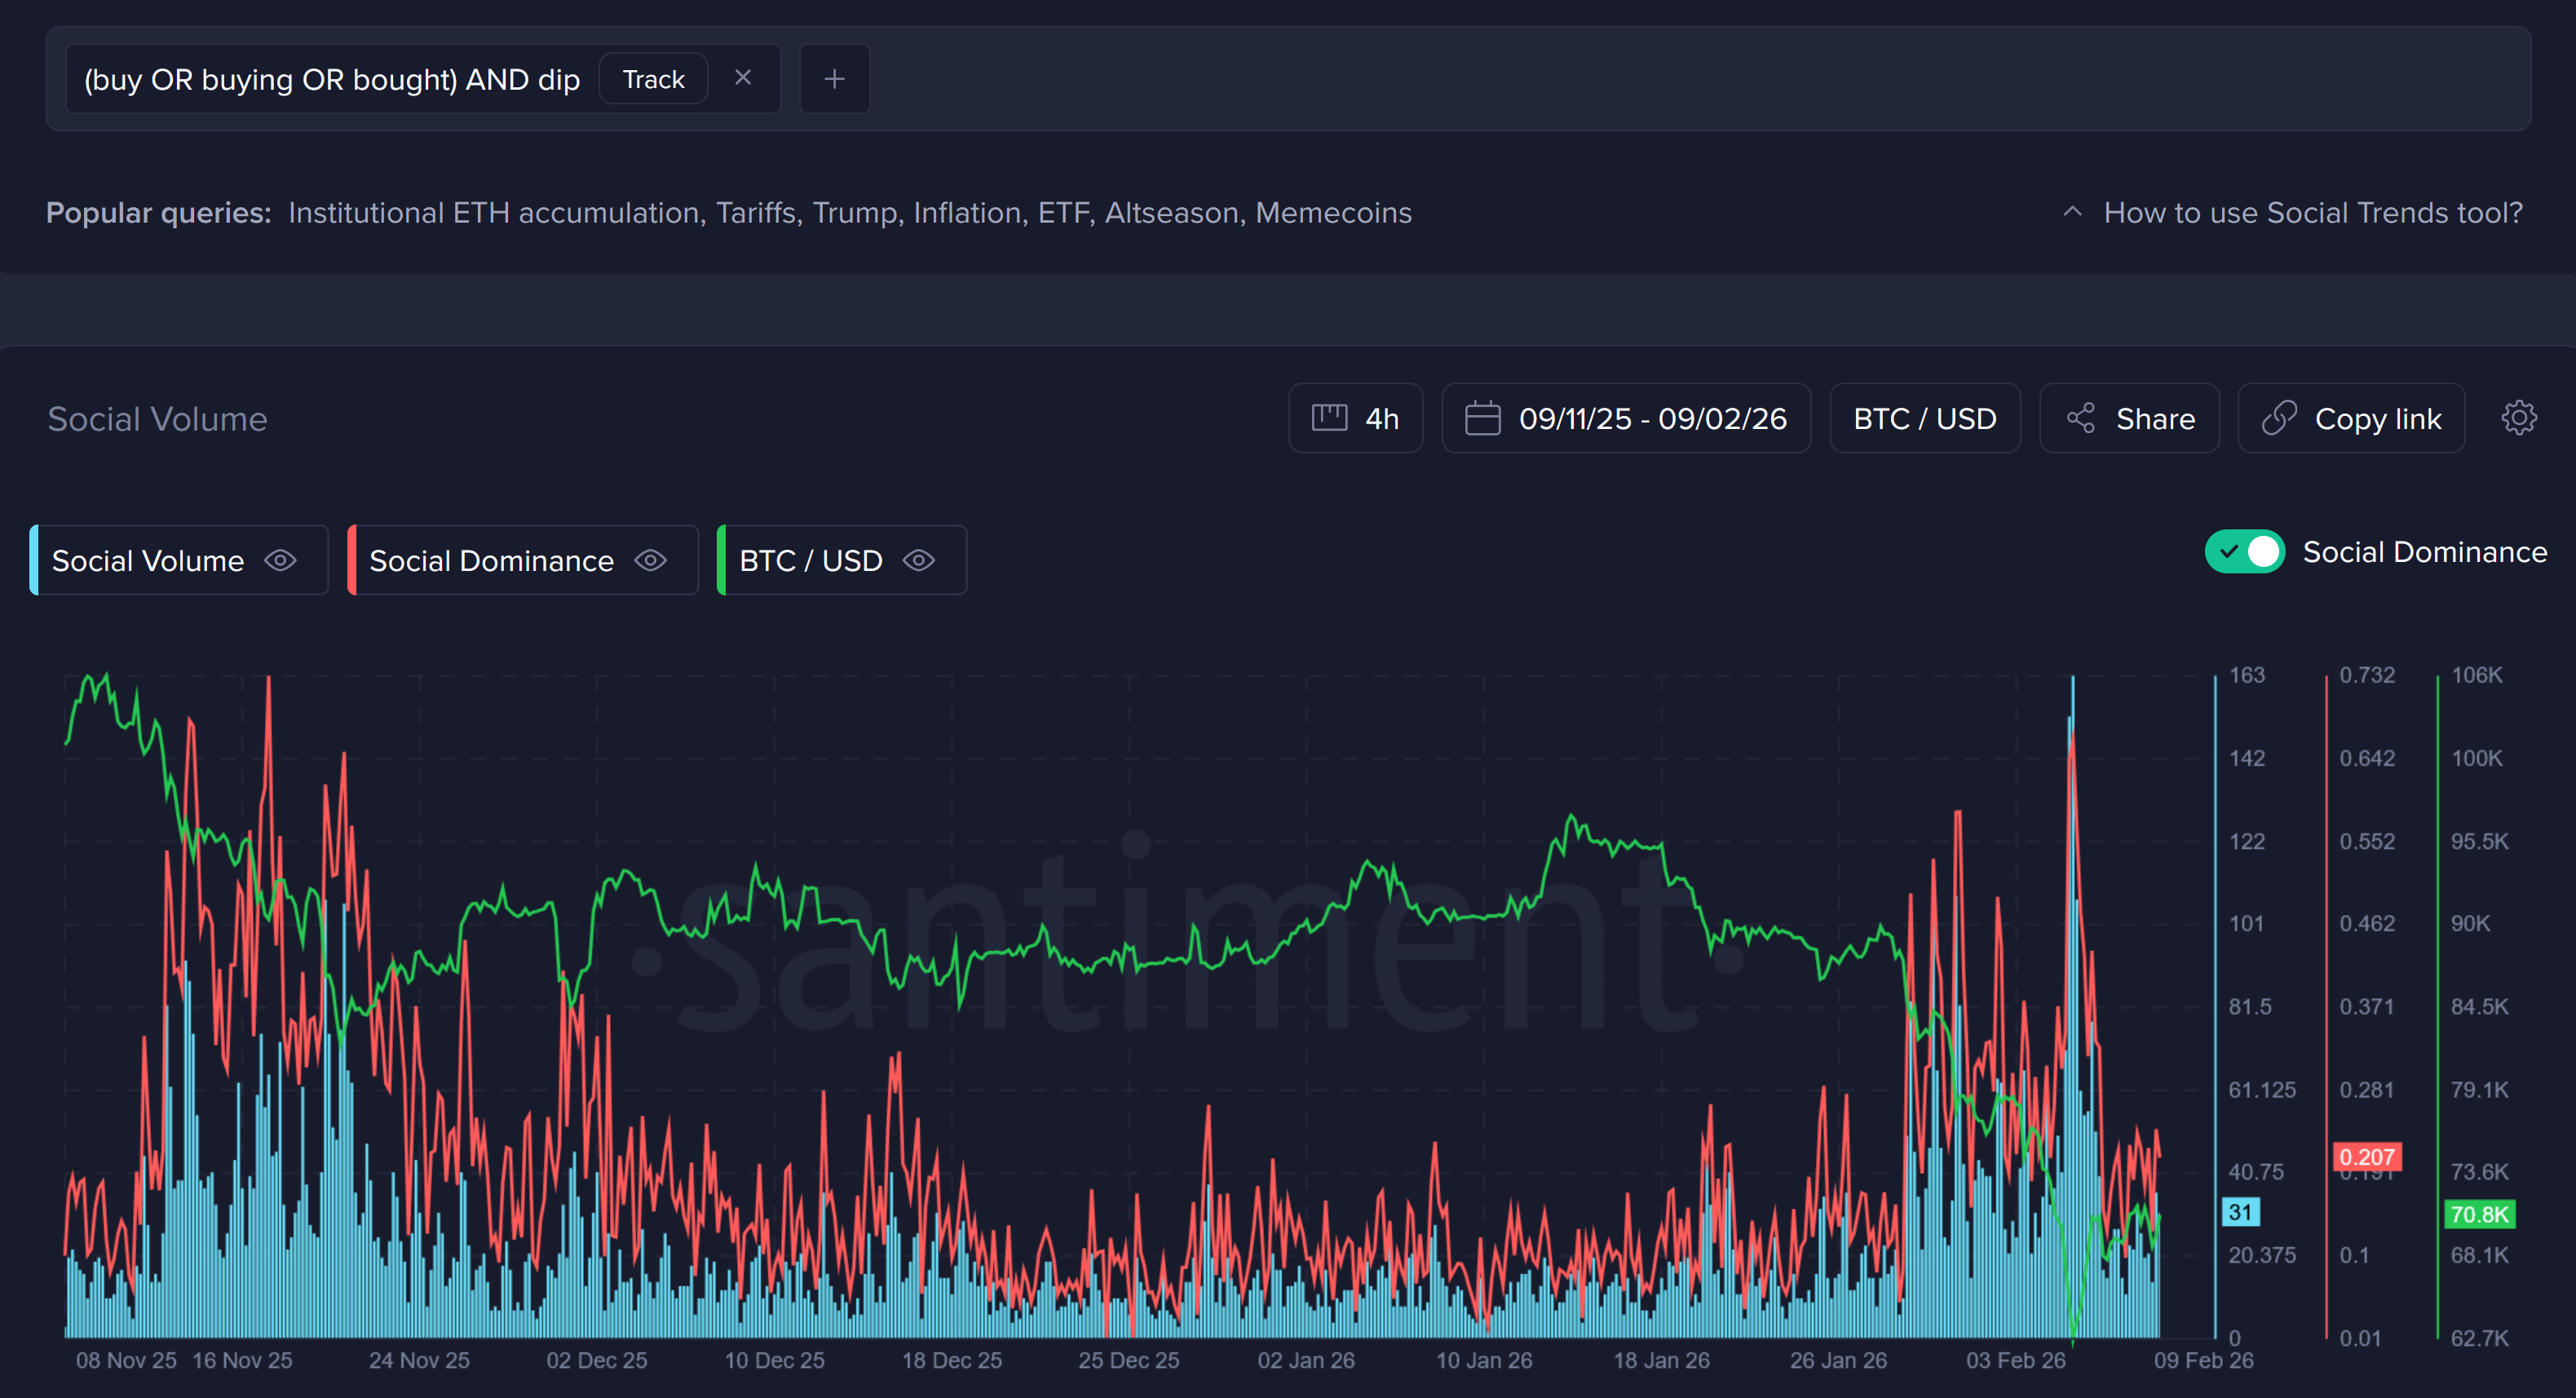
As you can see, the frequency of these mentions obviously are going to grow when prices are moving down, especially when they're moving down quickly. But admittedly, it is a bit unreliable to use as a primary trading tool to figure out when YOU should buy the dip. The crowd is at least smart enough to recognize what a dip is, and sometimes (due to geopolitical reasons, whale accumulation, or something else), prices simply bounce back before there is a sign that the crowd is giving up.
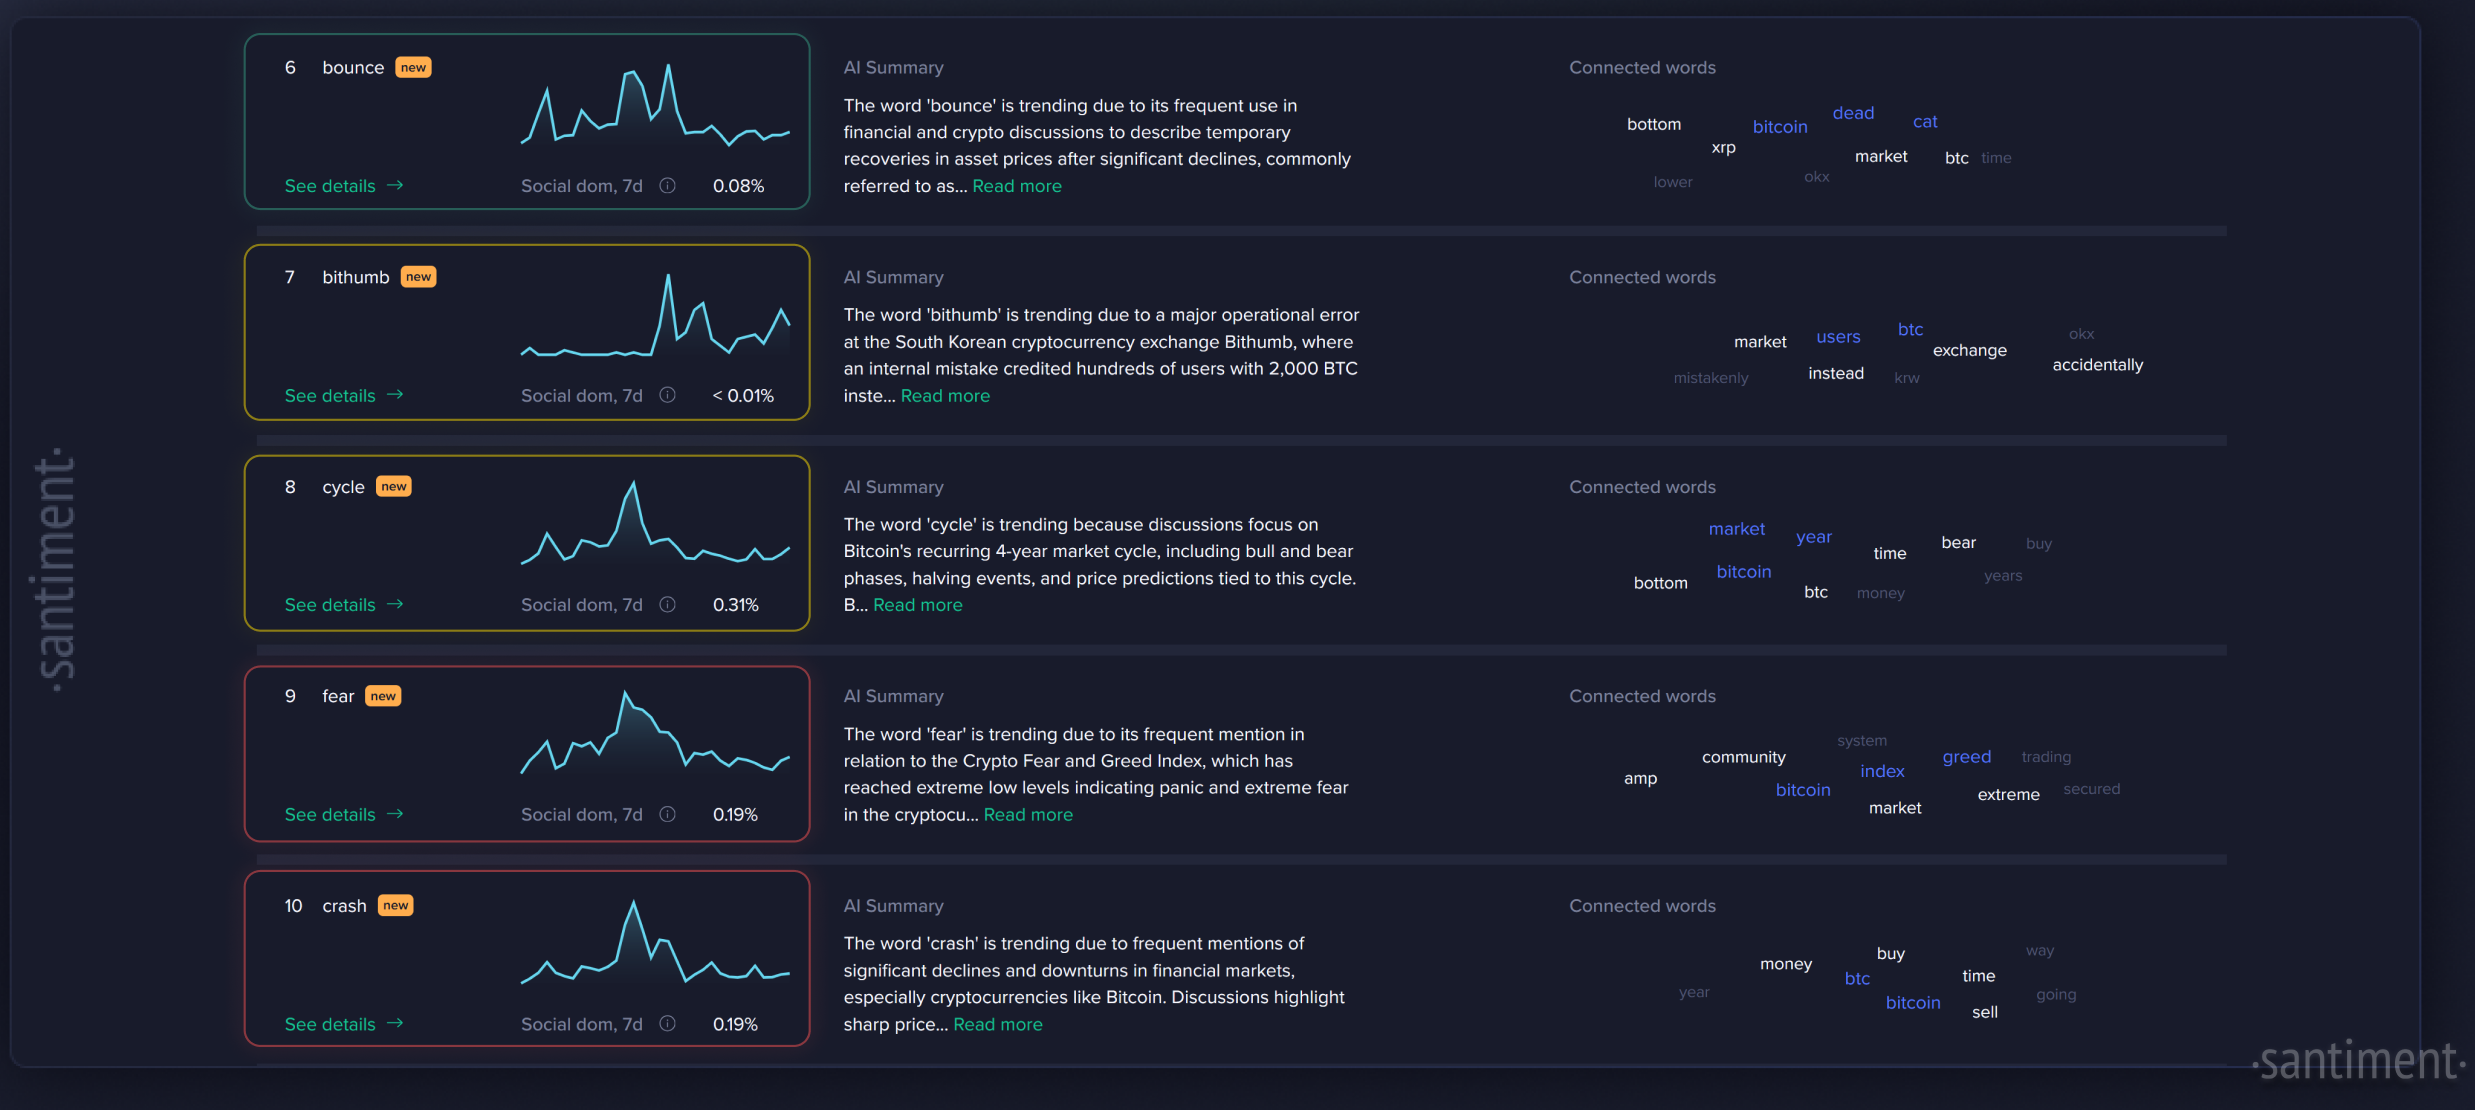
What is arguably a bit more reliable is when you see the mentions of "dip" vs. mentions of a more severe and catastrophic word that is used more rarely, like "crash".
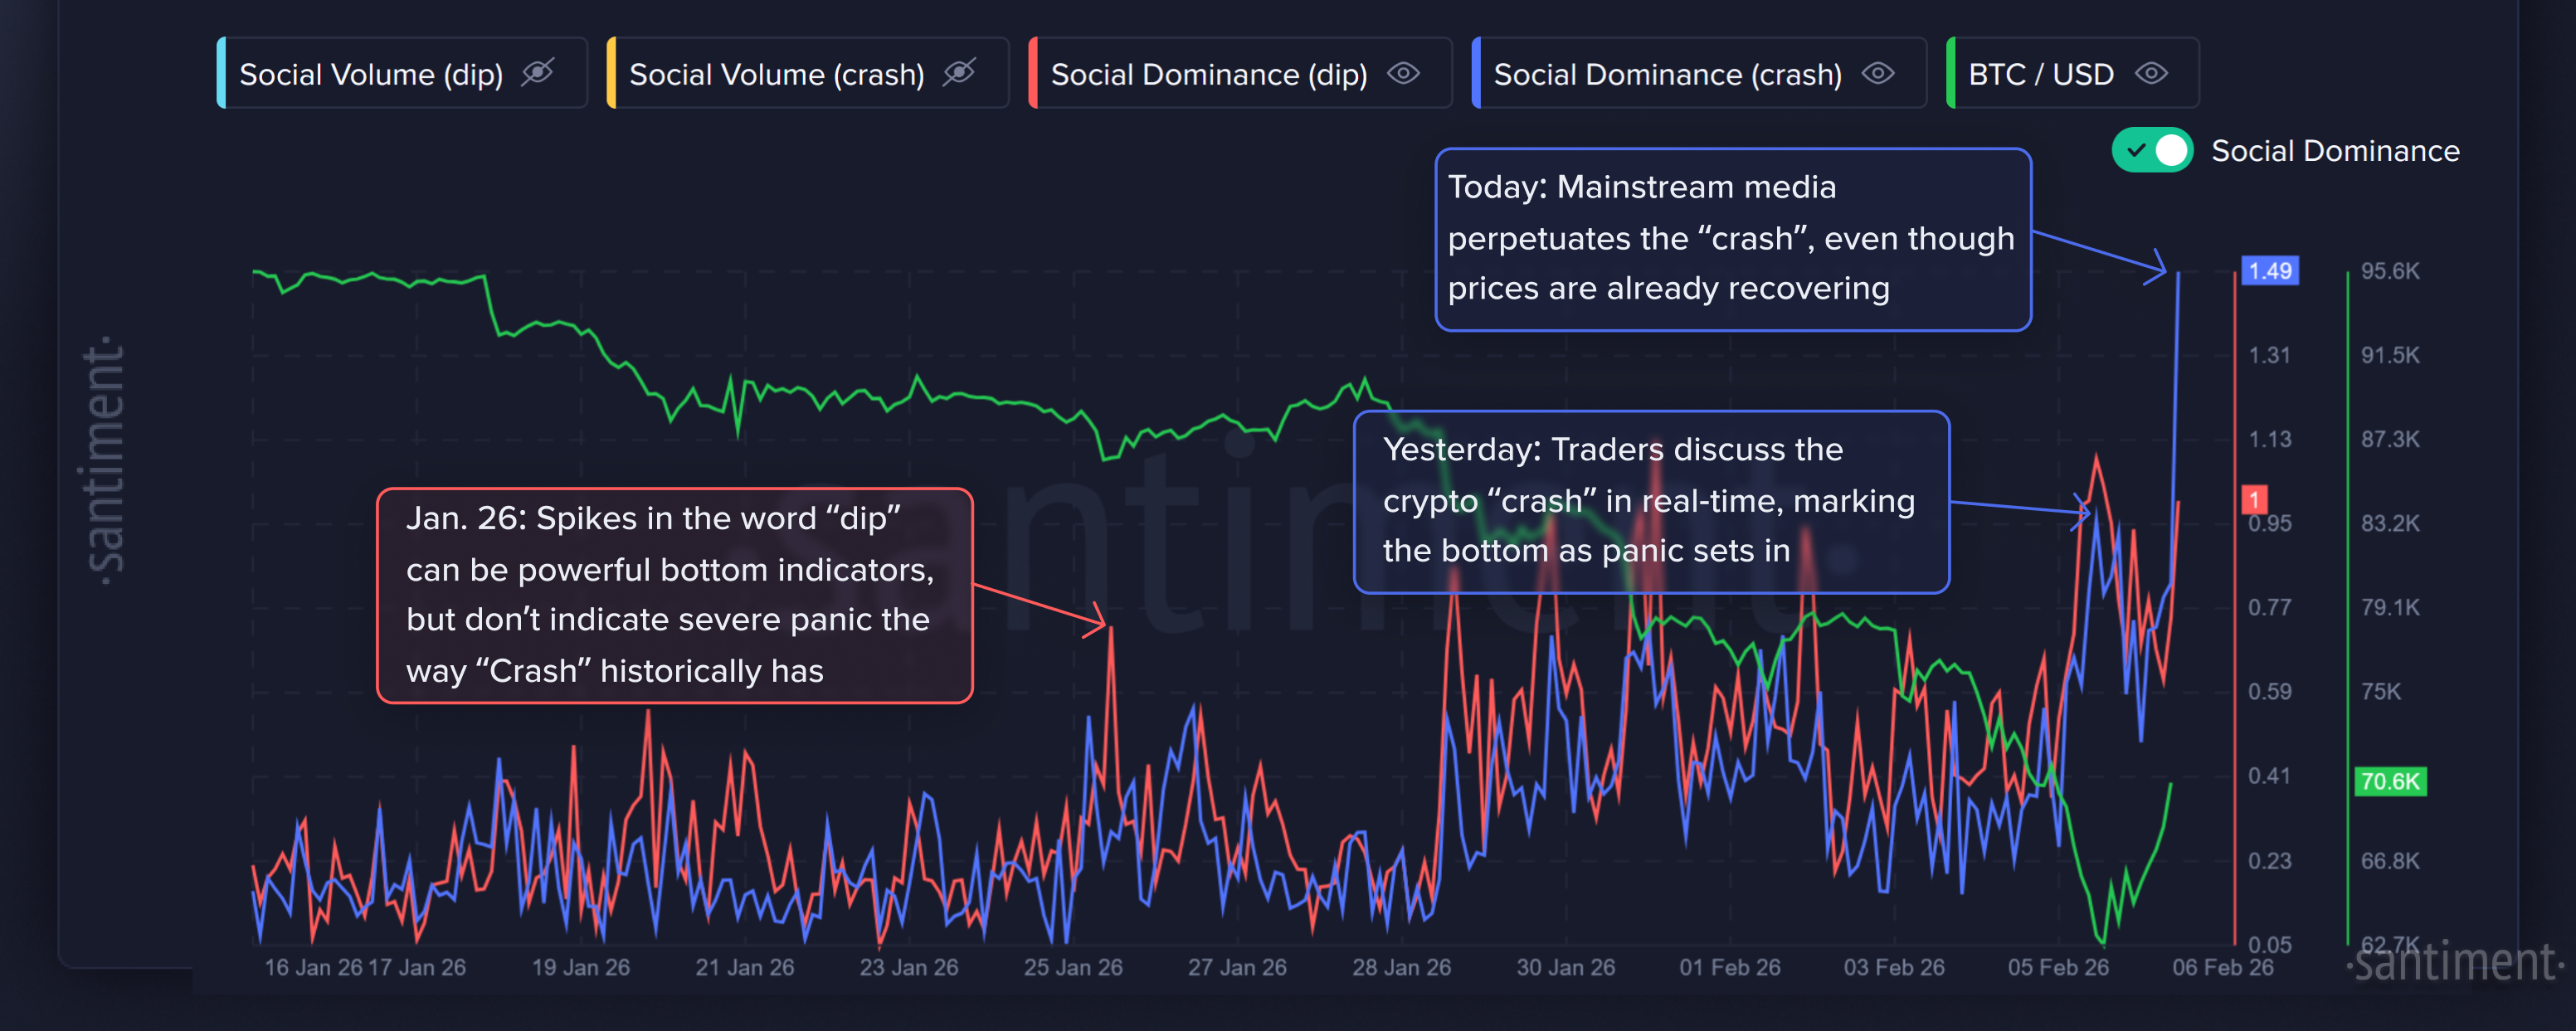
Here, we're specifically looking at the social dominance of the two terms. This makes it more optimized to actually looks at what percentage of overall discussions are related to these terms, rather than just showing when there's more activity and discussions in general on social media (which can be misleading, since this may just be indicating when more people are awake).
But that's not all as far as social trends pages go. You can often refer to the Trending Words or Trending Stories dashboards to find when there are frequent occurrences of words like "down" or "selling", or stories like "going to $0".
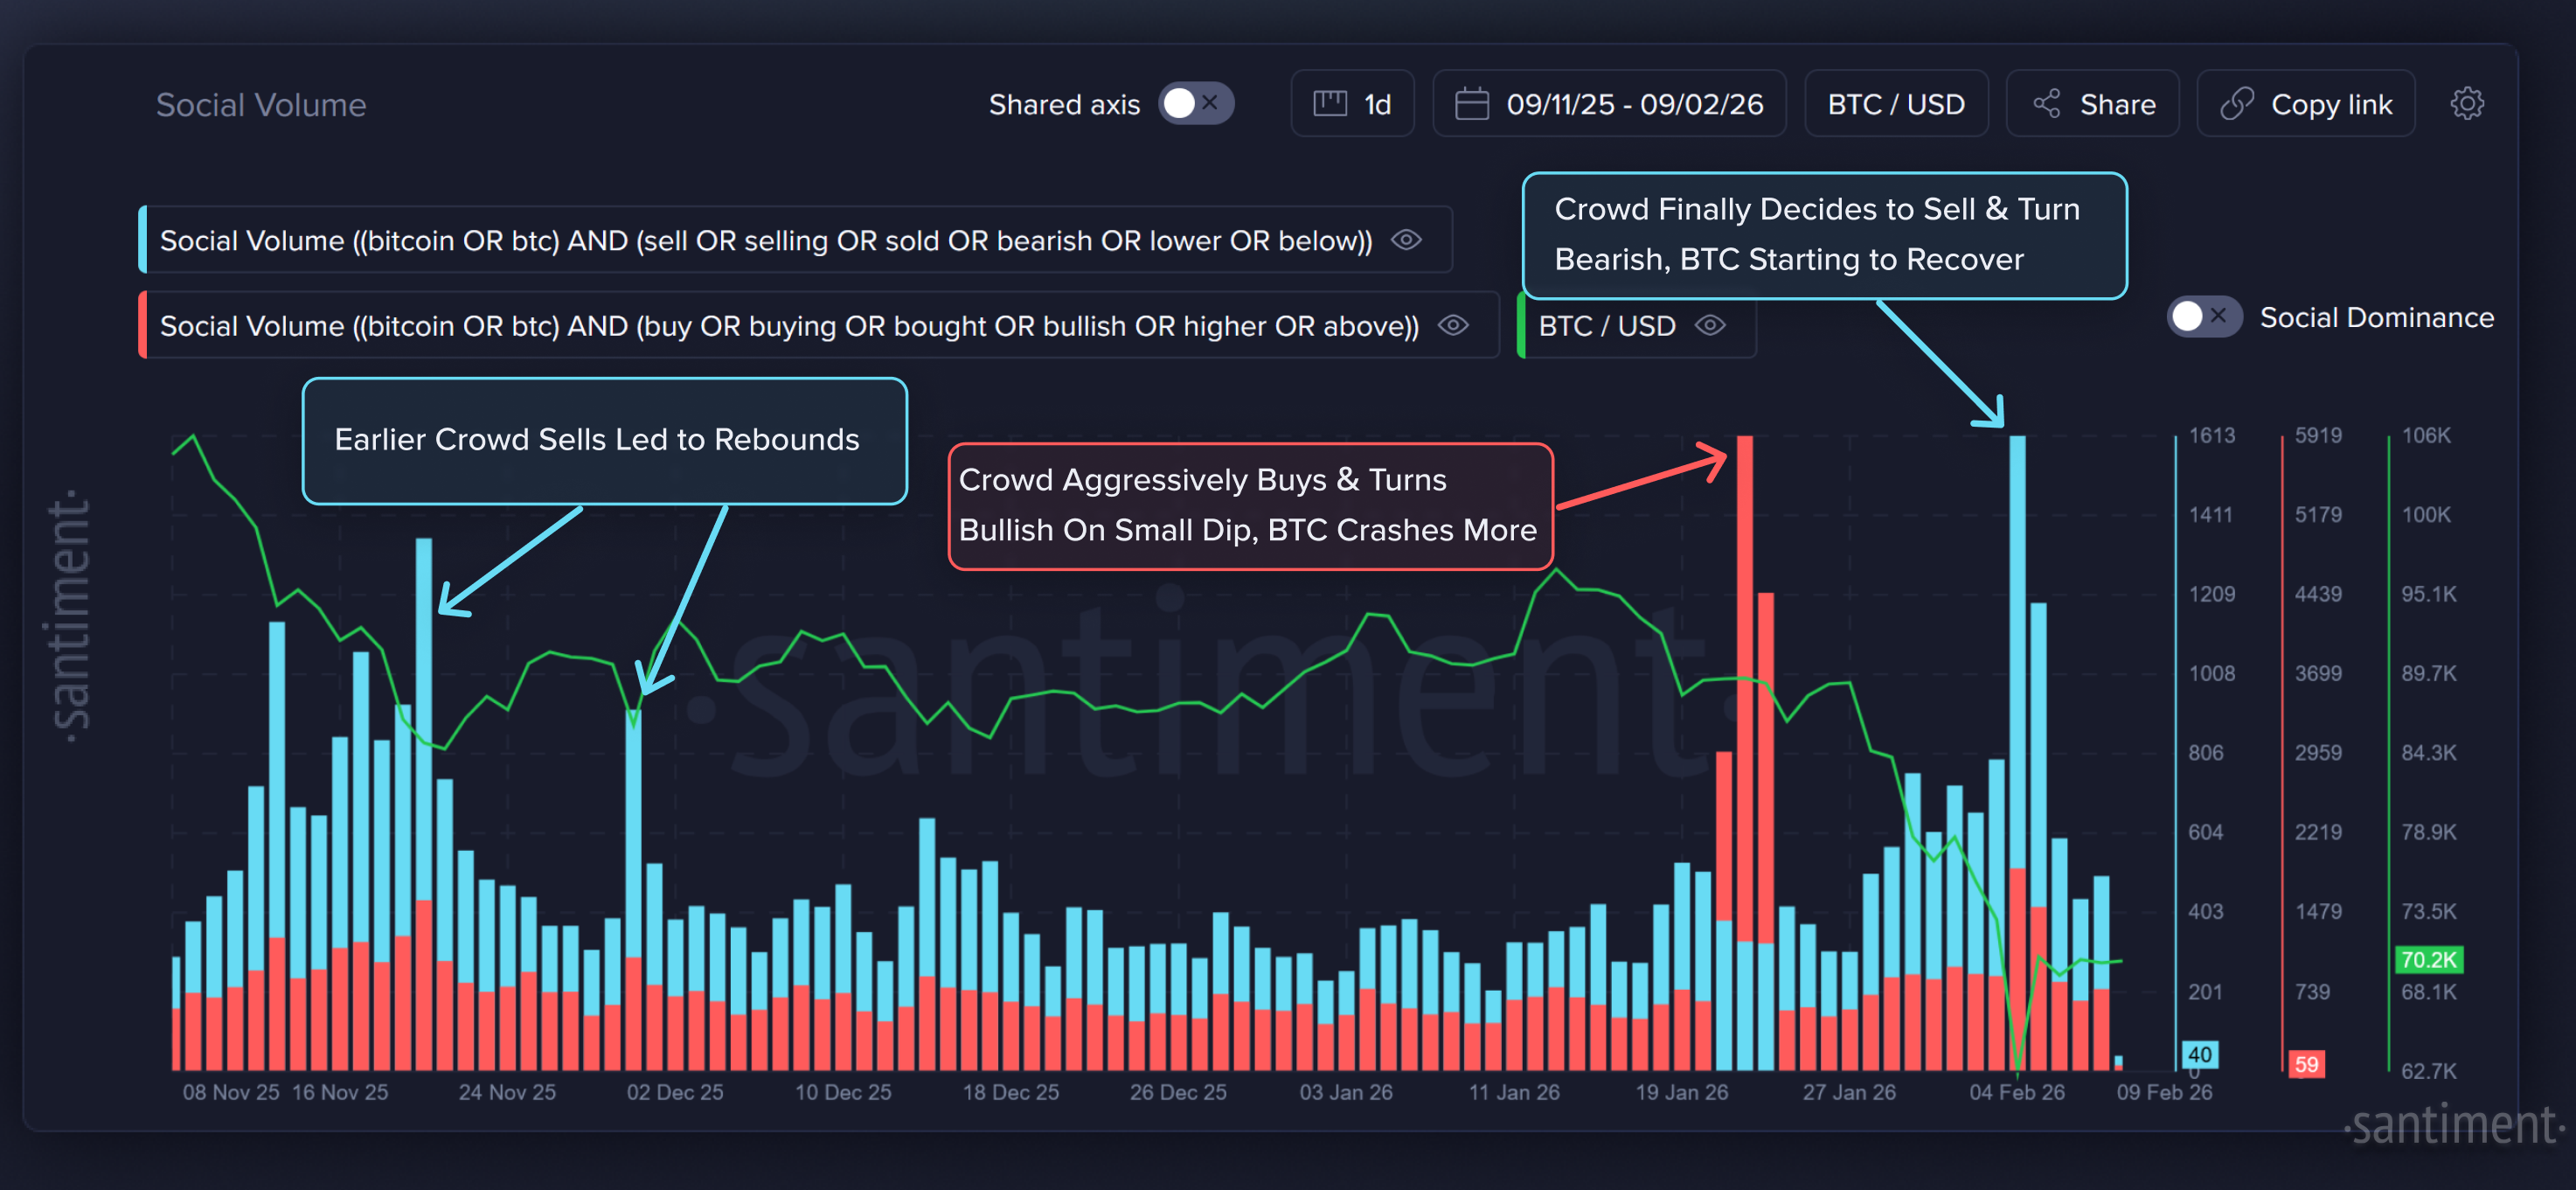
These are clear signs that the fading momentum of markets have been enough to shake retail traders' confidence, and get them to capitulate. And below, we have another way of directly measuring when people are discussing bearish or bullish terms in relation to Bitcoin. You can use this link to see what this below chart looks like any time, and you can also change the "bitcoin or btc" section to another coin of your choice, such as "ethereum or eth":
What about from a mathematical perspective? Can we actually do some blockchain peeking to see when traders are officially "under water" enough for prices to typically rebound reliably? Absolutely, and that's exactly what MVRV (mean value to realized value) measures. Below is the 30-day MVRV's for Bitcoin, Ethereum, Cardano, XRP, and Chainlink. Each color corresponds with average returns from wallets that have been active in the past 30 days:
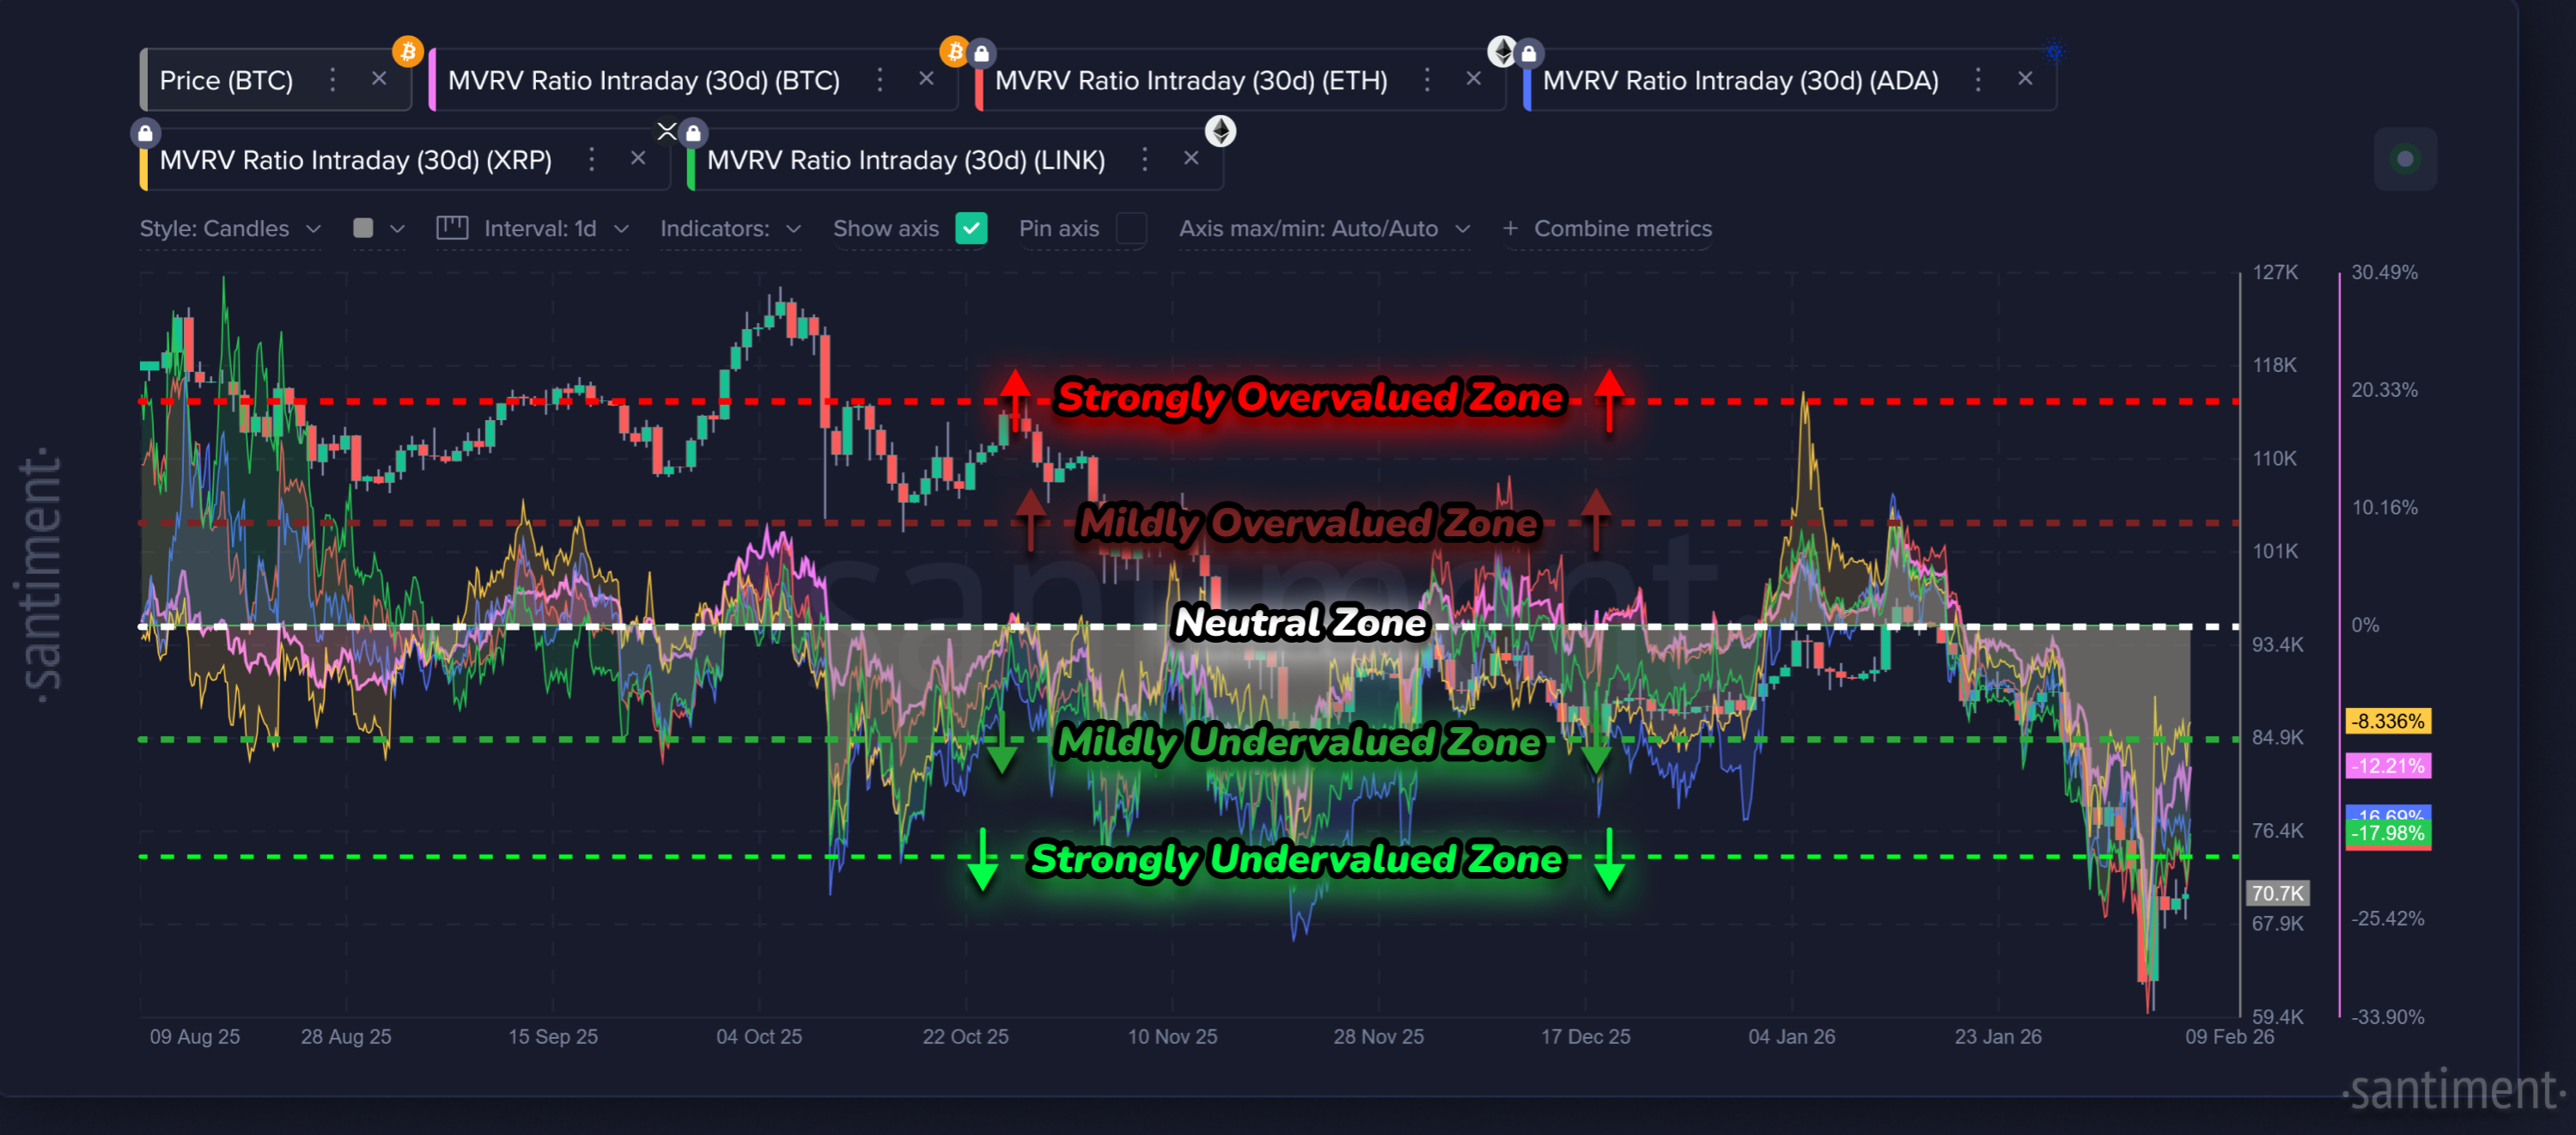
As the "zone" graphics indicate, you typically want to avoid being heavily invested in an asset when it is above the "Strongly Overvalued Zone". But on the flip side, there is great upside to buying while it is below the "Strongly Undervalued Zone". Here, we're not just looking at when prices go up or go down significantly. We're actually measuring when the average wallet (through all of its decisions based on FOMO and FUD) are in extreme territories.
So remember - instead of deciding when to buy dips based on your gut or anecdotal things you just happen to come across, using these many examples are a quick and easy way to use more objective reasoning to come to much more informed and sound conclusions as to when it's actually time to dip your toes back in while coins have been bleeding the way they have been.

-----
Free two-week trials to Sanbase PRO (to access all mentioned Santiment data in this article, and plenty more) are AVAILABLE HERE!
-----
Disclaimer: The opinions expressed in the post are for general informational purposes only and are not intended to provide specific advice or recommendations for any individual or on any specific security or investment product.