Worried Crowd Marked Crypto's Local Bottom Yet Again

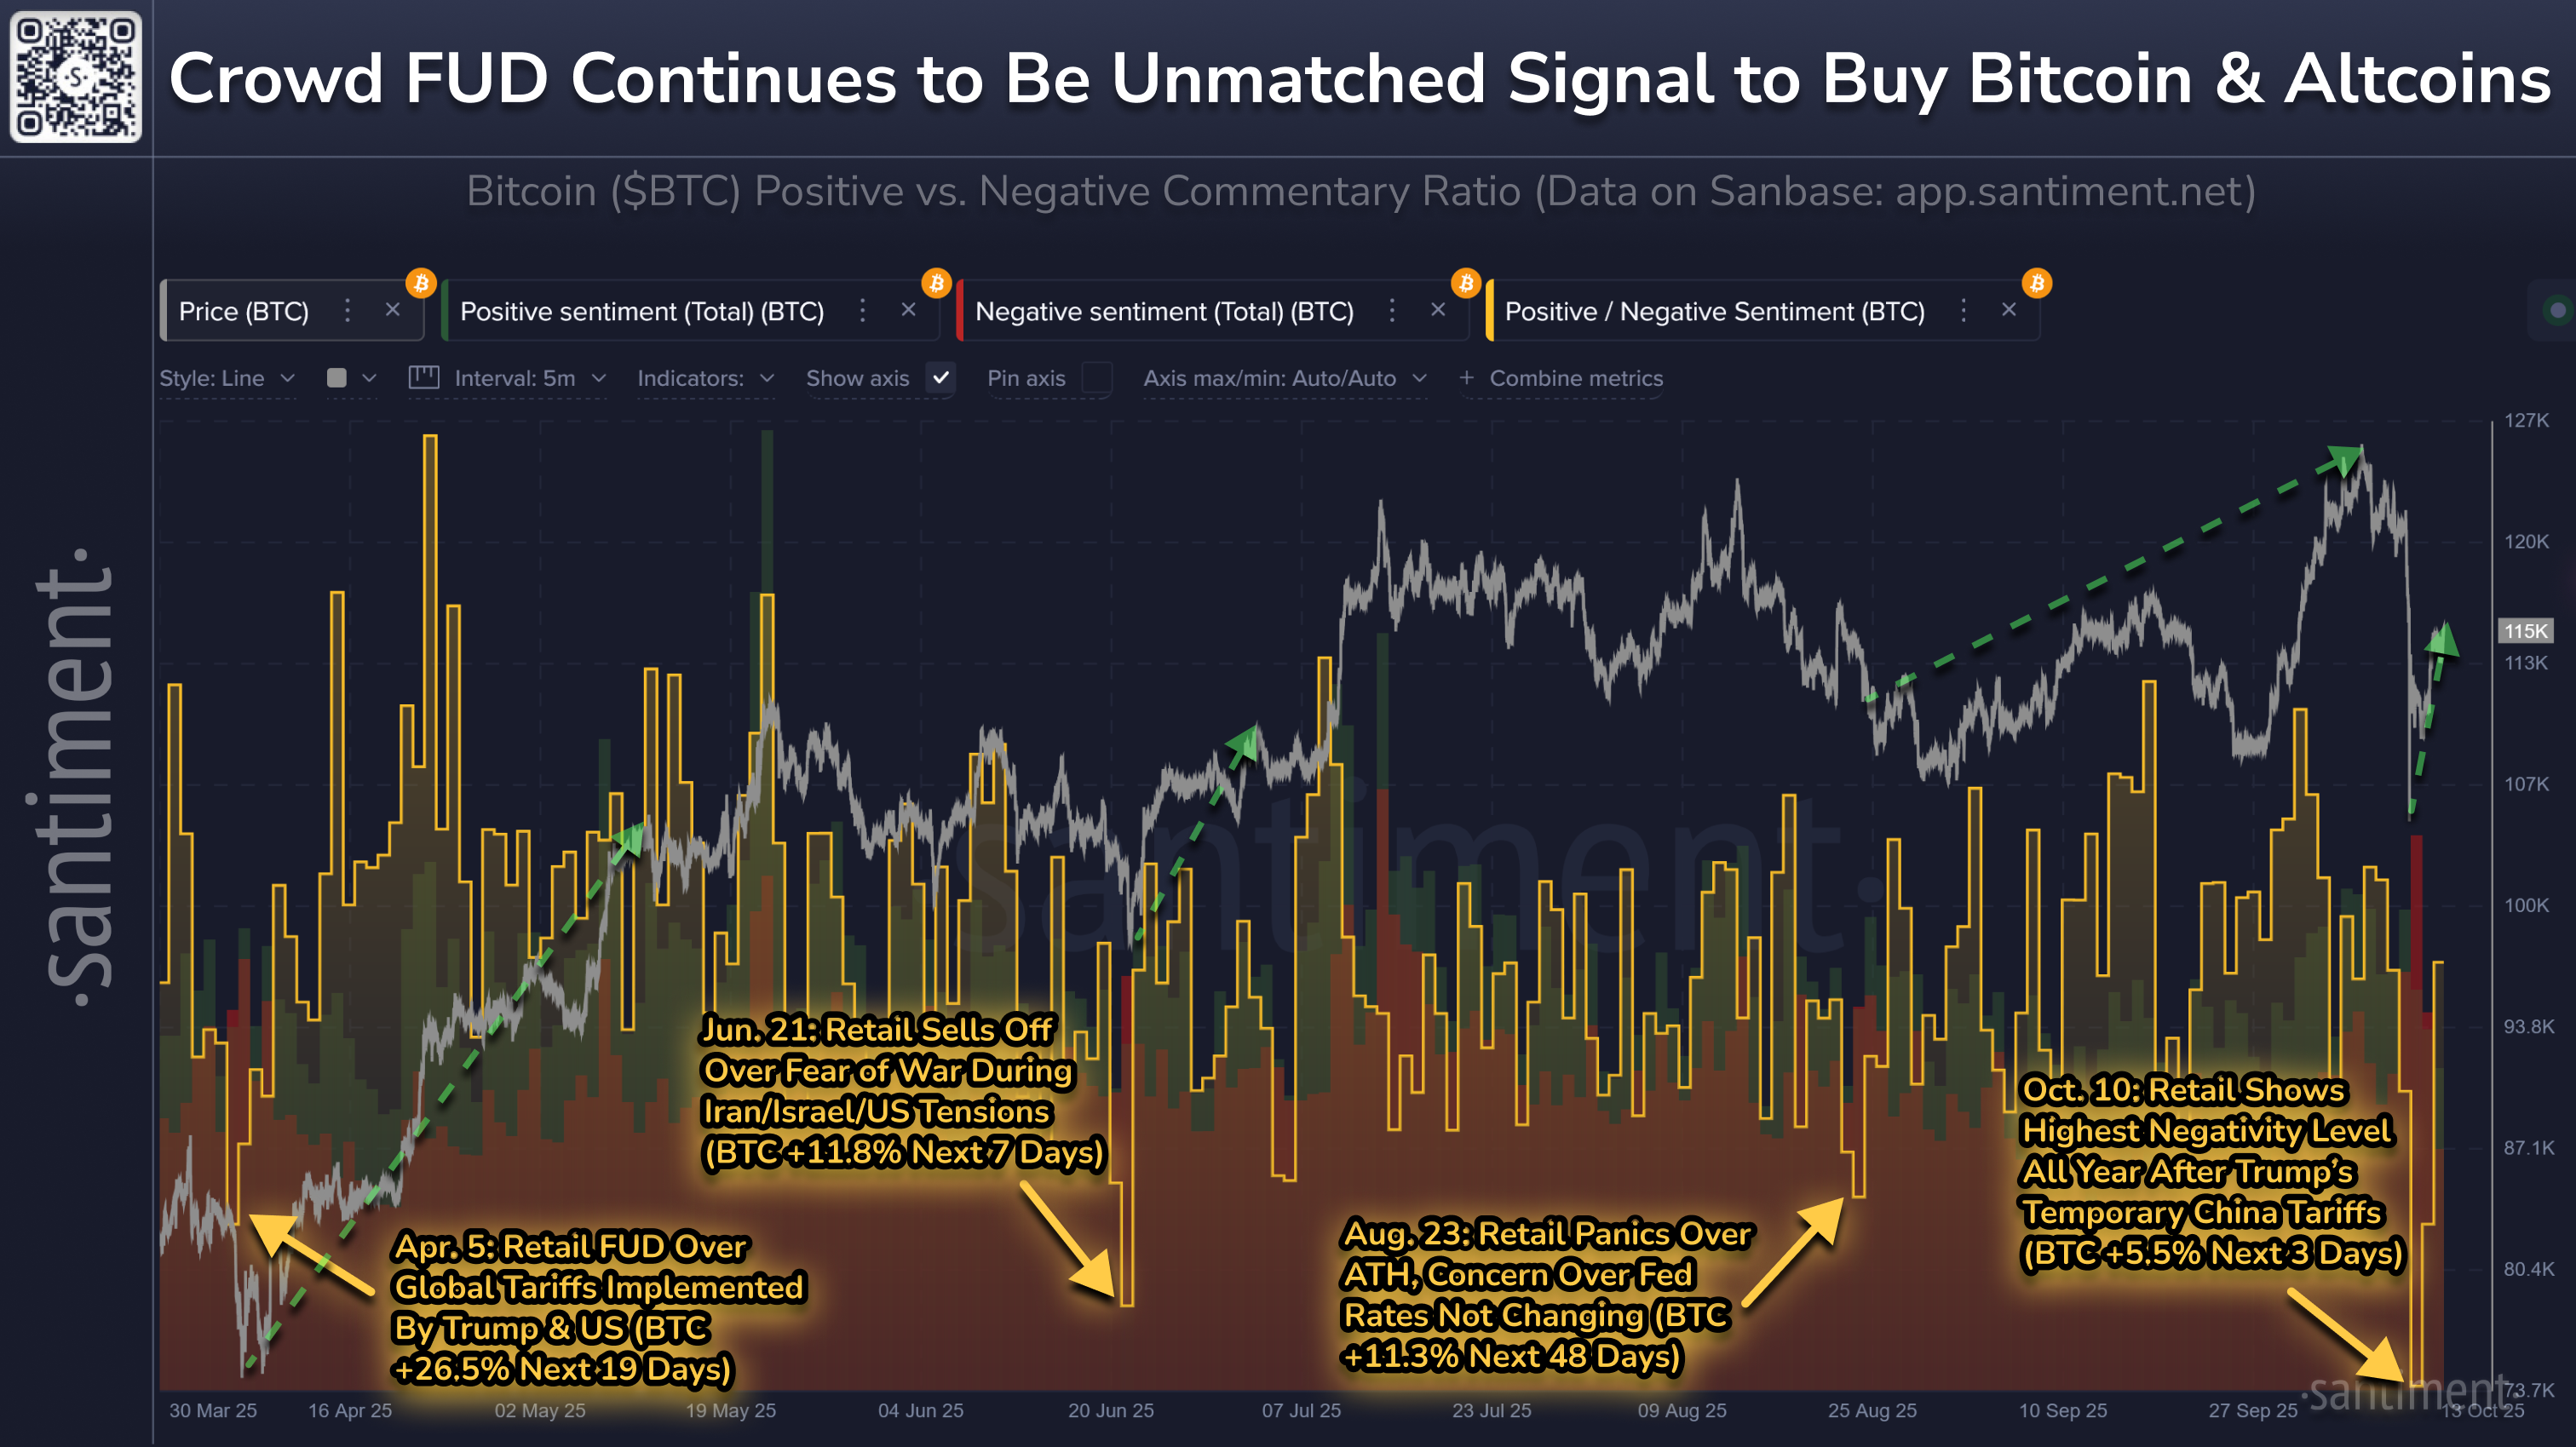
📈 The below chart represents the ratio of all positive vs. negative comments across social media over the past 7 months. We have marked arrows next to the 4 most negative days since March, with the latest one occurring Friday after the US temporarily implemented 100% tariffs on China.
😱 In every one of these cases, FUD took over due to world events that were (in hindsighted) overreacted to from a market perspective. Retail's emotions often dictate that Bitcoin's and altcoins' prices are about to do the opposite. Smart traders scooped up more while the crowd was in panic on each of these dates:
🗓️ April 5th: Retail FUD Over Global Tariffs Implemented By Trump & US (BTC +26.5% Next 19 Days)
🗓️ June 21st: Retail Sells Off Over Fear of War During Iran/Israel/US Tensions (BTC +11.8% Next 7 Days)
🗓️ August 23rd: Retail Panics Over ATH, Concern Over Fed Rates Not Changing (BTC +11.3% Next 48 Days)
🗓️ October 10th: Retail Shows Highest Negativity Level All Year After Trump’s Temporary China Tariffs (BTC +5.5% Next 3 Days)
🔗 Follow along with this link and see when the crowd next gets greedy (marking a sell signal) or fearful (marking a buy signal).