
This Week in Crypto, Full Written Summary: W3 December 2025

Can Ethereum Steal the Spotlight?
Executive Summary
- Bitcoin Shows Weakness, Ethereum Shows Strength: While Bitcoin's on-chain metrics are flashing warning signs, like a steady flow of BTC back to exchanges, Ethereum is telling a different story. Large "whale" investors are actively accumulating ETH, and its network growth has hit a yearly high, suggesting strong underlying fundamentals.
- The Crowd Isn't Scared Enough for a Bottom: Expert analysis from Maksim suggests the market has not yet seen true capitulation. Social channels show a surprising level of optimism, a sign that prices may need to retest recent lows (around $74k for Bitcoin) to shake out overconfident traders before a real recovery can begin.
- An Altcoin Relief Rally Could Be on the Horizon: Many altcoins have been hit much harder than Bitcoin over the past two months, with some down over 50%. If Bitcoin can find a stable price range, these oversold assets could be primed for a significant "catch-up" rally as traders look for opportunities.
Introduction
In their final "This Week in Crypto" stream of 2025, Santiment's data experts Brian and Maksim offered a detailed look at a market in flux. With Bitcoin showing signs of weakness and altcoins bleeding, could Ethereum lead a recovery? Brian and Maksim use Santiment's powerful on-chain and social metrics to look past the noise. They uncover what large "whale" investors are doing, how crowd sentiment is pointing to the next move, and why Ethereum's network activity is telling a very different story from its price.
Weekly Crypto Performance
The market continued its decline on a week-to-week basis. Bitcoin was down nearly 5%, while Ethereum saw a more significant drop of almost 9%. Several altcoins experienced even steeper losses. Aleph Zero (AZERO) and Bittensor (TAO) were both down around 23%. In a rare show of strength, the privacy coin Monero (XMR) was up 5%, going against the overall market trend.
- Key Data: Bitcoin is down almost 5% on the week, while Ethereum is down nearly 9%. Monero is a notable outlier, up 5%.
- Actionable Tip: Look for assets that defy the general market trend. Their relative strength can indicate a strong underlying narrative or community support that is independent of broader market movements.
Social Volume Analysis: Binance Coin and XRP Surge
While discussion around Bitcoin and Ethereum remained steady, other assets saw a major spike in attention. Social Volume for Binance Coin (BNB) and XRP jumped significantly(chart). The overall crypto market cap fell by about 6%, even as trading volume rose by 2%. This indicates that while trading activity is present, it is not translating into positive market growth yet.
- Key Data: The total crypto market cap declined by 6% while trading volume increased by 2%.
- Actionable Tip: Pay attention when trading volume rises while the market cap falls. This divergence suggests that the increased activity is dominated by selling pressure.
Bitcoin On-Chain Analysis: Transaction Volume & Active Addresses
A look at Bitcoin's on-chain data reveals a cooling of network activity. Brian pointed out that transaction volume has been sliding since a large spike in November. Daily active addresses and the number of unique coins moving on the network are also in decline. The one steady metric is network growth, which shows that a normal number of new wallets are still being created daily.
- Key Data: Daily active addresses and on-chain circulation are dropping, but network growth (the creation of new wallets) remains stable.
- Actionable Tip: Stable network growth during a period of low on-chain activity can be a subtle long-term positive. It shows new participants are still entering the ecosystem, even if existing users are temporarily less active.
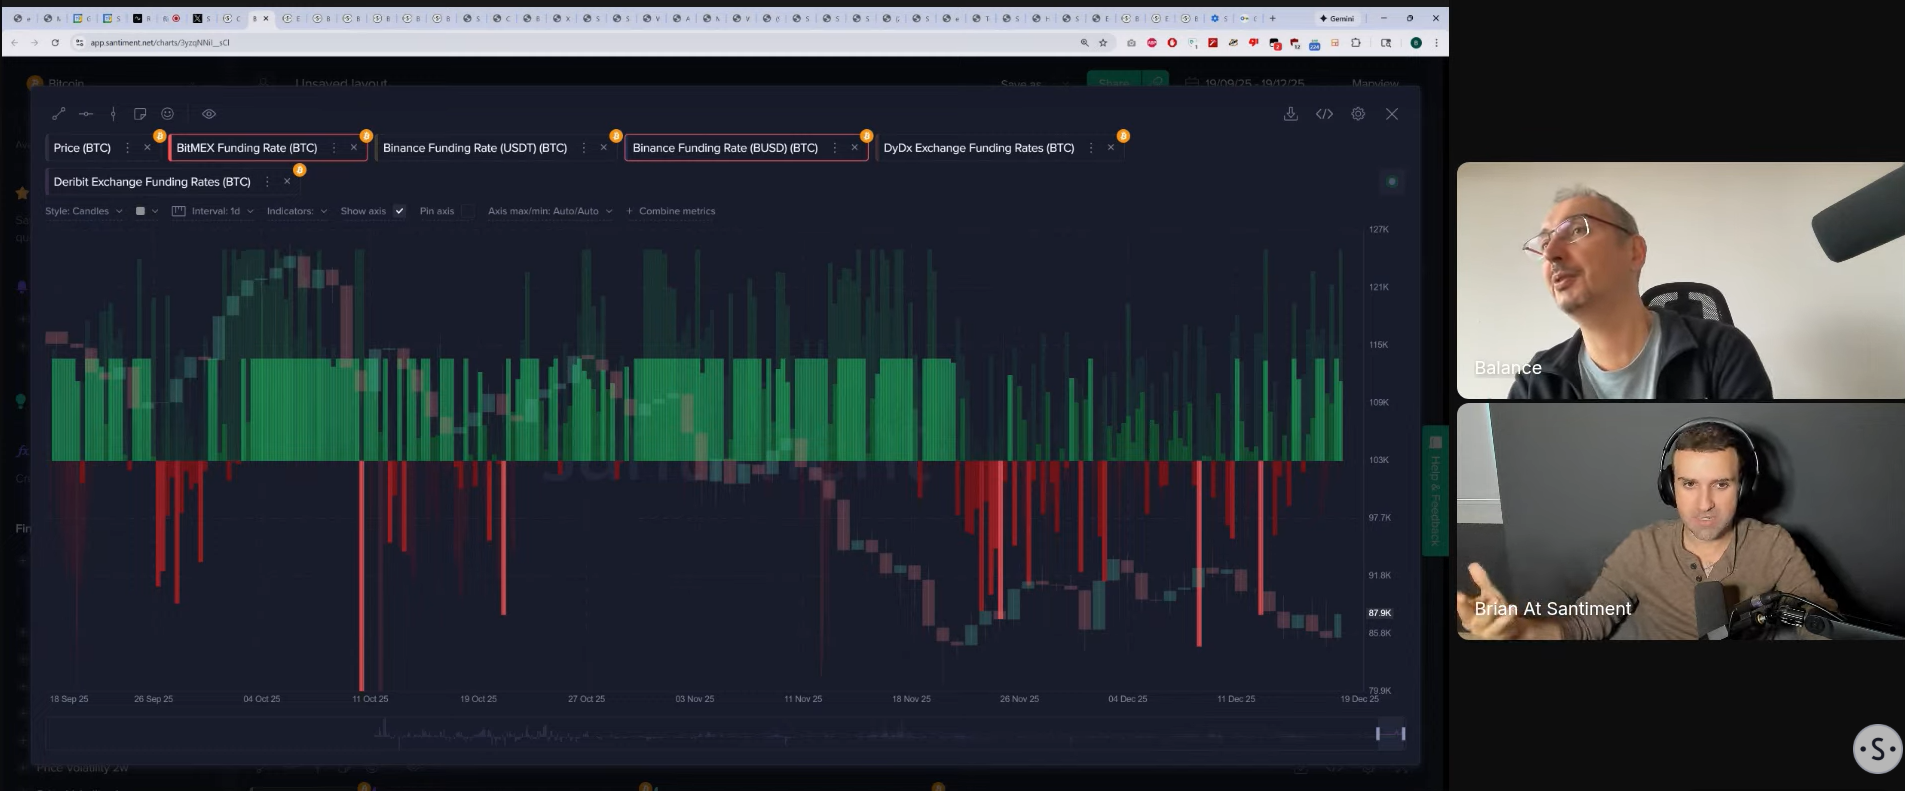
Bitcoin Funding Rates: A Look at Longs vs. Shorts
Funding rates, which indicate whether traders are betting on prices to rise (longs) or fall (shorts), show a slight bias towards longs(chart). Brian noted this is not an ideal sign for a rally. He explained that strong price rebounds are often fueled by "short squeezes," where a rising price forces traders betting against the market to close their positions, adding upward momentum. The current data shows a lack of this short-side pressure.
- Key Data: Funding rates, especially on Binance, are showing more traders are longing (betting on price increases) than shorting.
- Actionable Tip: An excess of long positions can signal overconfidence and act as fuel for a downward move. Watch for a shift toward neutral or negative funding rates, which often creates a healthier setup for a sustainable price rally.
Whale Activity: Tracking Large Bitcoin Transactions
The activity of large Bitcoin holders, or "whales," presents a mixed picture. Transactions worth $1 million or more recently hit a four-week high, suggesting some very large players made moves. However, transactions in the $100k+ range have been declining. This suggests that while the largest whales were active, the next tier of large holders has been quieter.
- Key Data: There were 4,394 transactions of $1 million or more on December 17th, a four-week high (chart).
- Actionable Tip: Differentiate between whale tiers. A spike in $1M+ transactions without a corresponding rise in $100k+ transactions might indicate moves by a few very large entities rather than a broad accumulation trend.
Bitcoin Supply on Exchanges: Potential Warning Signs?
One of the biggest concerns Brian highlighted was the flow of Bitcoin back to exchanges. Over the past 10 days, a net total of over 17,700 BTC has moved onto exchange wallets. Historically, an increase in exchange supply can be a bearish signal, as it may indicate that holders are preparing to sell. This is a key metric to watch closely (chart).
- Key Data: The percentage of Bitcoin's supply on exchanges has risen from 6.03% to 6.12% in the last 10 days.
- Actionable Tip: Track the net flow of coins to and from exchanges. A sustained increase in supply held on exchanges is often a precursor to increased sell-side pressure and price volatility.
Bitcoin Sentiment Analysis: Positive vs. Negative Commentary
Crowd sentiment surrounding Bitcoin is currently neutral(chart). The ratio of positive to negative comments is about 1.29 to 1, landing in the middle of the spectrum. Brian and Maksim discussed that market bottoms are often formed when sentiment becomes extremely negative. The current readings do not show the widespread fear that typically precedes a major price reversal.
- Key Data: The ratio of positive to negative comments about Bitcoin is currently 1.29 to 1, indicating a neutral sentiment.
- Actionable Tip: Extreme sentiment readings are more reliable signals than neutral ones. Look for moments of widespread fear (a high ratio of negative comments) as potential indicators of a market bottom.
(21:10) Expert Analysis: Is the Market Nearing a Bottom?
Maksim shared his analysis, stating that while the market seems close to finishing its downward move, he has not yet seen true capitulation. He observed that traders in some social channels remain surprisingly optimistic, discussing potential rate cuts. This lack of fear suggests the market may not have found its final bottom.
- Key Data: Maksim observes that discussions in retail-dominated channels are focused on bullish news like potential rate cuts, not on fear or panic.
- Actionable Tip: Gauge the sentiment in retail-heavy communities. A lack of fear during a downturn suggests the market may need to fall further to shake out weak hands before a true bottom is formed.
Technical Analysis: Bitcoin's Potential Retest of $74k
Maksim outlined a potential scenario for the coming days. He believes the market could see a small price increase to build trader confidence before dropping again to retest the recent low near $74,000. He noted that the crowd's reaction to this retest would be a critical indicator. Widespread panic would be a bullish sign, while a confident "buy the dip" reaction would be a cause for concern.
- Key Data: The key support level from mid-November that the market may retest is around $74,000.
- Actionable Tip: When a key support level is tested, the market's reaction is more important than the price itself. Observe social volume and sentiment during the retest to understand the crowd's conviction.
A Closer Look at Social Sentiment Metrics
Brian and Maksim explained the different ways to measure sentiment. They noted that while some metrics show slightly negative readings, they are not at the extreme levels that provide strong signals. For now, the simple ratio of positive to negative comments tells a clearer story: the crowd is neither excessively fearful nor overly greedy.
- Key Data: The weighted sentiment metric is currently near zero, which is considered "noise" and not a strong directional signal.
- Actionable Tip: Understand the purpose of different sentiment metrics. A simple positive vs. negative ratio is useful for a general mood check, while weighted sentiment is designed to spot major, statistically significant extremes.
Ethereum Whale Accumulation: A Bullish Divergence?
The data for Ethereum tells a more optimistic story. Brian highlighted a clear trend of accumulation among large holders. Wallets holding between 1,000 and 1 million ETH have been steadily increasing their balances since mid-November(chart). At the same time, smaller retail-sized wallets have been selling. This divergence, where smart money appears to be buying from smaller holders, is often considered a bullish signal.
- Key Data: Wallets holding between 1,000 and 1,000,000 ETH are accumulating, while smaller wallets are selling off their holdings.
- Actionable Tip: Look for divergences between different holder tiers. When large wallets ("smart money") are buying what smaller wallets ("retail") are selling, it can be a strong indicator of a potential trend reversal.
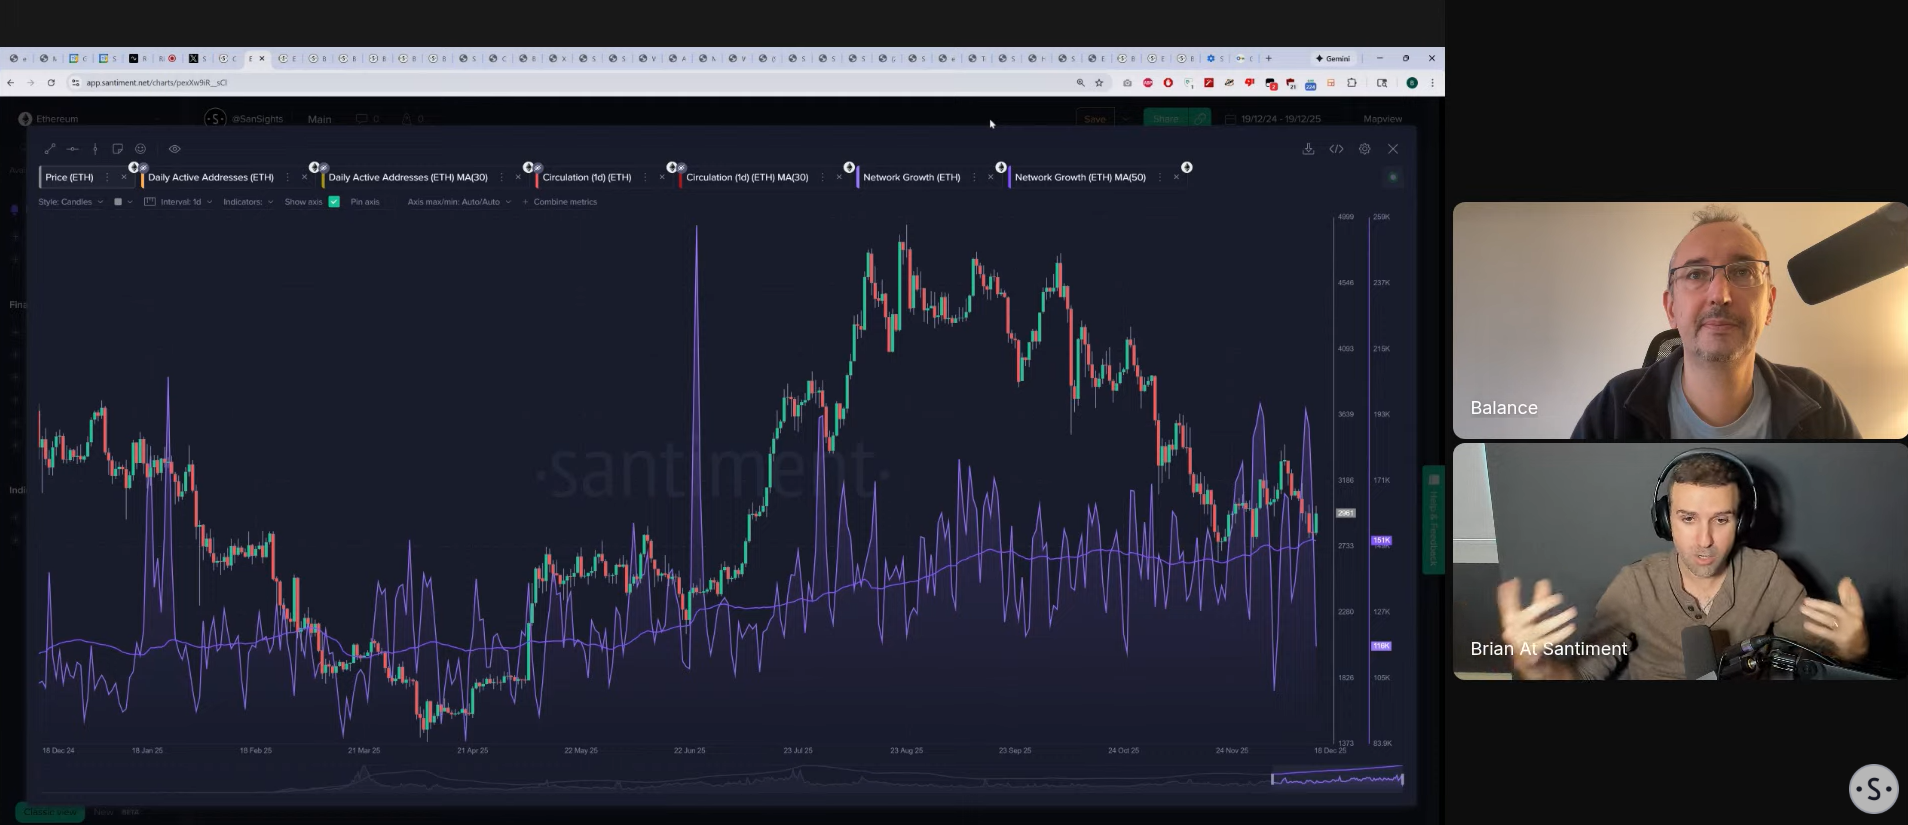
Ethereum's Network Growth Hits Yearly High
Another positive sign for Ethereum is its network growth. The 50-day average of new addresses being created is at its highest point of the year. Brian pointed out that a similar large spike in network growth occurred in mid-2025, just before Ethereum's price doubled in a massive two-month rally. This suggests growing underlying adoption and utility.
- Key Data: Ethereum's network saw two recent daily spikes of nearly 200,000 new addresses, and the 50-day moving average for network growth is at a yearly high.
- Actionable Tip: A spike in new address creation, especially during a price decline, can be a powerful leading indicator of growing user adoption that may precede future price growth.
Crowd Sentiment on Bitcoin: Consistently Wrong?
A powerful contrarian indicator is the social discussion of "higher" versus "lower" price targets. Brian showed a chart demonstrating that the crowd has been consistently wrong. Mentions of "higher" peaked at recent price tops, while calls for "lower" spiked at the exact bottoms. This pattern shows the value of tracking crowd expectations as a tool to gauge market turning points.
- Key Data: Social mentions of "higher" peaked at the December 9th top, while mentions of "lower" spiked at the December 5th and 15th bottoms.
- Actionable Tip: Use social mentions of price direction ("higher," "lower") as a contrarian indicator. When the crowd is overwhelmingly calling for one direction, the market often moves the other way.
Top Crypto News: Japan's Rate Hike and US Inflation
The hosts touched on key macroeconomic news impacting the markets. Japan raised its interest rates to combat inflation, a move that could tighten global liquidity. In the US, the latest CPI inflation report came in lower than expected. Lower inflation is generally seen as a positive for risk assets like crypto, though the market's initial reaction was muted.
- Key Data: The latest US CPI inflation report came in at its lowest level since 2021.
- Actionable Tip: Observe the market's sustained reaction to major economic news rather than the initial price spike. "Sell the news" events are common, where the market moves opposite to what the news would suggest.

The Case for a Mini Altcoin Rally
Brian discussed the possibility of an altcoin recovery based on "regression to the mean." Since Bitcoin's all-time high in October, many altcoins have fallen much more severely. For example, Cardano has lost 57% of its value. If Bitcoin can find stability and avoid further sharp drops, these heavily sold-off altcoins may have room for a significant relief rally.
- Key Data: Since October, Cardano (ADA) has lost 57% of its value, compared to Bitcoin's ~30% drop.
- Actionable Tip: When Bitcoin's price stabilizes after a major drop, look for altcoins that have underperformed significantly. They may be candidates for a strong "catch-up" rally as capital rotates back into the market.
End-of-Year Crypto Market Probabilities
Looking ahead, Brian noted that late December is often a weak period for crypto due to tax-related selling. However, since Bitcoin is down for the year, there is less profit-taking pressure. This year, the typical sell-off may not happen. Maksim concluded by reiterating his expectation that the market will likely retest its recent lows before finding a convincing bottom.
- Key Data: Bitcoin is down 5.5% year-to-date in 2025.
- Actionable Tip: Consider historical seasonal trends, but always factor in the current year's context. The lack of widespread profits in 2025 may mean the typical year-end selling pressure will be much weaker than in previous bull years.
Conclusion
This week's analysis reveals a divided market. Bitcoin faces concerning on-chain trends like rising exchange supply, while Ethereum shows underlying strength through whale accumulation and record network growth. The key takeaway is that looking at data, not just price, provides a much clearer picture of the market's health. By understanding crowd sentiment and whale behavior, investors can better prepare for what's to come.
To get all the details and see the charts for yourself, watch the full livestream. For more data-driven crypto analysis, subscribe to our YouTube channel, our Substack, or follow us on Santiment Insights.