This Week in Crypto, Full Written Summary: W2 November


Bitcoin Hits 6-Month Low: Are We at the Bottom?
Executive Summary
In a market described as a "bloodbath," Bitcoin has fallen to a six-month low, triggering widespread fear. This summary breaks down the key data points suggesting a bottom may be forming, even as the crowd remains cautiously optimistic.
- Peak Fear is Here: Social media sentiment has turned extremely negative, and the "buy the dip" narrative is fading—classic signs that often precede market reversals.
- Whales Are Selling to Retail: Large Bitcoin holders continue to sell their coins, while smaller retail investors are buying the dip. This trend will likely need to reverse before a sustainable bottom is in.
- Key Metrics Signal Opportunity: On-chain indicators like the MVRV ratio are at their lowest levels in over eight months, signaling that traders are experiencing significant pain, which has historically marked prime buying zones.
- Contrarian Signals Flash Green: Bitcoin ETFs have seen nearly $1 billion in outflows, and the market is actively blaming figures like Michael Saylor for the crash. Both are strong contrarian indicators that capitulation is underway.
Introduction
In the latest "This Week in Crypto" livestream, Brian and Maksim analyzed a crypto market in a "legitimate bloodbath." With Bitcoin tumbling to its lowest price in six months, the duo set aside emotion to examine what the data is telling us. They explored key on-chain metrics, social media sentiment, and developing narratives to find clues about where the market might be headed. From Michael Saylor's controversial wallet movements to a record-breaking ETF launch, this session provided a clear, data-driven look at the chaos.
(0:21) - Crypto Bloodbath: Bitcoin Hits a 6-Month Low!
The stream opened by addressing the severe market downturn. Brian described the situation as a "bloodbath," with Bitcoin dropping to the $95,000 level. This marks the lowest price for the top crypto asset since early May, representing a significant six-month low. The hosts established their goal for the discussion: to use a mathematical, unemotional approach to understand the market's reaction and identify potential next steps.
- Key Data: Bitcoin's price hit the $95,000 level, its lowest point since early May.
- Actionable Tip: In volatile markets, establish a clear strategy based on data rather than reacting emotionally to sharp price drops.

(2:49) - The "Buy the Dip" Narrative is Fading. What's Next?
Maksim highlighted a critical shift in social sentiment. The conversation around "buying the dip" is becoming less dominant with each new price low. He explained that this is a constructive sign for a potential bottom. Market lows often form when optimistic narratives like this fade and are replaced by fear or apathy.
- Key Data: Social dominance for "buy the dip" fell from 1.27% during the first major dip to just 0.65% on the most recent one.
- Actionable Tip: Track the decline in popular bullish terms on social media; a lack of interest can signal that market sentiment is nearing a point of capitulation.
(4:14) - Did Michael Saylor Secretly Sell His Bitcoin?
A new narrative is forming around MicroStrategy's Michael Saylor. Maksim noted that rumors of Saylor selling a large amount of Bitcoin are circulating. While Saylor has denied these claims, the story is gaining traction. Such narratives are important because they can provide the market with a reason to justify further price drops, and the hosts are watching to see if this one sticks.
- Key Data: A powerful narrative is forming around Michael Saylor and MicroStrategy, fueled by rumors of large Bitcoin sales.
- Actionable Tip: Pay attention to emerging narratives that the market uses to explain price action, as they reveal the crowd's underlying psychological state.

(7:11) - Are There Any Longs Left to Liquidate?
Maksim observed that the recent price drops have not caused the massive liquidations seen in previous downturns. He pointed out that open interest for perpetual contracts is now a fraction of what it was a month ago. This suggests the market may have exhausted the supply of over-leveraged long positions to liquidate, which could change the market's internal dynamics.
- Key Data: Open interest for perpetual contracts is a fraction of its level from one month ago.
- Actionable Tip: Watch liquidation data. A lack of significant liquidations on down moves can indicate that much of the leverage has already been flushed out of the system.
(9:40) - Is Bitcoin's Drop Below $100k Triggering Mass Fear?
Brian discussed the psychological weight of Bitcoin falling below the $100,000 mark. This breach has predictably sparked a wave of fear across the market. He noted that some "smarter stakeholders" appear to be targeting price levels around $90,000 for Bitcoin, which would likely coincide with Ethereum falling below its own key support at $2,900.
- Key Data: Bitcoin breached the key psychological support level of $100,000.
- Actionable Tip: Identify major psychological price levels for key assets, as breaches often trigger oversized emotional reactions from the market.
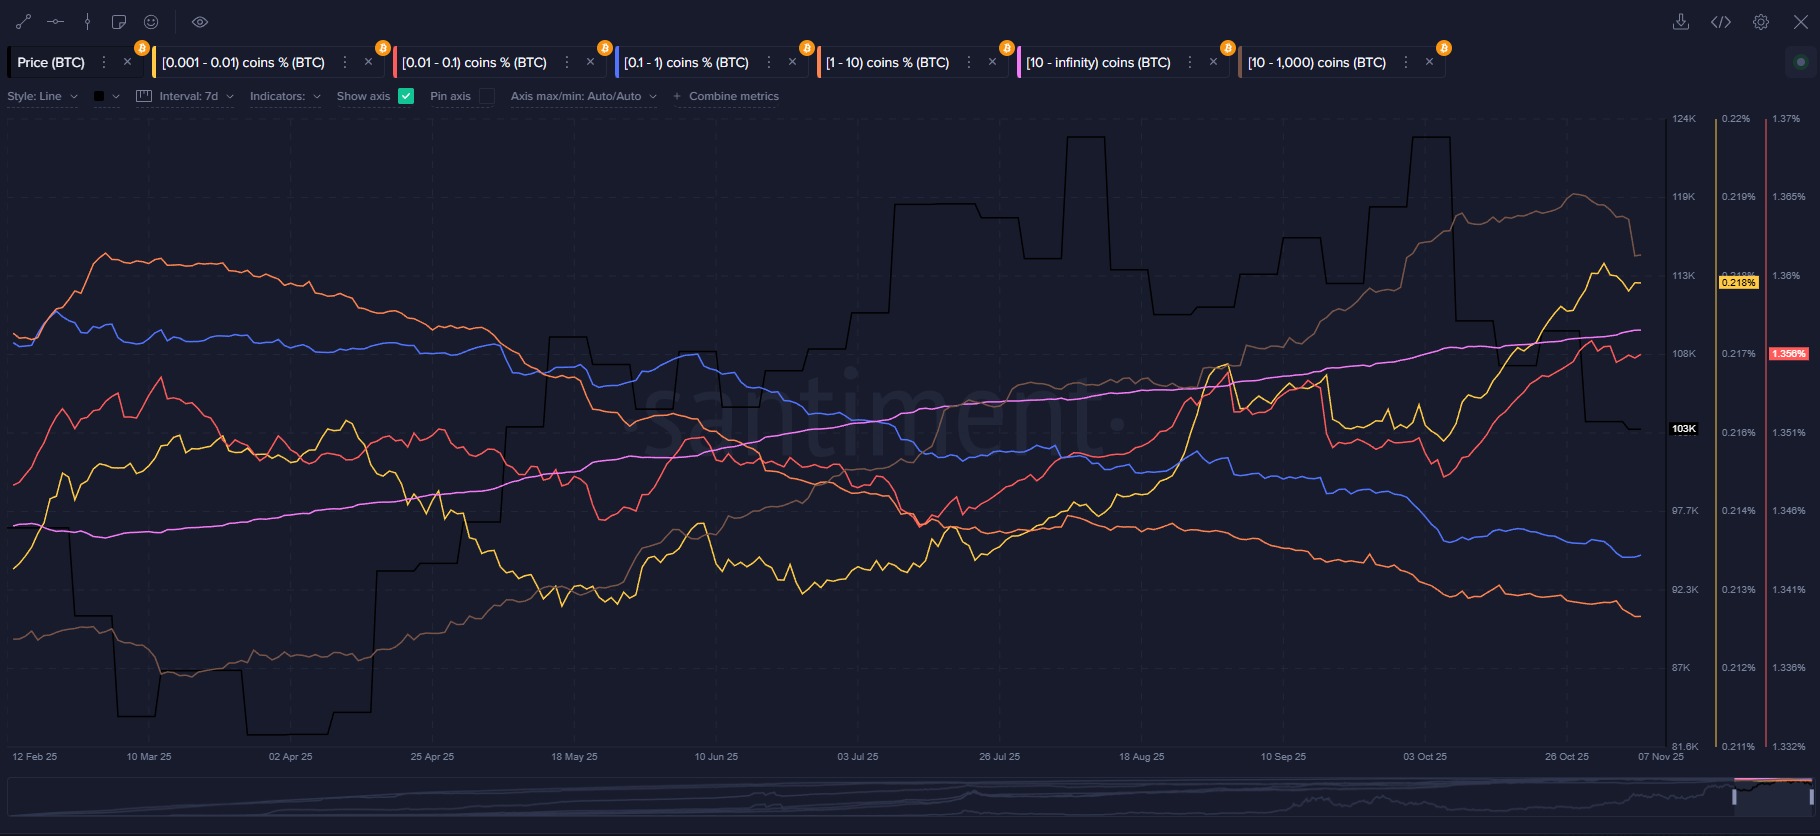
(11:42) - Whales vs. Retail: Who is Winning This Downturn?
A look at BTC wallet holdings(Chart) reveals a clear divergence in behavior. Brian showed that large stakeholders (wallets holding 10 to 10,000 BTC) have been steadily selling since the all-time high in October. Meanwhile, small retail wallets have continued to accumulate during the drop. A true bottom signal would likely involve a reversal of this pattern.
- Key Data: Wallets holding 10 to 10,000 BTC have offloaded over 0.4% of the total Bitcoin supply since the all-time high.
- Actionable Tip: Compare the behavior of large whale wallets against small retail wallets. Accumulation by whales during a downturn is often a strong signal of a potential reversal.
(14:13) - MVRV Signals a Historic Buy Opportunity
The Market Value to Realized Value (MVRV) ratio is flashing compelling signals. Brian explained that the 30-day MVRV for Bitcoin has fallen to -10% for the first time in eight months. This indicates that short-term traders are, on average, deep in the red. Historically, such high levels of trader pain have corresponded with lower-risk buying zones.
- Key Data: The 30-day MVRV for Bitcoin is at -10%, a level not seen in eight months.
- Actionable Tip: Use the MVRV ratio to gauge average trader profitability. Values deep in the negative territory historically indicate lower-risk entry zones.
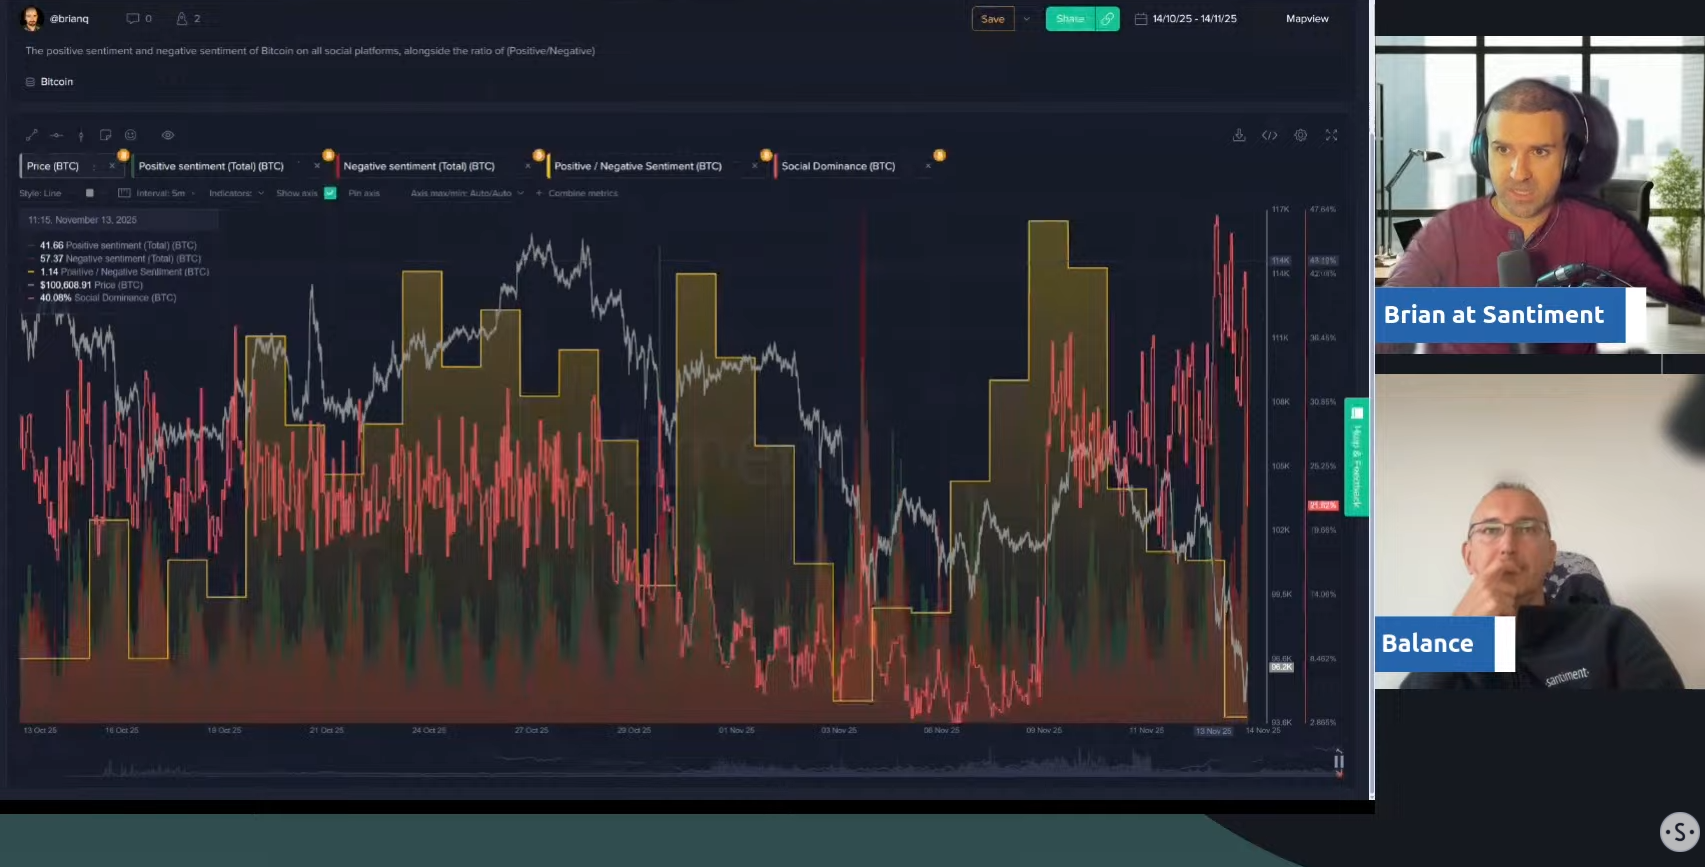
(17:35) - Sentiment Analysis: Is This Peak Fear?
Social media sentiment has turned overwhelmingly negative (Chart). The ratio of positive to negative comments about Bitcoin is at its lowest point in over a month. As Bitcoin's price fell, its social dominance soared to over 40%, showing it is the main topic of a very fearful conversation.
- Key Data: Bitcoin's social dominance spiked to over 42%, while the ratio of positive to negative comments hit a three-month low.
- Actionable Tip: Monitor weighted sentiment scores during major price moves. Extreme fear, indicated by highly negative sentiment, often precedes market bounces.
(22:04) - "95k Market Bottom": Is the Crowd Too Optimistic?
Despite the fear, a popular emerging narrative is the "95k market bottom." This suggests many traders believe the worst is over. Brian views this as a "caution flag." True market bottoms rarely occur when the crowd is confidently calling the low. They typically form when the consensus is that prices are headed much lower.
- Key Data: "95k market bottom" has emerged as a top trending topic, signaling crowd optimism.
- Actionable Tip: Be cautious when you see a widespread consensus forming about a specific price bottom. True bottoms often form when the majority expects prices to fall further.
(25:23) - XRP ETF Breaks Records Amidst Market Chaos
In a piece of positive news, the first-ever spot XRP ETF (ticker: XRPC) launched successfully. It had a record-breaking first day of trading. This strong debut helps explain why XRP sentiment has held up better than that of Bitcoin and Ethereum, as asset-specific developments can sometimes insulate a project from broader market fear.
- Key Data: The new spot XRP ETF (XRPC) achieved $58.6 million in trading volume on its first day.
- Actionable Tip: Look for assets with unique, positive catalysts (like an ETF launch) that may help them perform differently from the broader market during a downturn.
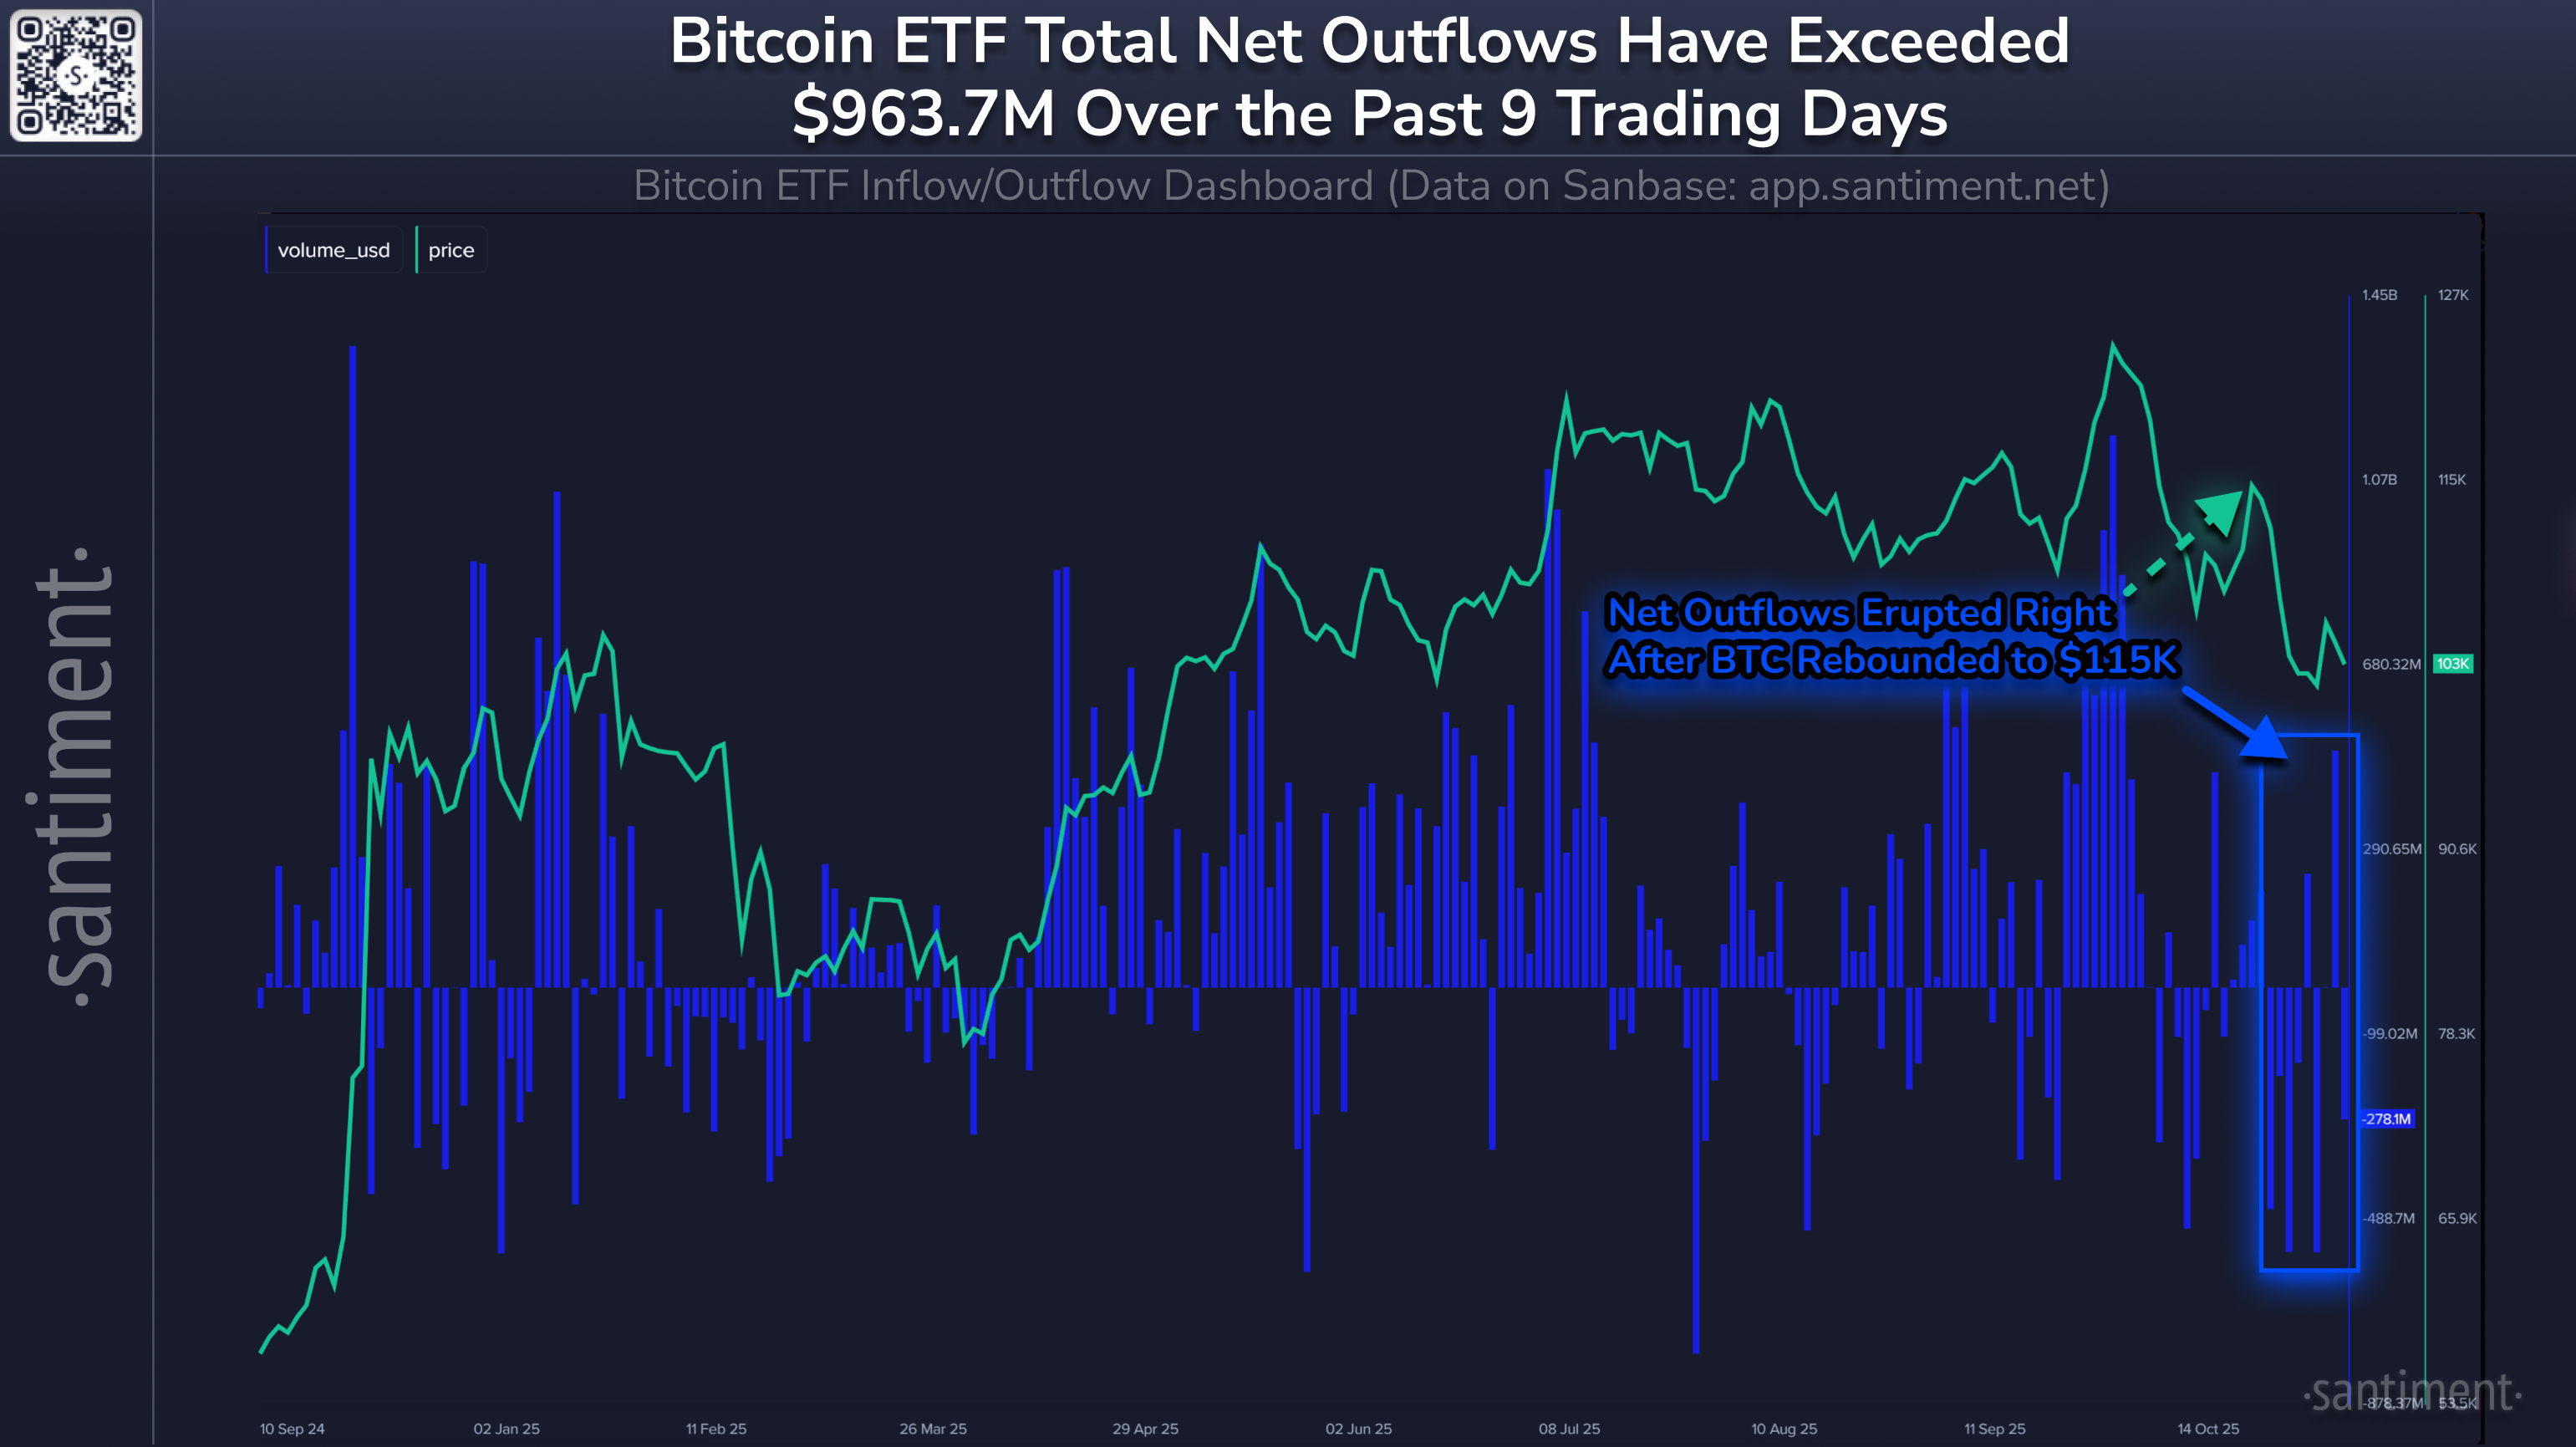
(26:51) - ETF Outflows Nearing $1 Billion: A Bullish Sign?
Bitcoin ETFs have experienced nearly $1 billion in outflows over the last nine trading days. Counterintuitively, Brian and Maksim see this as a potentially bullish sign. Their analysis shows that large ETF inflows have often marked local price tops, while significant outflows have coincided with market bottoms, suggesting retail panic.
- Key Data: Bitcoin ETFs have seen almost $1 billion in outflows over the past nine trading days.
- Actionable Tip: Analyze ETF flow data. Large outflows can signal retail panic and capitulation, which have historically coincided with market lows.
(35:15) - Unpacking the Biggest Realized Loss Day in 6 Months
On-chain data revealed that the market just experienced its biggest realized loss day in at least six months. This means a massive volume of Bitcoin was sold at a loss, indicating capitulation from some holders. While this is a key sign of panic, Maksim suggested that a final bottom might require an even more extreme spike in losses.
- Key Data: The network experienced the largest single day of realized losses in over six months.
- Actionable Tip: Check the Network Realized Profit/Loss metric. A major spike in losses confirms that holders are selling in a panic, a necessary event for forming a market bottom.

(38:40) - Who is the Market Blaming for the Crash?
Maksim explained that market bottoms are often accompanied by widespread anger and blame. Right now, the community is pointing fingers at figures like Michael Saylor. The social media discussion volume for "Saylor" spiked dramatically with the price drop. This act of blaming figures who were praised at the top is a classic psychological indicator.
- Key Data: Social media discussion volume for "Saylor" spiked to a multi-month high during the price crash.
- Actionable Tip: Identify who the crowd is blaming for a market crash. When anger is directed at former heroes, it's a strong sign that market psychology has shifted to depression.
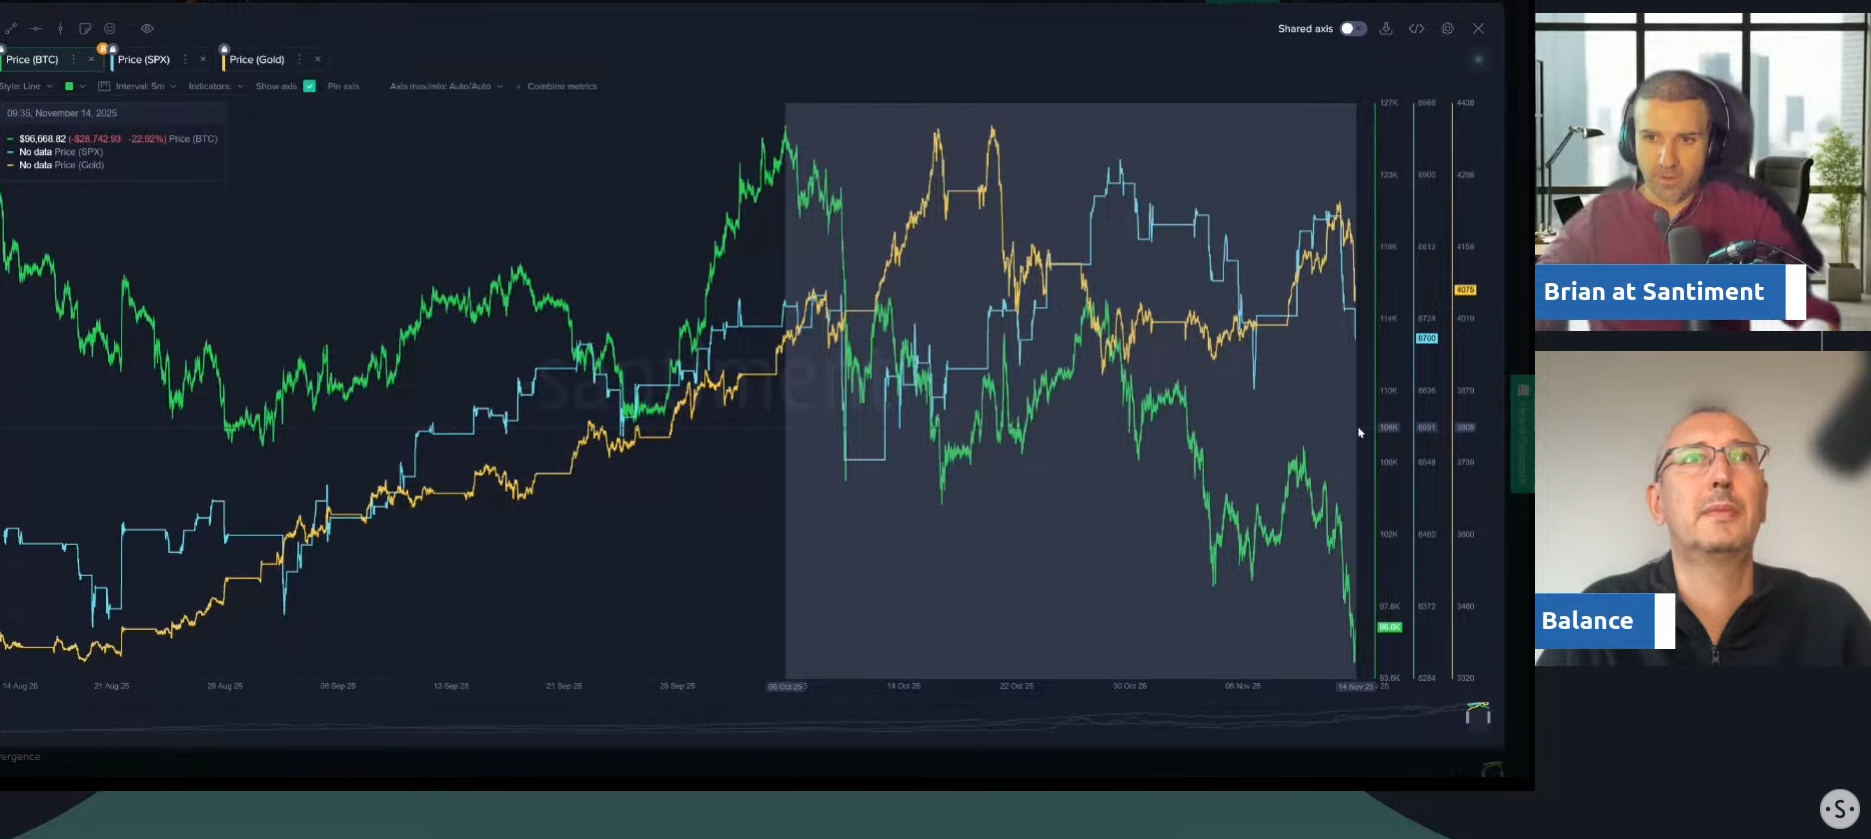
(44:38) - Bitcoin Decouples from the S&P 500: What it Means
A divergence is occurring between crypto and traditional markets. While Bitcoin has fallen sharply, the S&P 500 has remained flat. Brian noted that this decoupling is significant because Bitcoin's most powerful bull runs in history occurred when it was moving independently of the stock market.
- Key Data: While Bitcoin dropped ~23% from its all-time high, the S&P 500 remained nearly flat (-0.1%).
- Actionable Tip: Observe the correlation between Bitcoin and the S&P 500. A breakdown in their positive correlation can signal that crypto is moving based on its own internal dynamics.
(47:15) - Has the AI Stock Frenzy Drained Crypto Liquidity?
Maksim offered a compelling theory for the decoupling: capital has rotated from crypto into AI stocks. He cited data from the Korean market, where crypto volumes have plummeted while interest in AI has soared. This capital shift explains why traditional markets are performing well while crypto suffers. He predicts this trend will eventually reverse.
- Key Data: Crypto trading volumes in the Korean market are reportedly down 80-90% as capital has moved to AI-related stocks.
- Actionable Tip: Consider how capital flows between different speculative markets. A downturn in one hot sector can lead to a revival in another as traders seek new opportunities.
Conclusion
This week's market turmoil provided a masterclass in market psychology. Brian and Maksim demonstrated that while price action can be chaotic, data offers a clearer picture. Key takeaways include the fading "buy the dip" optimism, extreme negative sentiment, large ETF outflows, and the emergence of a blame narrative—all classic signs of a market approaching a bottoming process.
To get the full analysis, be sure to watch the complete livestream. To get more data-driven crypto analysis, subscribe to our YouTube channel, our Substack, or follow us on Santiment Insights.