This Week in Crypto, Full Written Summary: W2 August


Crypto Market Analysis August 8th:
Altcoins Surge While Bitcoin Stalls: A Warning Sign?
Executive Summary
For those short on time, here are the key takeaways from this week's analysis:
- The Market's Big Divergence: Large-cap altcoins like Ethereum, XRP, and Chainlink are rallying strongly, while Bitcoin's price remains stagnant. This "alt season" dynamic is the main theme of the week.
- A Classic Warning Signal: Historically, when altcoins surge without Bitcoin leading the way, it signals market froth and a potential "danger zone" where a correction could be imminent.
- Bullish News vs. Bearish Data: While positive news like a US executive order allowing crypto in 401ks is driving excitement, on-chain data reveals concerning trends. Bitcoin whales are not accumulating, and sentiment for top altcoins has reached extreme FOMO levels.
- Key Asset Insights: Ethereum's rally is fueled by institutional money, but XRP's sentiment spike is a major red flag. Meanwhile, Monero (XMR) is showing signs of capitulation, presenting a potential contrarian signal.
Introduction
The crypto market is a tale of two trends this week. While major altcoins like Ethereum, XRP, and Chainlink are posting impressive gains, Bitcoin remains relatively flat. This divergence has many traders excited, but is it a sign of a healthy market or a classic warning signal?
In this week's analysis Brian and Maksim look past the headlines to reveal what the on-chain data is truly saying. From a landmark executive order allowing crypto in 401k plans to the dramatic conclusion of Ripple's five-year legal battle, we'll cover the news driving the market. More importantly, we'll examine the underlying metrics that suggest a "danger zone" may be approaching.
[00:27] Large Cap Altcoins Are Surging: Time to Shine?
The week kicked off with strong momentum from large-cap altcoins. Brian noted that assets like Ethereum, which is knocking on the door of $4,000, along with XRP and Chainlink, are climbing at a rate that has pleased long-term holders. He described their performance as not quite "supernova, but the level right below that," as they are significantly outpacing the rest of the market. This surge is providing a welcome sight for investors who have patiently held these top assets through periods of stagnation.
- Key Data: Ethereum is at the significant psychological level of $4,000.
- Actionable Tip: Compare the performance of large-cap altcoins against Bitcoin's price. A widening gap where altcoins lead can be a signal of increasing market risk.
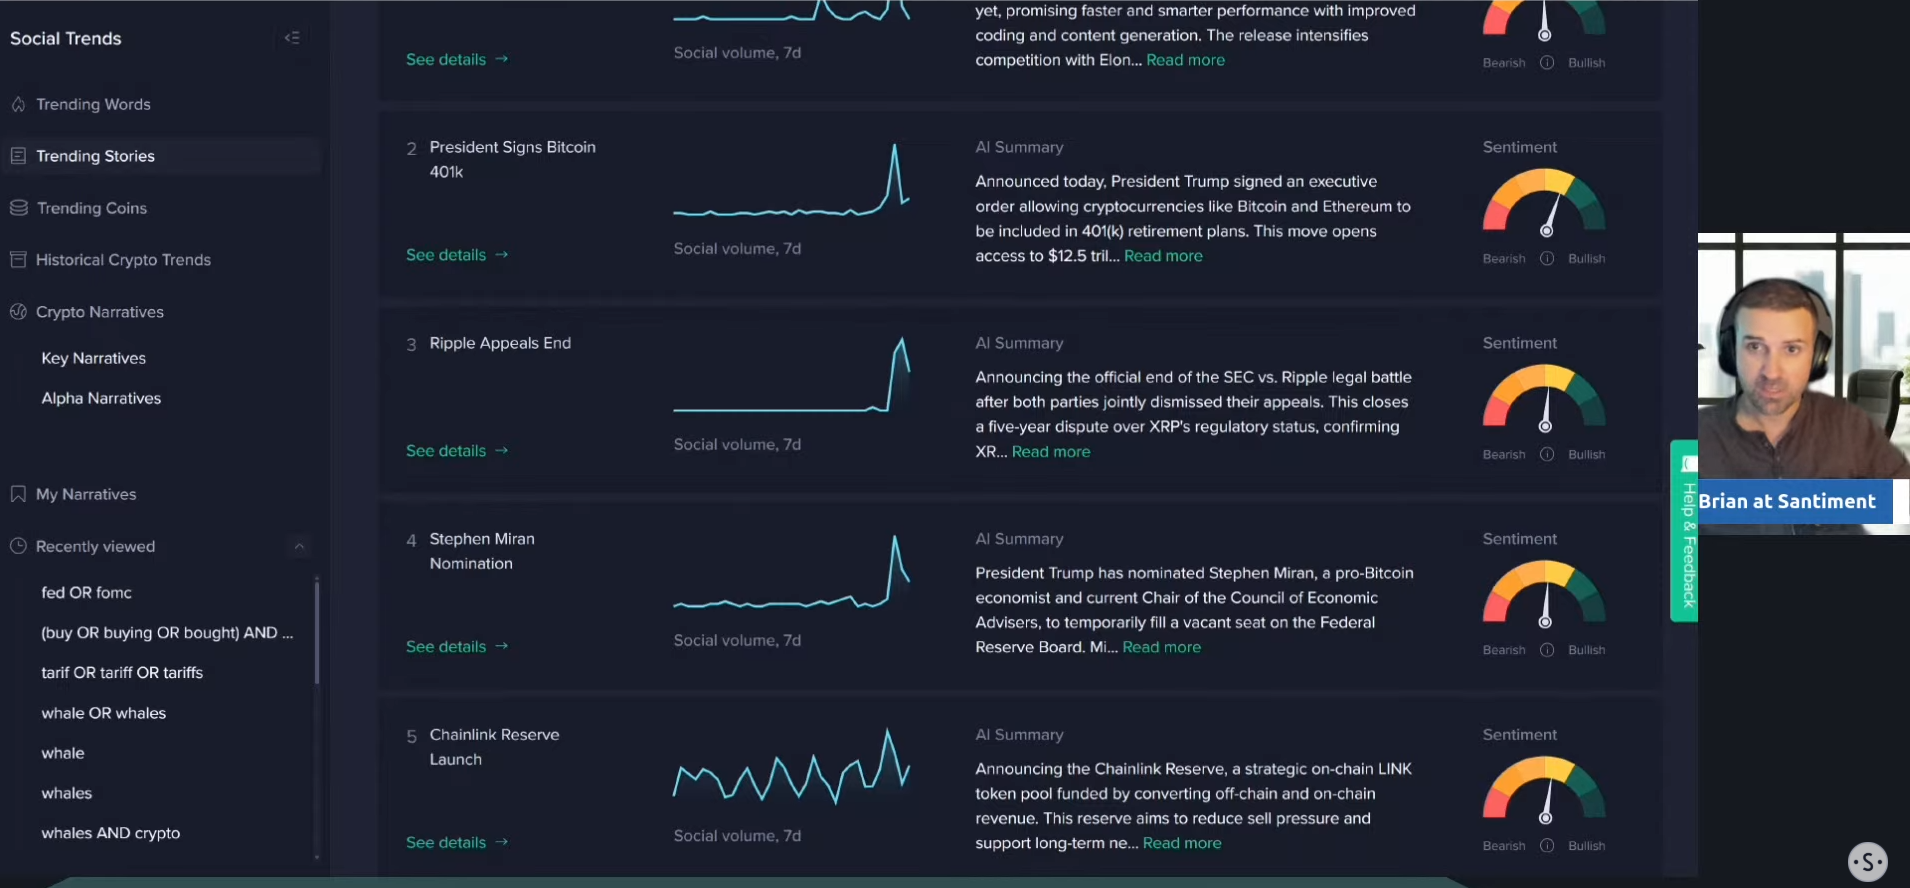
[03:15] Trump's HUGE Move: Crypto Now in 401k Retirement Plans
One of the biggest drivers of bullish sentiment was a new executive order signed by President Trump. This order allows cryptocurrencies like Bitcoin and Ethereum to be included in 401k retirement plans. This is a massive development for American investors, giving them direct, long-term exposure to digital assets through their retirement savings.
Brian pointed out that this is likely not a "buy the rumor, sell the news" event. Instead, it represents a potentially permanent fixture in the US financial landscape. He stated, "This is huge for Americans, especially those who believe in crypto for the long term... more options typically leads to good results."
- Key Data: The executive order enables direct investment in crypto through 401k retirement plans.
- Actionable Tip: Watch for announcements from major retirement fund providers about their plans to offer crypto options, as this will indicate the real-world adoption rate of this new policy. Set this up as a new narrative to follow using the Sanbase Social Trends tool.
[05:05] Pro-Bitcoin Economist Joins White House Council
Adding to the positive regulatory news, pro-Bitcoin economist Stephen Miran was appointed as the current chair of the Council of Economic Advisors. Miran is known for his support of lower interest rates and his belief that Bitcoin should play a "meaningful role in US monetary policy."
This appointment reinforces the current administration's crypto-friendly stance. Brian contrasted this with the previous, more restrictive environment under figures like Gary Gensler. The placement of crypto-positive individuals in key economic roles signals a more favorable and less restrictive future for the industry in the US.
- Key Data: Stephen Miran, the new chair, believes Bitcoin should play a "meaningful role in US monetary policy."
- Actionable Tip: Keep an eye on official statements or policy papers from the Council of Economic Advisors for any mention of digital assets, as this could signal future government-level integration.
[07:00] Ethereum's Institutional FOMO: The Rally to $4k Explained
Ethereum's rally is being fueled by a surge in institutional interest. Recent activity includes a massive purchase of 1.8 million ETH and a new $5 billion treasury fund filing, indicating that big money is flowing into the ecosystem.
However, Brian offered a nuanced perspective on this trend. He explained that when large institutional purchases are made public, they can create a wave of FOMO that temporarily flattens or even lowers the price. He believes this may have happened in July, but now the market is seeing the true rally on the back of this institutional confidence as Ethereum approaches the $4,000 mark.
- Key Data: A recent institutional purchase involved 1.8 million ETH, and a new $5 billion treasury fund filing was noted.
- Actionable Tip: Track institutional wallet movements and fund filings. A steady increase in institutional holdings is a strong indicator of long-term confidence in an asset. Use the Amount of Holders metrics to monitor the number of large holders; 50, 100, 1k+ ETH or BTC.
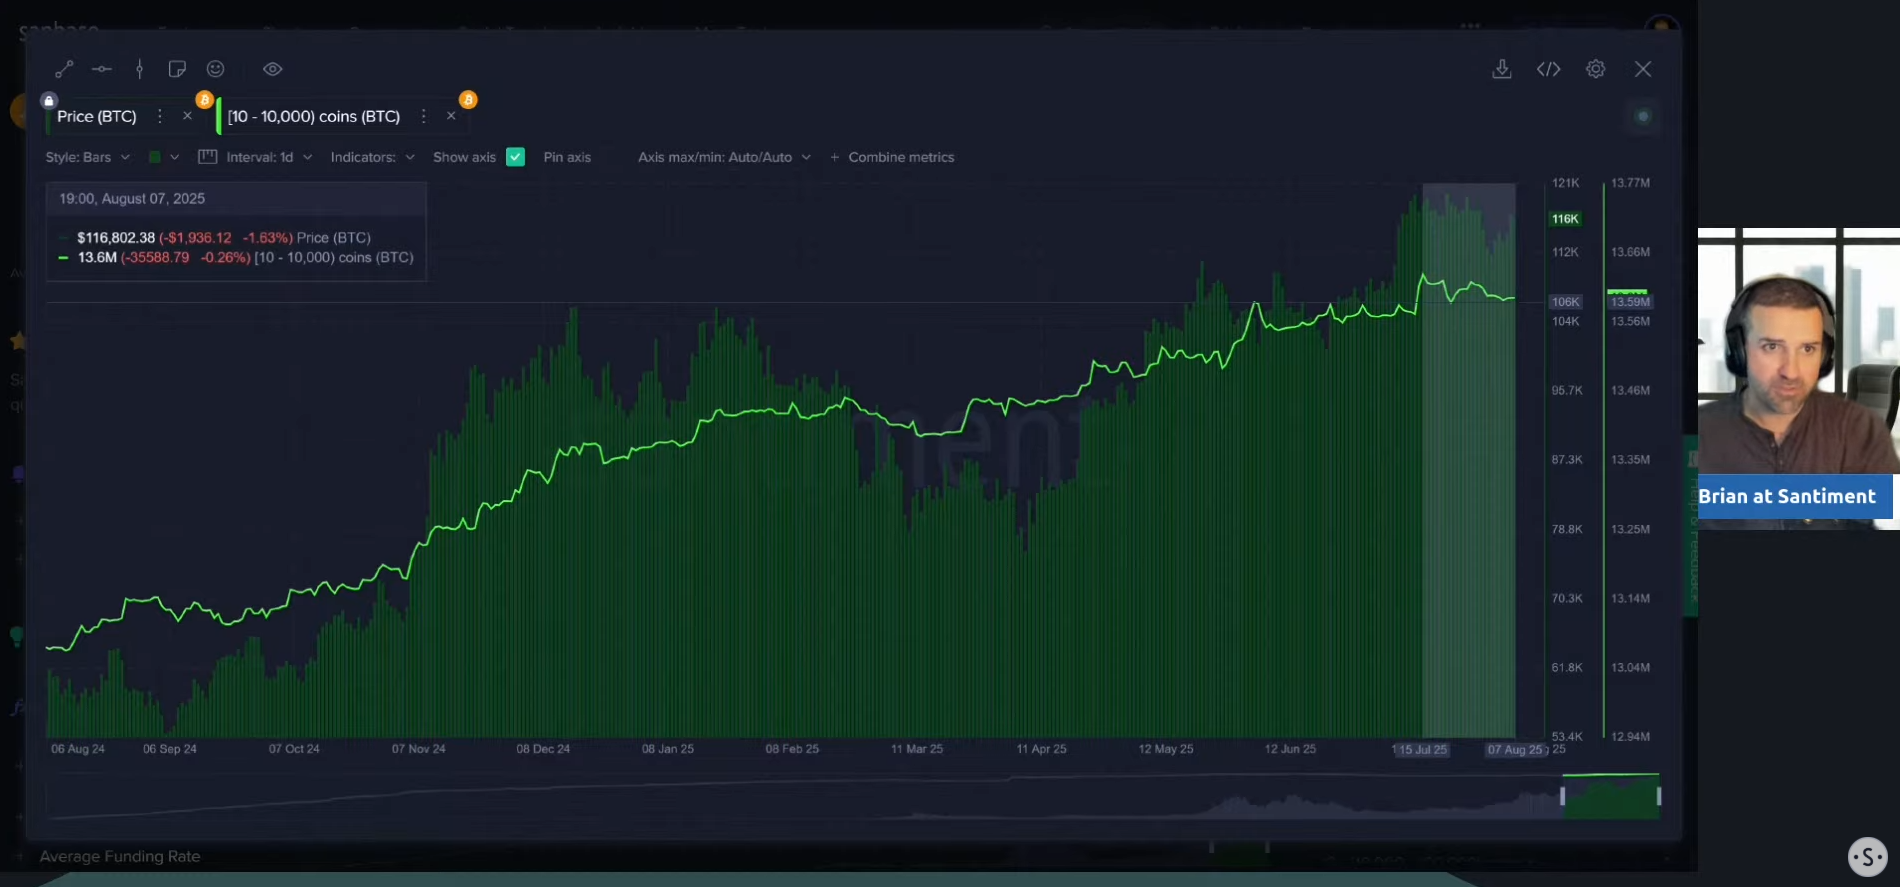
[08:44] Warning Sign: Bitcoin Whales Are Quietly Selling
While altcoins celebrate, a concerning trend is emerging on the Bitcoin network. The holdings of key stakeholders—wallets with 10 to 10,000 BTC—have been declining slightly since mid-July. These "whale" and "shark" wallets are crucial for driving sustained bull runs.
Brian expressed concern over this, noting, "Slightly concerning to me that the BTC key stakeholders have taken a back seat." He explained that the biggest bull cycles happen when these key players are accumulating Bitcoin alongside altcoins, which is not what the data shows today.
- Key Data: Key stakeholder wallets (holding 10 to 10,000 BTC) have seen their holdings decline since mid-July.
- Actionable Tip: Use a supply distribution chart to monitor the behavior of large Bitcoin holders. A sustained decrease in their holdings during a rally is a significant bearish signal.
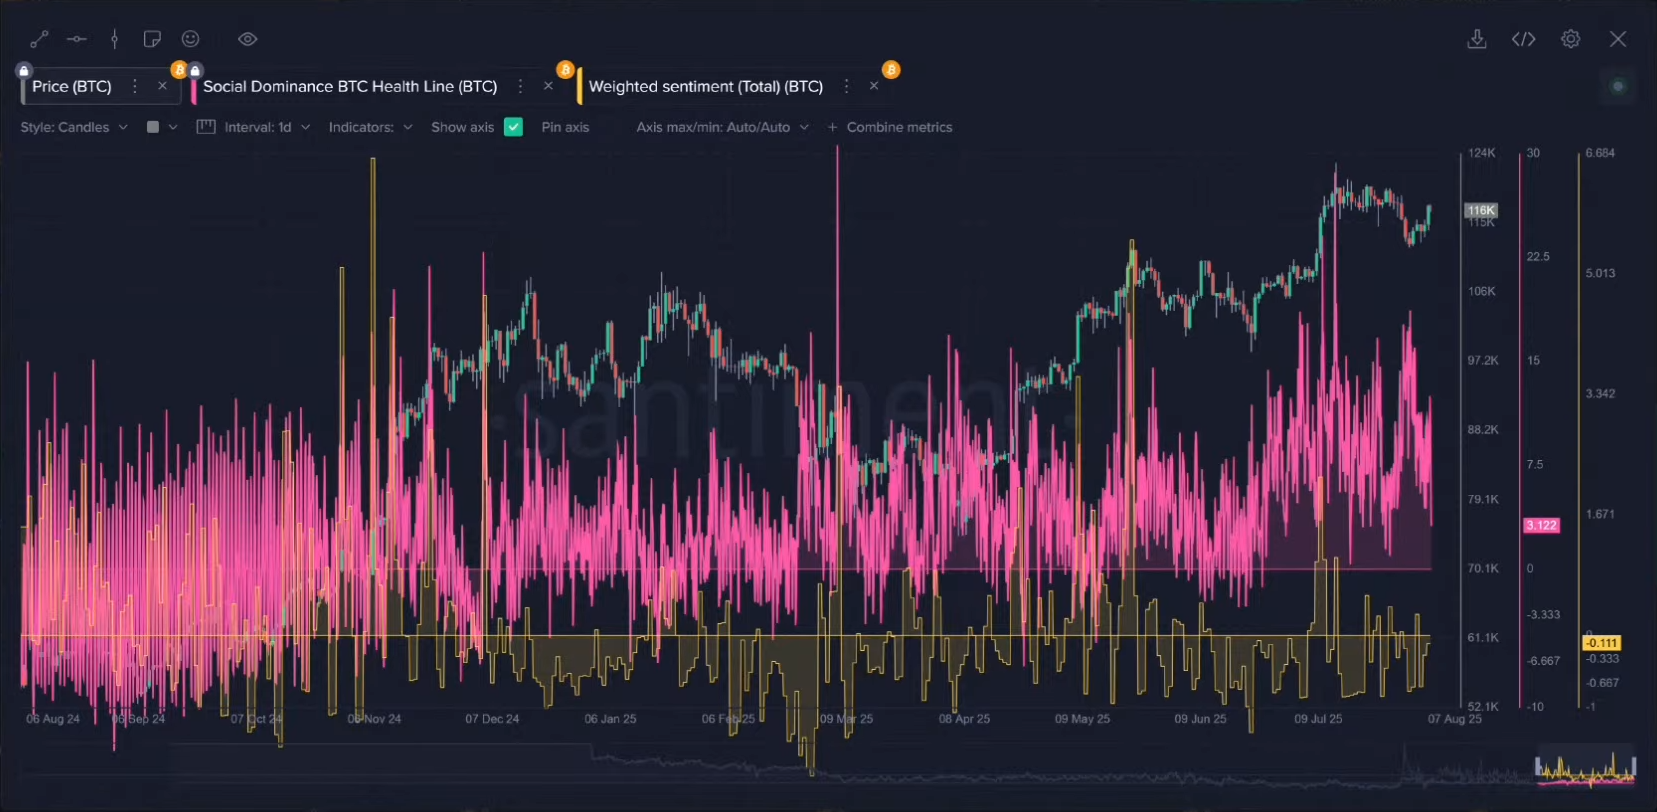
[12:07] How to Spot Market Tops & Bottoms with Social Dominance
Social dominance, or the percentage of crypto discussion an asset commands, is a powerful tool for identifying market turning points. Brian demonstrated how extreme spikes in conversation often signal trend reversals.
For example, a massive spike in Bitcoin-related chatter in mid-July coincided perfectly with the local price top. Conversely, earlier spikes in discussion during price bottoms marked excellent buying opportunities. The key is to watch for moments of extreme crowd attention, as they often indicate that a move is exhausted.
- Key Data: A major spike in Bitcoin's social dominance coincided with the local price top in mid-July.
- Actionable Tip: Set alerts for unusual spikes in an asset's social dominance. Extreme levels of crowd attention often precede a price reversal.
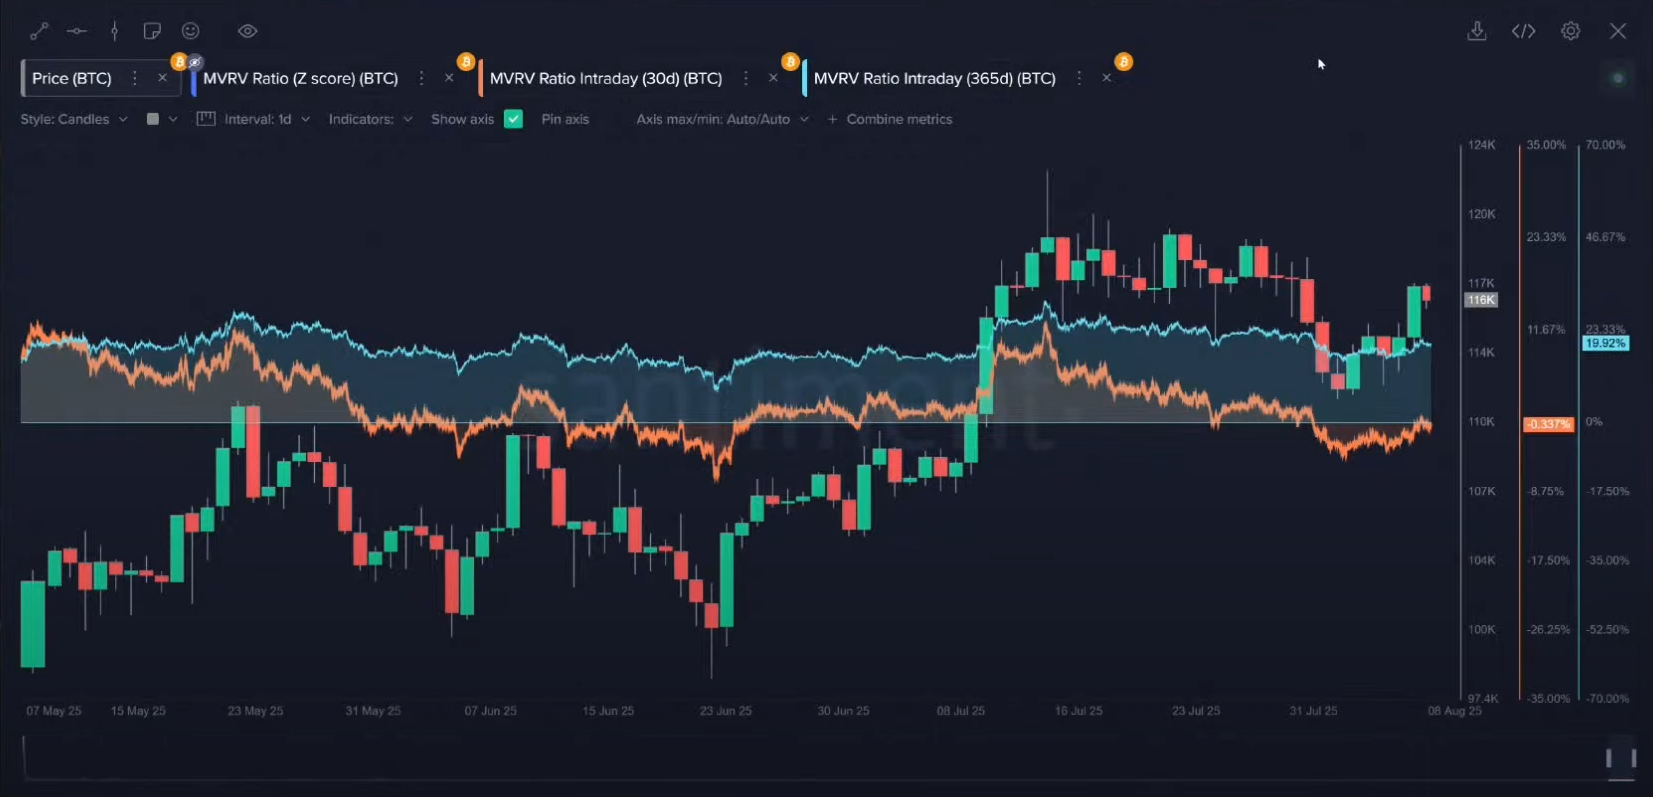
[18:00] Bitcoin's MVRV Analysis: Is It Too Risky to Buy Now?
The MVRV (Market Value to Realized Value) ratio measures the average profit or loss of all holders of an asset. For Bitcoin, the 365-day MVRV shows that the average long-term holder is up about 20%. While the 30-day MVRV is neutral, the high long-term value signals caution.
Brian explained that when long-term holders are in significant profit, it increases the temptation for them to sell and take gains. "If you jump in now, you're doing so while there already has been a lot of success," he noted.
- Key Data: The 365-day MVRV indicates the average long-term Bitcoin holder is currently in profit by about 20%.
- Actionable Tip: Check the MVRV ratio before entering a position. A high MVRV suggests increased risk of profit-taking, while a negative MVRV can indicate an undervalued market.
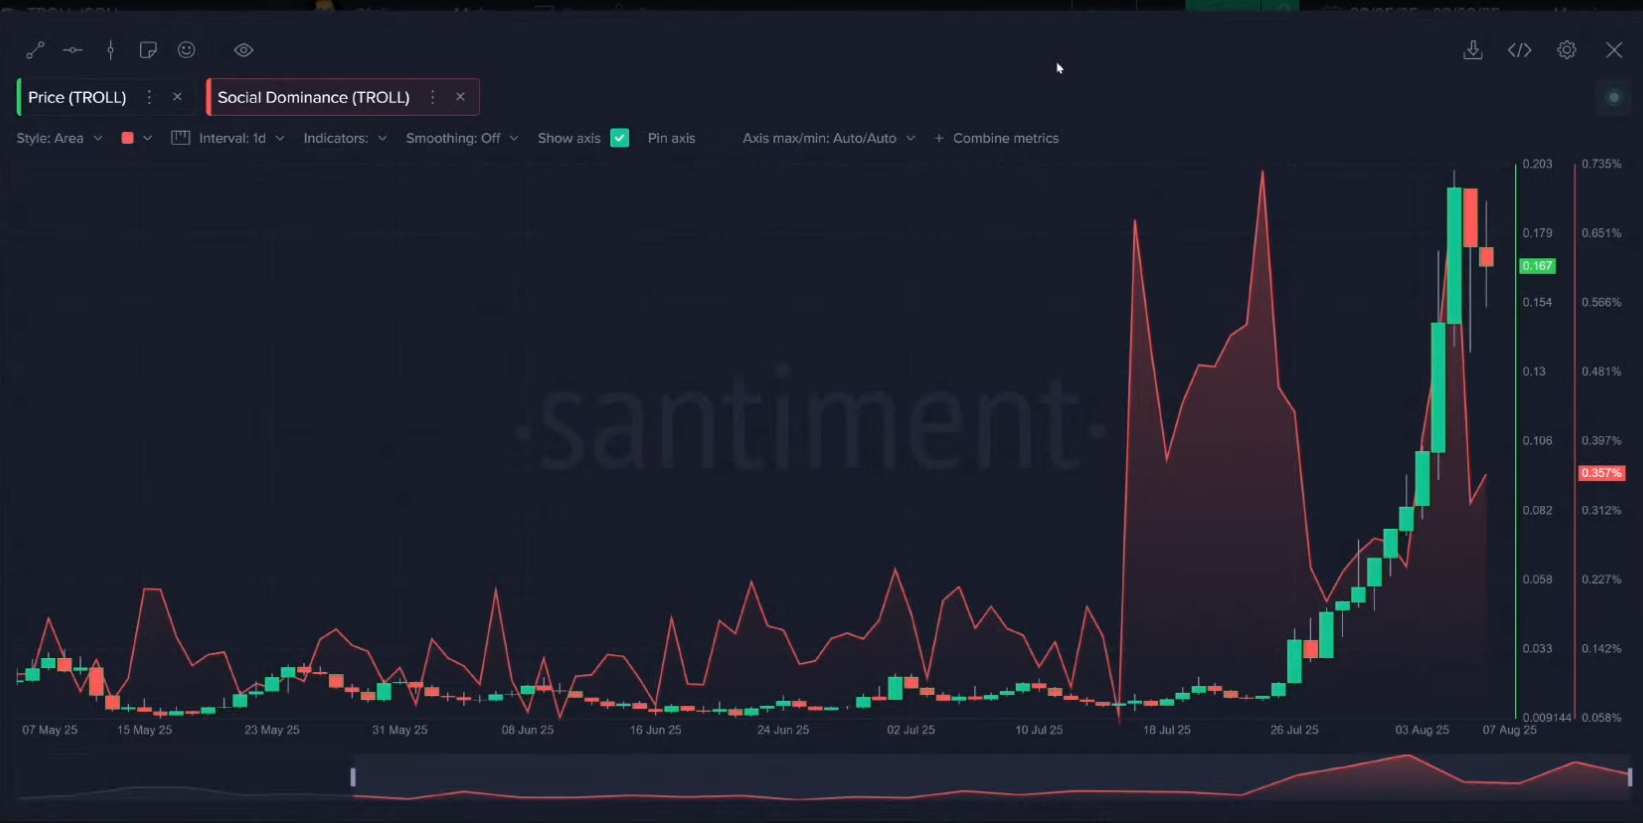
[25:01] Anatomy of a Memecoin Pump: The "TROLL" Token Case Study
The TROLL token provided a perfect example of memecoin market dynamics. The coin surged over 1,000% before retracing. By looking at its social dominance, Brian showed a classic pattern: the public only took notice after the massive price run.
The biggest spike in social discussion happened precisely at the price top. "The fomo-ers start to get in... and suddenly they're left holding the bags," Brian said. This case study illustrates how social metrics can reveal when a rally is driven by hype.
- Key Data: The TROLL token surged over 1,000% before its social dominance peaked, signaling the top.
- Actionable Tip: For highly speculative assets, cross-reference price charts with social volume. A surge in discussion after a massive price pump is a classic sign to be cautious.
[33:05] Is This a Classic "Alt Season" Top Signal?
When Maksim joined the stream, he and Brian immediately agreed on a major point of concern. The current market behavior—where altcoins are surging while Bitcoin moves sideways—is a classic pattern that often appears near the end of a rally.
"Now it's alt season, right?" Maksim asked, to which Brian replied, "That's exactly right... a bit of a concern because we need Bitcoin to lead the way." This dynamic suggests that capital is flowing into riskier assets, a sign of market froth that can precede a correction.
- Key Data: The market is showing a clear divergence: strong altcoin performance against a stagnant Bitcoin price.
- Actionable Tip: Monitor Bitcoin Dominance. A sharp drop in dominance while the overall market cap rises can indicate a frothy, late-stage rally.
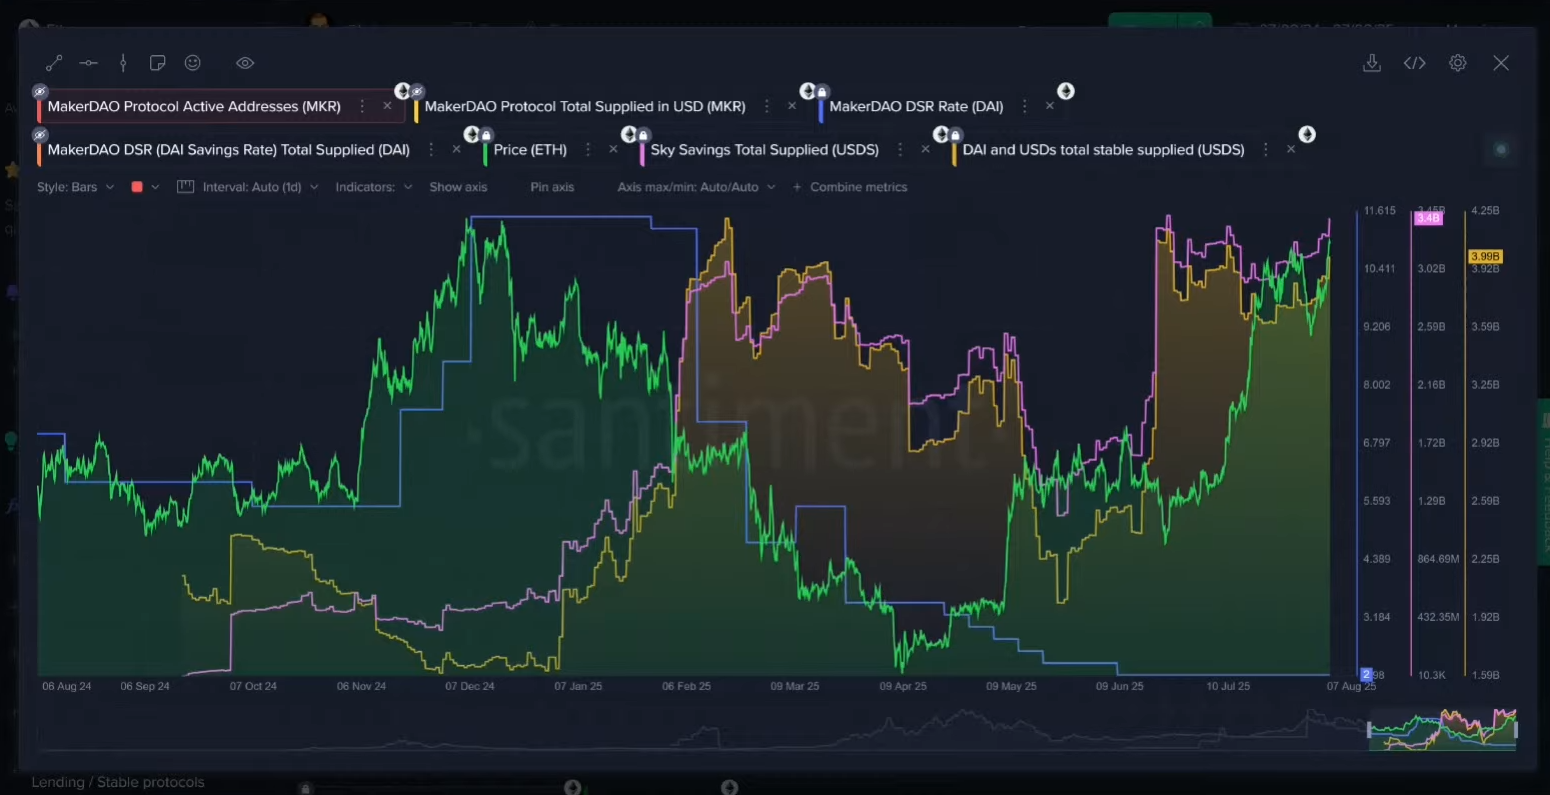
[34:40] A Unique Indicator Revealing Ethereum's Next Move
Maksim shared a custom metric he uses to gauge market sentiment, which combines stablecoin deposits into the "safe" yield protocols of MakerDAO and Spark. He explained that when deposits into these protocols are high, it reflects fear and a desire for stable, low-risk returns.
Conversely, when traders pull money out of these protocols, it signals they are becoming more confident. The chart showed that as money began to flow out of these safe havens, Ethereum's price started its rally, suggesting a shift from fear to greed.
- Key Data: The outflow of stablecoins from "safe" DeFi yield protocols coincided with the start of Ethereum's price rally.
- Actionable Tip: Observe the total value locked (TVL) in DeFi's most conservative protocols. A decrease in TVL can signal that investors are moving capital to riskier assets.
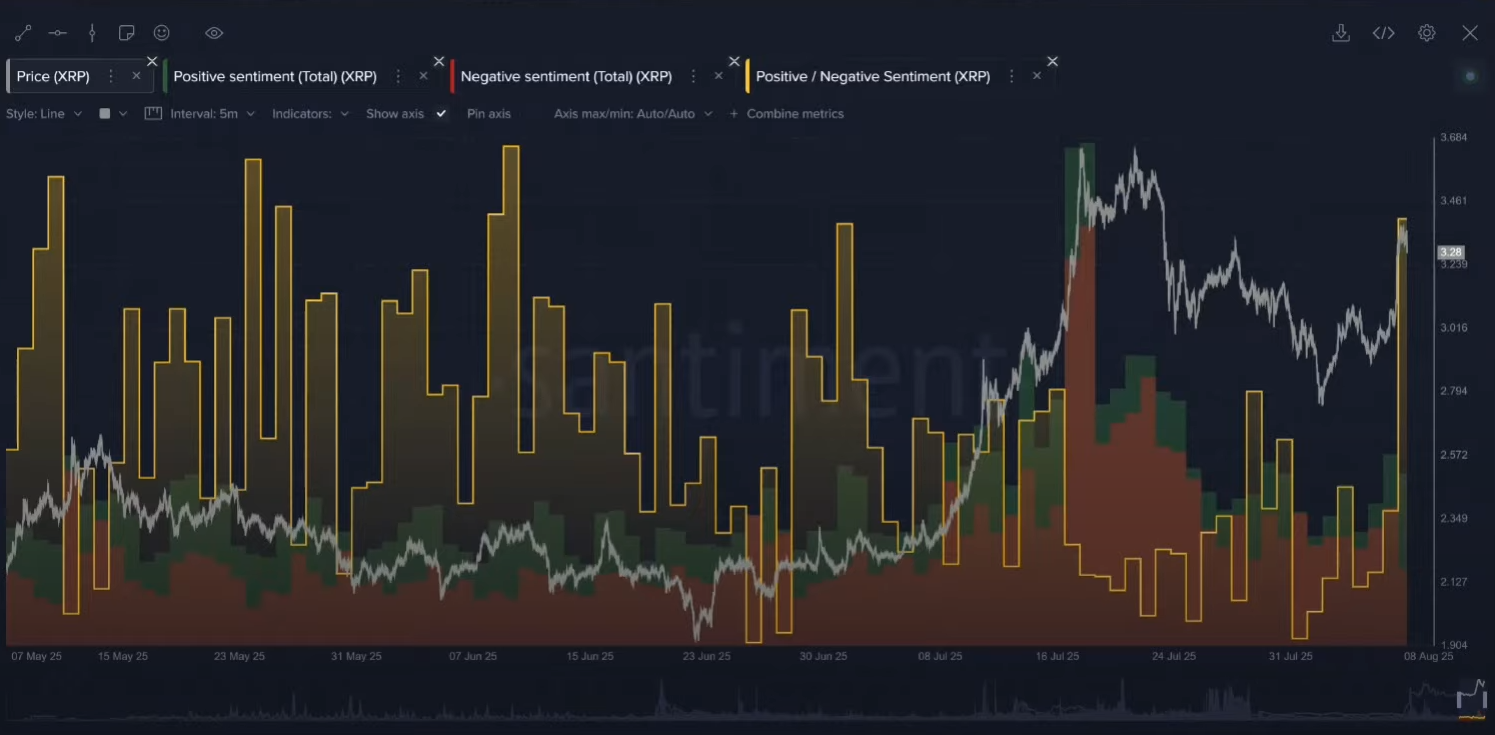
[45:47] Sentiment Analysis: Ethereum & XRP Hit Extreme FOMO Levels
A look at the ratio of positive to negative sentiment revealed extreme levels of bullishness for the week's top performers. Both Ethereum and XRP saw massive spikes in positive commentary, coinciding with their price rallies. Maksim noted how strongly this indicator has correlated with previous tops.
For XRP, the spike was particularly dramatic, reaching its highest point since a previous top in June. Brian warned, "Generally when you see huge spikes like this... there's a very concerning level of FOMO."
- Key Data: XRP's positive-to-negative sentiment ratio hit its highest level since the June 10th price top.
- Actionable Tip: Use a sentiment analysis tool to gauge crowd emotion. An extremely high ratio of positive to negative comments is a strong contrarian signal that a top may be forming.
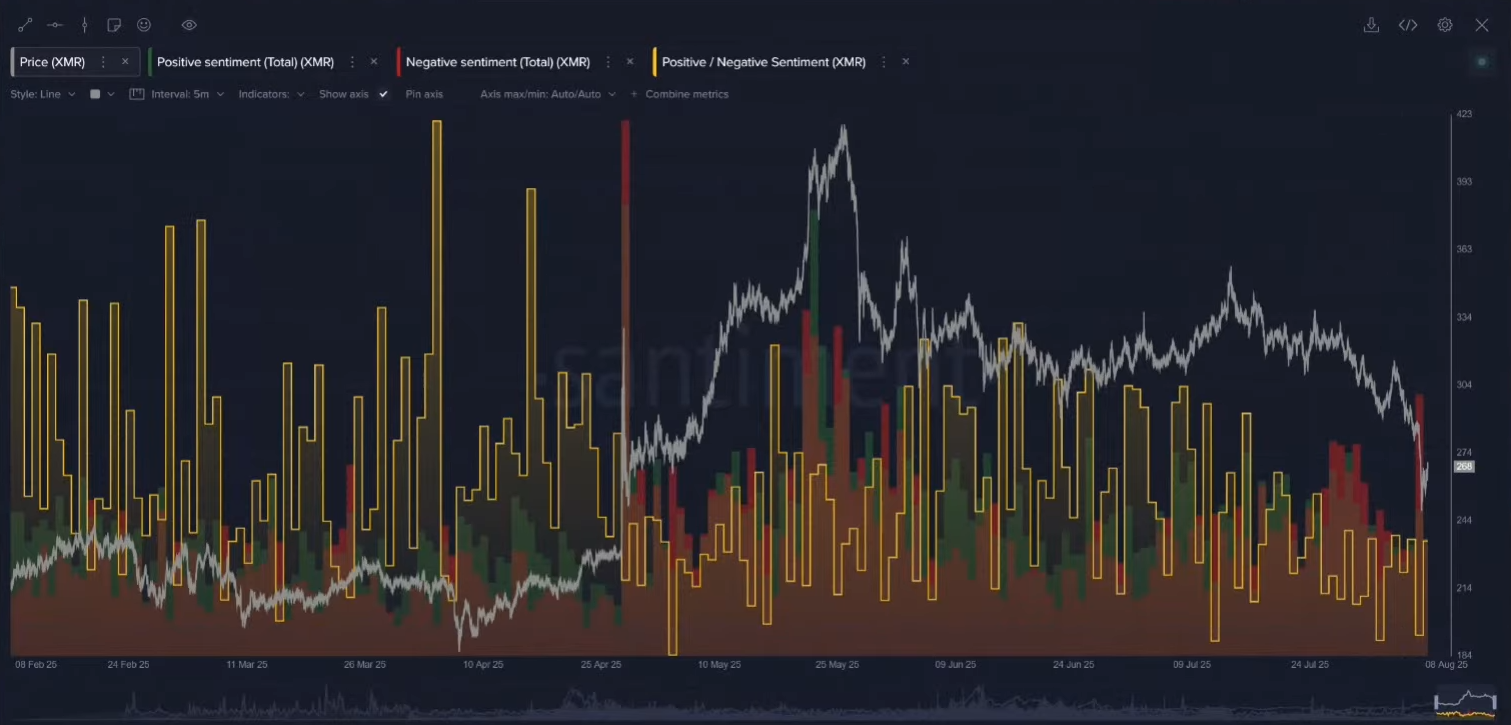
[53:17] A Contrarian Play? Monero (XMR) Sentiment Hits Rock Bottom
In stark contrast to the market leaders, privacy coin Monero (XMR) showed signs of extreme bearishness. The data revealed a spike in social volume combined with deeply negative sentiment, a pattern often associated with capitulation.
"Bottoms always come with bad news," Maksim observed. The combination of high discussion and negative feeling suggests that weak hands may have been flushed out. This is the type of environment where market bottoms can form.
- Key Data: Monero (XMR) experienced a spike in social discussion while sentiment turned overwhelmingly negative.
- Actionable Tip: Look for assets with high social volume but extremely low sentiment. This combination can indicate capitulation and may present a contrarian opportunity to investigate further.
[56:29] Final Analysis: Why the Crypto Market is in a "Danger Zone"
In their final summary, Maksim and Brian concluded that the market is in a precarious position. The combination of lagging Bitcoin whale accumulation, high long-term profit levels (MVRV), and euphoric sentiment around altcoins points to a potential market top.
Brian summarized the situation perfectly: "This is often the time when a lot of retailers abandon Bitcoin and just jump into the latest shiny coin... and then we suddenly see a bit of a retrace."
- Key Data: The market's "danger zone" is defined by lagging whale accumulation, a high long-term MVRV, and euphoric altcoin sentiment.
- Actionable Tip: Create a checklist of key market health indicators (e.g., whale activity, MVRV, sentiment). When multiple indicators flash warning signs simultaneously, it's a signal to be extra cautious.
Conclusion
This week's crypto market presents a fascinating but cautionary picture. While positive news and strong altcoin performance have generated excitement, the on-chain data signals caution. The divergence between Bitcoin and altcoins, coupled with euphoric sentiment and quiet whale activity, suggests the market is in a "danger zone."
Understanding these deeper metrics is essential for seeing beyond the price charts. By using a data-driven approach, you can better appreciate the forces shaping the market and recognize the signals that others might miss.
For more data-driven analysis, be sure to follow our weekly updates and explore these powerful metrics for yourself.