
This Week in Crypto, Full Written Summary: W1 October

Bitcoin Hits New All-Time High, But Is a Cooldown Coming?
Executive Summary
For those short on time, here are the key takeaways:
- Bitcoin Hits New ATH, Then Dips: The market saw a new Bitcoin all-time high this week, but prices quickly retraced, while the overall crypto market cap declined by 6.5%.
- Fed Policy Remains a Key Driver: Anticipation of further Federal Reserve rate cuts continues to provide a tailwind for crypto and other risk assets.
- Whales Accumulate as Retail Sells: On-chain data reveals a classic bullish signal: large investors have been buying significant amounts of Bitcoin, while smaller retail wallets have been selling into the rally.
- BNB Surges, Litecoin Overheats: Binance Coin (BNB) hit its own all-time high and claimed the #3 market cap spot. Meanwhile, metrics for Litecoin show its recent rally is in a "danger zone" and at high risk of a correction.
- Record ETF Inflows Signal Peak Excitement: A massive $1.16 billion flowed into Bitcoin ETFs in a single day, a sign of peak market euphoria that often precedes a short-term top.
Introduction
Welcome back to our weekly summary of the "This Week in Crypto" livestream. In this edition, Brian provides a data-driven look at a wild week in the markets. Bitcoin blasted to a new all-time high on Monday, but the celebration was short-lived. We'll explore the macroeconomic forces pushing prices, see what large investors are doing behind the scenes, and uncover which assets might be overheating. Here’s an objective look at what the data says is really happening in crypto.
[00:56] The #1 Macro Driver? How Fed Rate Cuts Are Fueling the Crypto Market
The crypto market continues to be heavily influenced by macroeconomic policy. A key driver for the recent rally was the Federal Reserve's rate cut in September. Now, there is a widespread belief that we will see two more 25 BPS rate cuts before the end of 2025, with the next FOMC meeting scheduled for October 28th and 29th. Lower interest rates generally stimulate markets, and this has created a positive environment for risk assets like cryptocurrencies. This connection shows that what the US government and its federal policy does has a large impact on the crypto space.

- Key Data: There is a widely accepted belief that two more 25 BPS rate cuts will occur before the end of 2025.
- Actionable Tip: Keep an eye on the upcoming FOMC meeting on October 28th-29th. The outcome will likely influence market sentiment and direction.
[02:18] Is Bitcoin Just a High-Leverage Tech Stock? Analyzing the Tight Correlation with the S&P 500
The idea that Bitcoin behaves like a high-leverage tech stock appears to hold true. Its price has shown a very tight correlation with the S&P 500. Both markets have been making new all-time highs in unison. However, a slight divergence has appeared since Monday. Bitcoin has dropped about 3.2% while the S&P 500 has remained relatively stable. The host suggests that a true separation in this correlation might only happen after a significant market retrace.
- Key Data: Since Monday's peak, Bitcoin has dropped ~3.2% while the S&P 500 has remained flat, showing a minor divergence.
- Actionable Tip: Observe the Bitcoin vs. S&P 500 correlation. A growing divergence could signal a shift in how the market perceives Bitcoin relative to traditional assets.
[05:33] A Shuffle in the Top 5: Binance Coin (BNB) Reaches a New All-Time High
It was a strange week for the market. Despite Bitcoin's new peak, the overall crypto market cap fell by 6.5%. This was a week of significant shuffling among the top assets. Binance Coin (BNB) did very well, surpassing its all-time high and climbing to the #3 market cap spot, pushing Tether to #4.
- Key Data: The total crypto market cap fell by 6.5% this week, even as Bitcoin and BNB hit new all-time highs.
- Actionable Tip: Look beyond Bitcoin's price. Analyze the total market cap and the performance of individual top-25 assets provides a more complete picture of market health.
[07:22] A Surprise #1: Uncovering the Top Projects by Development Activity
Development activity remains a crucial, though often overlooked, indicator of a project's long-term health. This week, a surprising asset took the top spot. Metamask USD, an asset with a market cap rank of 506th, showed the most notable GitHub development activity over the past 30 days. This challenges the idea that high market cap always comes first, suggesting strong development can precede market recognition.

- Key Data: Metamask USD, a project ranked 506th by market cap, is currently #1 for notable GitHub development activity.
- Actionable Tip: Use development activity as a research tool to identify potentially undervalued projects that are focused on building, regardless of their current market rank.
[10:43] A Record $1.16 Billion Flows into Bitcoin ETFs in a Single Day: What This Signals
Money is flowing into Bitcoin ETFs at an aggressive rate. The market saw a massive peak on October 6th, when a net total of $1.16 billion flowed into these funds in a single day. These inflows are a powerful measure of both institutional and retail confidence. However, such massive spikes often act as indicators of a local top, signaling that excitement has peaked.
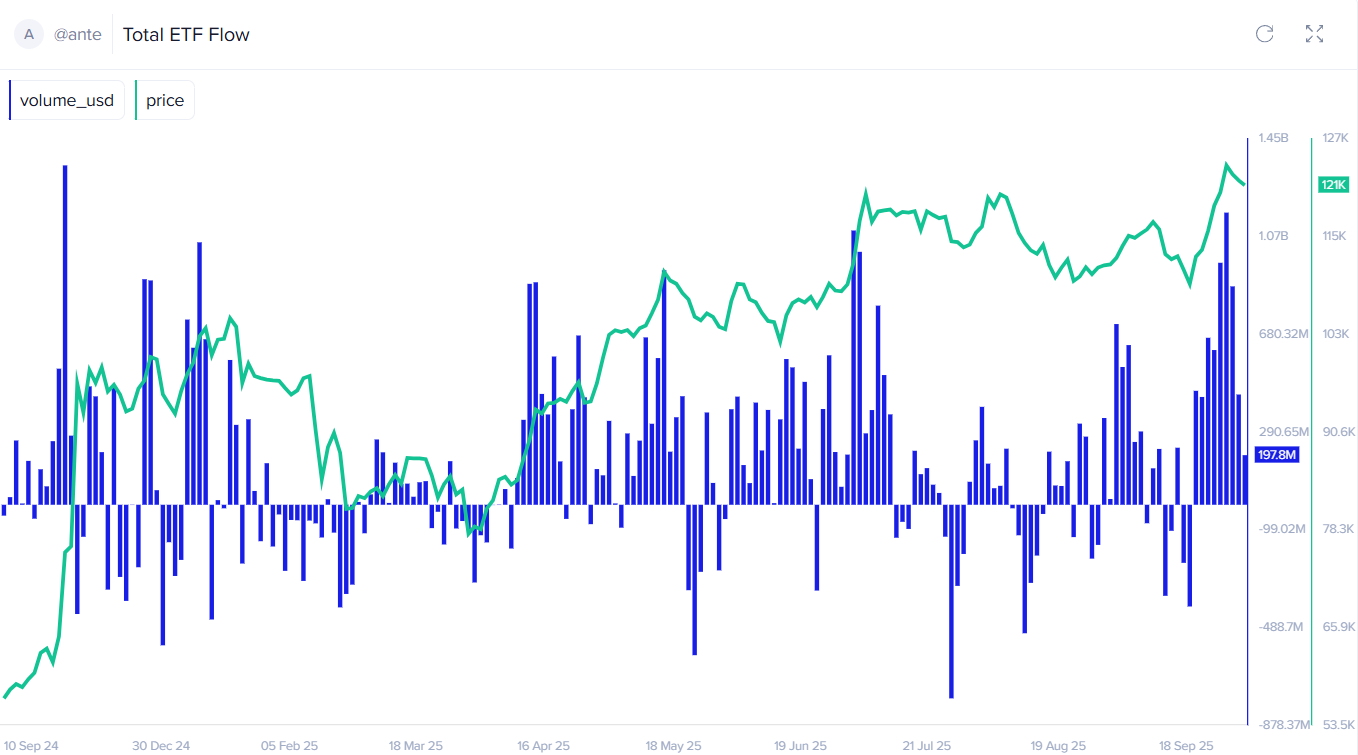
- Key Data: A record net inflow of $1.16 billion into Bitcoin ETFs was recorded on October 6th.
- Actionable Tip: Pay attention to extreme ETF inflow days. While bullish long-term, massive single-day spikes can often signal short-term market exhaustion and a potential price top.
[13:25] The "Alt Season" Debate & The Return of Privacy Coins
The discussion of a potential "alt season" continues, but data suggests it remains elusive as Bitcoin's dominance rises. While the broader market was down, specific narratives gained traction. One of the biggest was the resurgence of privacy coins. Assets like Zcash, Monero, and Firo have been in the spotlight, highlighting a fundamental demand for privacy.
- Key Data: Bitcoin's dominance is rising, making a broad, 2021-style "alt season" less likely for now.
- Actionable Tip: Instead of waiting for a general "alt season," focus on specific narratives gaining momentum, such as the recent interest in privacy coins.
[19:11] Warning Sign: Why Average Bitcoin Traders Are in a Risky Position Right Now
On-chain data suggests traders should be cautious. The Market Value to Realized Value (MVRV) metric, which tracks average trader profitability, is in a telling state. Currently, the 30-day average return for Bitcoin holders is +4.1%, while the 365-day return is +17%. Because the average trader is in profit, the likelihood of a short-term price correction increases.
- Key Data: The 30-day MVRV for Bitcoin is at +4.1%, indicating the average short-term trader is in profit.
- Actionable Tip: Use the MVRV metric as a risk gauge. When average trader profitability is high, the market is in a more precarious position than when it is at or below zero.
[22:31] A Key Long-Term Indicator Flashes Bullish as Dormant Coins Move
Looking at the long-term picture, the Mean Dollar Invested Age metric shows a bullish signal. This metric tracks the average age of all dollars invested in Bitcoin. When the metric drops, that indicates inflow of new money, and the inverse indicates that money isn’t coming in. Change of mode from down to up often predicts major market tops. This line continuing to trend down is bullish. Zooming out, the trend of new money coming in is slowing down.
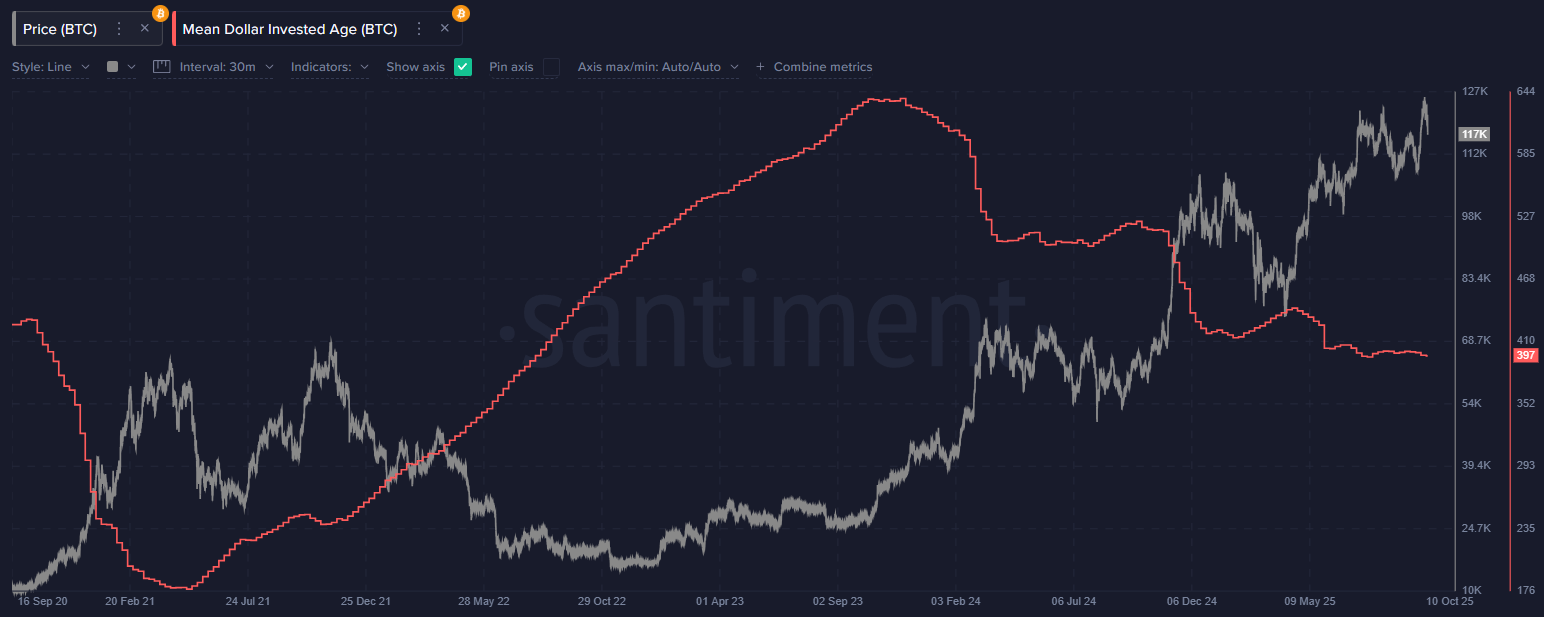
- Key Data: The Mean Dollar Invested Age for Bitcoin has dropped by 10.4% in the last four months, from 443 days to 397 days.
- Actionable Tip: For a long-term perspective, monitor the Mean Dollar Invested Age. A declining trend suggests a healthy, liquid market as older coins re-enter circulation.
[28:03] Whales Are Buying What Retail Is Selling (A Classic Bullish Signal)
A clear trend has emerged between large and small investors. Wallets holding between 10 and 10,000 BTC—representing sharks and whales—have been accumulating heavily. In sharp contrast, the smallest retail wallets have been selling during this rally. When retail traders sell, their coins are often acquired by larger, more confident players who can then influence prices upward.
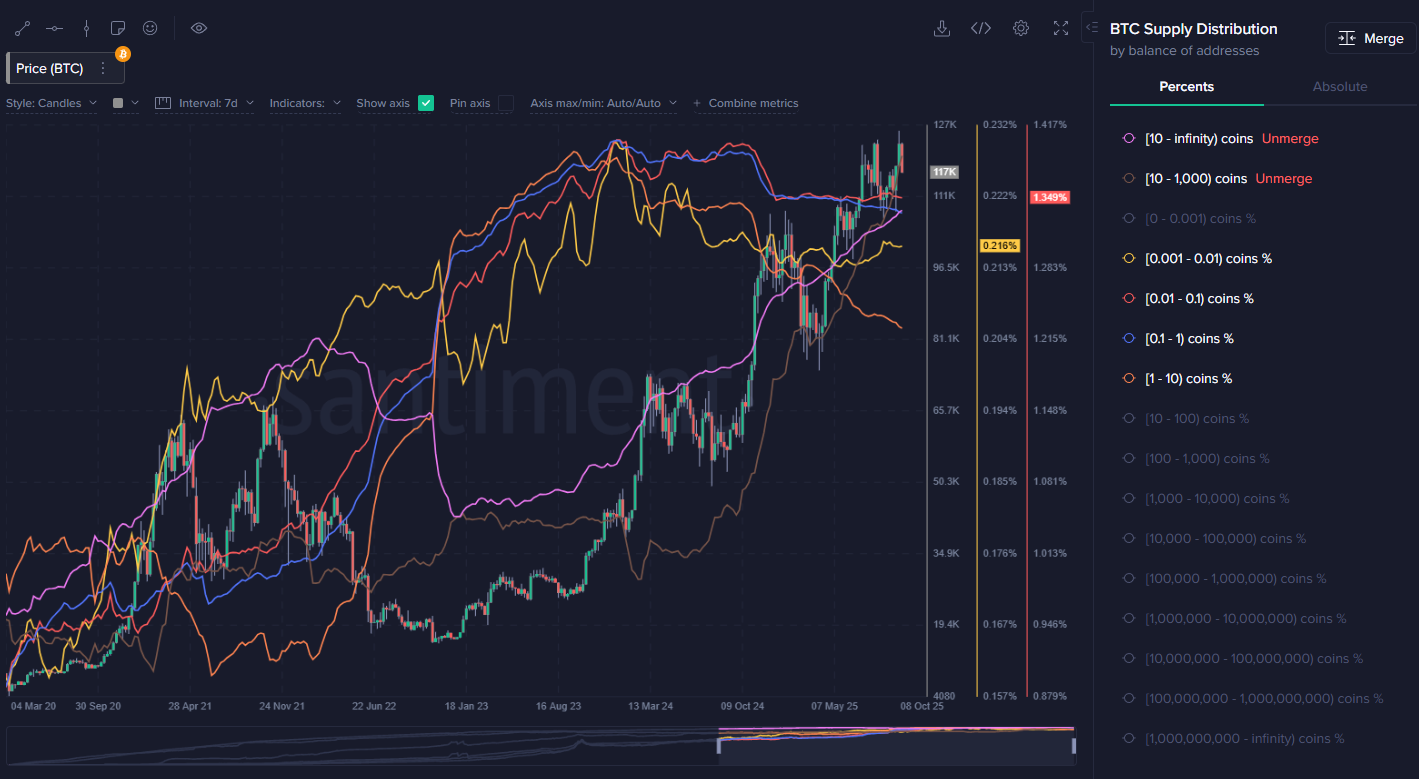
- Key Data: Wallets holding 10 to 10,000 BTC have collectively added 109,330 BTC in the last 10 weeks.
- Actionable Tip: Track the behavior of different wallet cohorts. When large "whale" wallets are accumulating while small "retail" wallets are selling, it can be a strong indicator of underlying market confidence.
[31:03] How to Predict Market Tops by Measuring Social Media FOMO vs. FUD
Social media chatter can be a powerful contrary indicator. Using a custom Santiment chart, we can measure the ratio of "low price" mentions (fear) versus "high price" mentions (FOMO). Right before the recent price top, mentions of targets between $150k and $200k spiked, signaling extreme FOMO. Conversely, the best time to buy was when mentions of lower prices were dominant.
- Key Data: A spike in social media discussions about Bitcoin reaching $150k-$200k coincided with the recent price top.
- Actionable Tip: Analyze social media sentiment as a contrary indicator. A surge in euphoric, high-price predictions often signals market greed and a potential peak.
[39:33] Litecoin's Rally Enters the "Danger Zone" According to On-Chain Data
Litecoin has had an impressive rally, but on-chain metrics suggest it may be running out of steam. The MVRV for Litecoin is squarely in the danger zone. The 30-day average return is above +15%, and the 365-day return is at +27%. Historically, when these profitability metrics get this high, a price correction follows, the risk of a downturn is large.
- Key Data: Litecoin's 30-day MVRV is above +15%, a level that has historically marked price tops for the asset.
- Actionable Tip: Before forming a view on a coin that has rallied hard, check its MVRV. A high reading suggests the rally may be overheated and at risk of a reversal.
[42:23] A Powerful Tool for Finding Under-the-Radar Coins with Surging Activity
The Santiment Activity Matrix is a tool designed to find assets that are suddenly seeing a huge spike in on-chain and social activity. These spikes often precede major price pivots.
For example, Basic Attention Token (BAT) was flagged as "hot" by the matrix after it saw massive spikes in transaction volume, active addresses, and network growth right at its price peak.

- Key Data: Basic Attention Token (BAT) saw a massive spike in transaction volume and active addresses that coincided exactly with its local price top.
- Actionable Tip: Use tools that track on-chain activity spikes. A sudden surge in metrics like transaction volume on a rallying asset can signal that FOMO is peaking and a reversal is imminent.
[46:15] The Top 10 "Hot" & "Cold" Crypto Assets to Watch Right Now
The Activity Matrix provides a leaderboard of assets with unusually high or low activity. This week, the "hot" assets—those with surging activity that could signal volatility—include Telcoin, Pax Gold, and Synthetix. The "cold" assets—those with very low activity whose price trends are likely to continue undisturbed—include Crypto.com Coin, Holo, and Radium.
- Key Data: Telcoin and Pax Gold are currently among the "hottest" assets by activity, while Crypto.com Coin and Holo are among the "coldest."
- Actionable Tip: Use an activity screener to generate research ideas. "Hot" assets may be nearing a price pivot, while "cold" assets are more likely to continue their current trend.
Conclusion
This week was a perfect example of the crypto market's complexity. While a new Bitcoin all-time high dominated headlines, deeper data revealed a more nuanced story. We saw the powerful influence of macroeconomic policy, the bullish conviction of large whale investors, and the cautionary signs of retail FOMO. As usual, this is not financial advice.
Subscribe to our YouTube channel, our Substack, or follow us on Santiment Insights.