This Week in Crypto, Full Written Summary: W1 November


Bitcoin Dips Below $100k: Are Whales Signaling More Pain Ahead?
Executive Summary
For those short on time, here are the key takeaways from this week's crypto market analysis:
- Whale Activity: Large Bitcoin whales have sold over 32,500 BTC since mid-October, while retail traders are buying the dip—a historically bearish signal.
- Contrarian Signals: Key indicators like the MVRV and RSI have fallen into "opportunity zones," suggesting the market may be oversold.
- Altcoin Divergence: While major cryptos struggle, Cardano is seeing strong whale accumulation, and ZCash has tripled in price against a backdrop of widespread market disbelief.
- Macro Headwinds: Uncertainty around the Federal Reserve's interest rate cuts is a major factor contributing to the current market downturn and volatility.
Introduction
Welcome to our summary of "This Week in Crypto." Join Brian and Maksim as they analyze a turbulent start to November. Bitcoin briefly fell below the critical $100k mark, causing widespread panic among retail traders. But what were the large investors, or "whales," doing behind the scenes? This recap uncovers the key trends, from the surprising surge of privacy coins to the critical on-chain signals that could hint at what's next for crypto market.
Market Volatility: Bitcoin Dips Below $100k
The market faced intense volatility to start the month. Just a couple of days ago, Bitcoin’s price dropped to $98,900. Ethereum also showed weakness, threatening to fall below the $3,000 level. This price action has created a tense environment for traders. Brian noted that the market often moves in the opposite direction of crowd expectations, setting the stage for surprising shifts.
- Key Data: Bitcoin’s price fell to $98,900, while Ethereum neared the $3,000 support level.
- Actionable Tip: Pay attention to crowd sentiment during major price drops. Extreme fear can sometimes precede a market bounce.
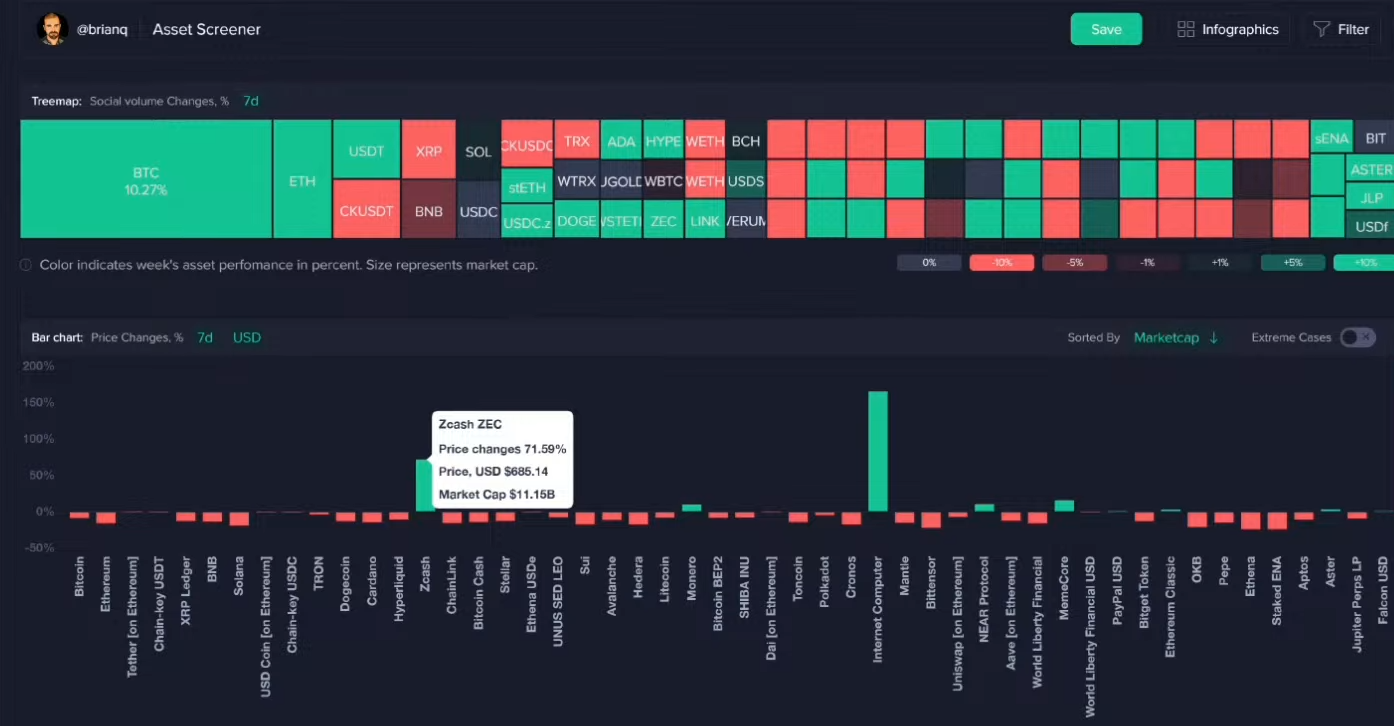
Altcoin Winners and Losers: ZCash Surges
While major assets like Bitcoin and Ethereum saw declines, the privacy coin sector stood out. ZCash was a top performer, bucking the downward trend. This continues a pattern seen since early October, where privacy coins like ZCash and Monero have experienced isolated breakouts. On the other hand, major altcoins like Solana suffered significant losses, dropping nearly 19% over the past week.
- Key Data: Solana's price fell by nearly 19% over the past week.
- Actionable Tip: Look for trends within specific crypto sectors, like privacy coins. Sometimes, an entire sector can move together, even when the broader market is down.
Crowd Psychology: The Perils of Emotional Trading
Sentiment data for Ethereum revealed extreme emotional swings. The market saw its second-most bearish day in the last six months as the price neared $3,000. This fear quickly flipped to euphoria on the subsequent bounce, with traders rushing back in. Brian explained that these emotional overreactions are often punished by the market.
- Key Data: Ethereum sentiment recorded its second-most bearish day in the last six months before rapidly shifting to bullishness.
- Actionable Tip: Use sentiment analysis to gauge crowd emotion. Recognizing when the market is overly fearful or greedy can help you avoid making impulsive decisions.
Market Movers: Social Volume Spikes for Top Cryptos
The first week of November brought a surge in market interest. Social media discussion for Bitcoin and Ethereum increased significantly. Despite this, the total crypto market cap fell by nearly 10% to $4.34 trillion. At the same time, trading volume rose by 10.5%. Brian pointed out that falling prices combined with rising volume is a classic recipe for volatility.
- Key Data: The total crypto market cap dropped by nearly 10% to $4.34 trillion, while trading volume increased by 10.5%.
- Actionable Tip: Cross-reference social media volume with price and trading volume. A spike in discussion during a price drop can indicate heightened market interest and potential for future volatility.
Whale vs. Retail Behavior: Who is Winning?
A major divergence has appeared between large and small investors. Since October 12th, key stakeholders have been selling. They have offloaded approximately 32,500 Bitcoin in that time. Meanwhile, small retail wallets have been aggressively buying the dip. Brian highlighted that historically, prices tend to follow the direction of the whales, not retail.
- Key Data: Key stakeholders (whales) have sold approximately 32,500 Bitcoin since October 12th.
- Actionable Tip: Track the holdings of different wallet tiers. A divergence where whales are selling while retail is buying can be a cautionary signal.
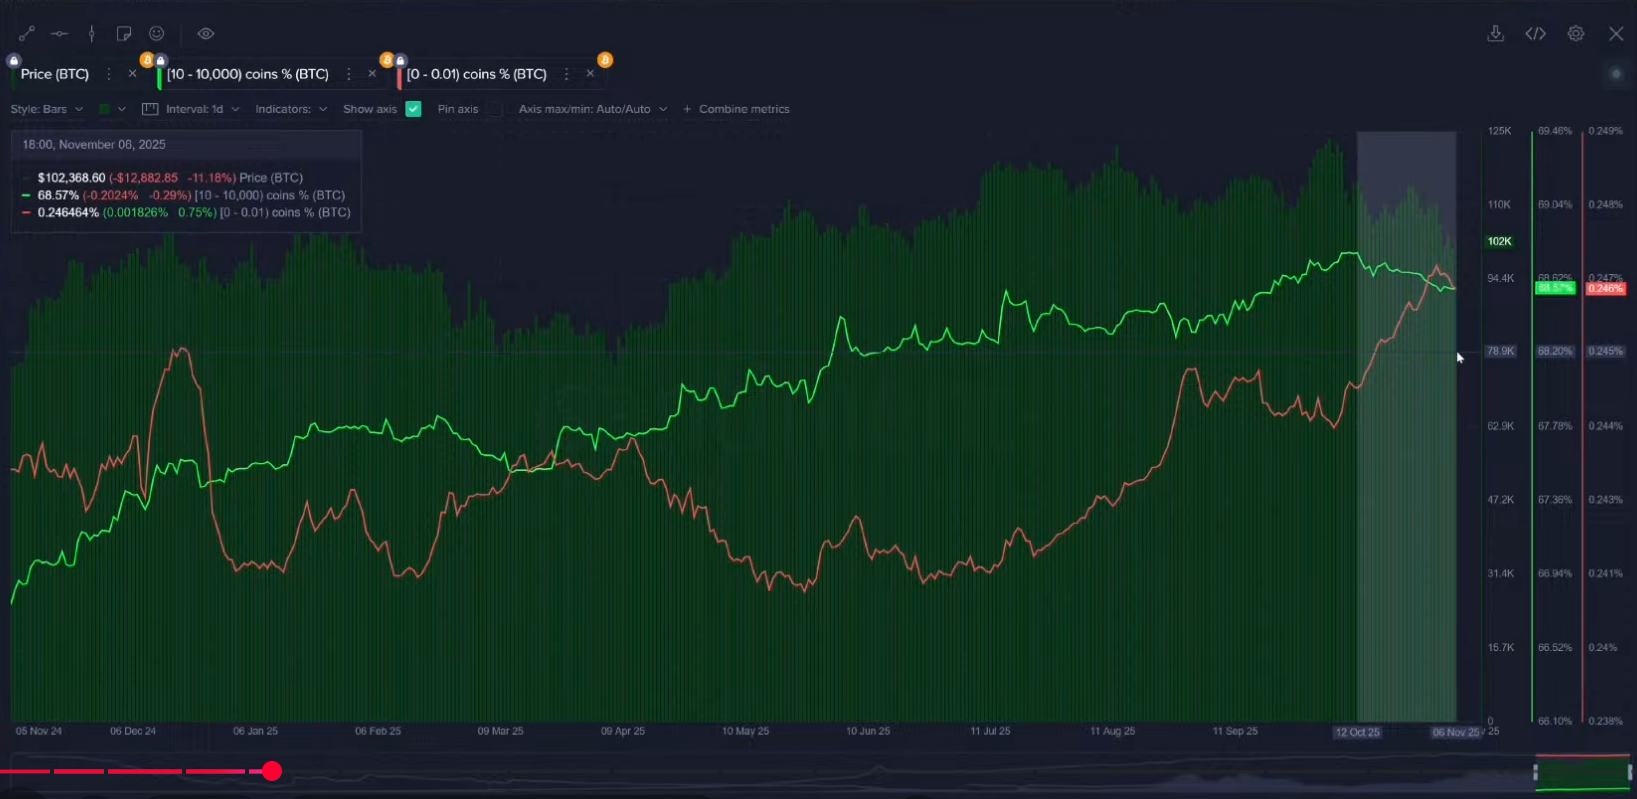
On-Chain Analysis: Identifying Bullish and Bearish Zones
Brian shared a powerful framework for analyzing market health. "Green zones" occur when whales are buying and retail is selling, which is typically bullish. Conversely, "red zones" happen when whales are selling and retail is buying. The market is currently in a red zone, suggesting the recent price decline is justified by smart money behavior.
- Key Data: The market is currently in a "red zone," defined by whales selling their holdings while retail investors are accumulating.
- Actionable Tip: Analyze the flow of funds between large and small wallets. When large wallets are accumulating, it is generally a healthier sign for the market.
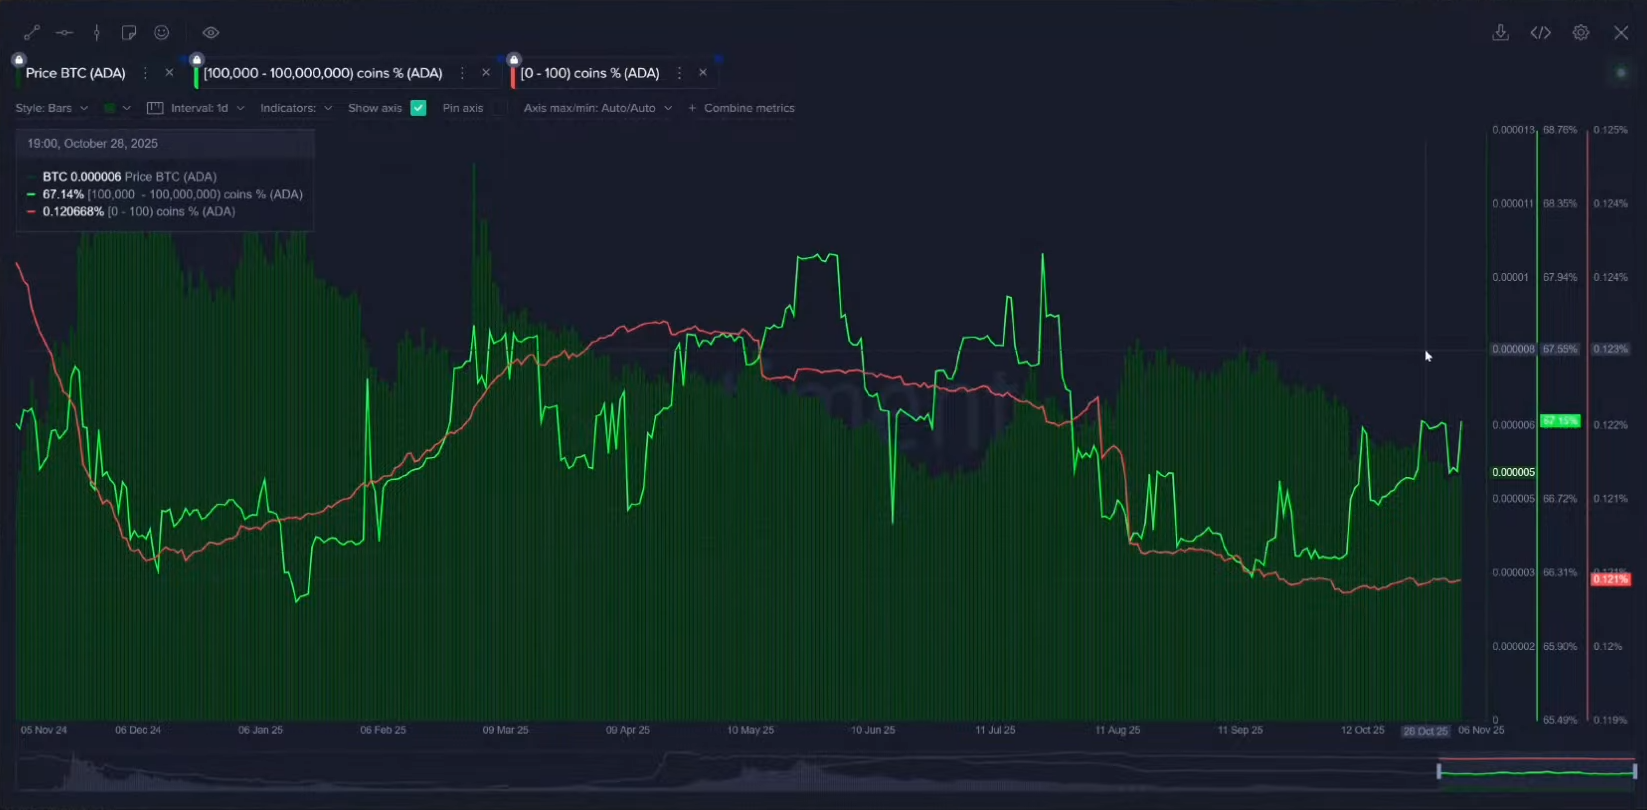
Cardano Analysis: A Bullish Divergence?
While the on-chain data for Bitcoin and Ethereum looks concerning, Cardano presents a different picture. Since early October, Cardano's key stakeholders have been steadily accumulating. At the same time, smaller retail holders have remained flat. This pattern suggests that large investors are confident in Cardano's future.
- Key Data: Since early October, Cardano's key stakeholders have been steadily accumulating, while retail holdings have remained flat.
- Actionable Tip: Compare the on-chain behavior of different top assets. An asset showing whale accumulation while others see selling can be a sign of relative strength.
MVRV Indicator: Spotting Bitcoin Buying Opportunities
The Market Value to Realized Value (MVRV) ratio indicates that average Bitcoin traders are currently at a loss. The 30-day MVRV is at -8.3%, and the 365-day MVRV is at -5.1%. Brian described this as an "opportunity zone." The most reliable buy signals historically occur when both short-term and long-term MVRV are negative.
- Key Data: The 30-day MVRV is at -8.3%, and the 365-day MVRV is at -5.1%, indicating average traders are at a loss.
- Actionable Tip: Use the MVRV ratio to understand trader profitability. When both short-term and long-term holders are underwater (negative MVRV), it has historically signaled less risk for new buyers.
Mean Dollar Invested Age: A Positive Sign for the Market?
Another encouraging sign is the Mean Dollar Invested Age for Bitcoin, which continues to decline. This metric tracks the average age of all investments in wallets. A downward trend means that older, dormant coins are being moved back into circulation, which is generally a sign of a healthy, active network.
- Key Data: The Mean Dollar Invested Age for Bitcoin is on a continuous downward trend.
- Actionable Tip: Observe the Mean Dollar Invested Age metric. A falling line suggests increased network utility, while a rising line can indicate stagnation.

Bitcoin's RSI Hits a Yearly Low
The Relative Strength Index (RSI), a key momentum indicator, has fallen to its lowest level for Bitcoin since February. An RSI this low signals that the market has experienced significant downside pressure. While not a guarantee of a bottom, it suggests the selling may be overextended.
- Key Data: Bitcoin's Relative Strength Index (RSI) has reached its lowest point since February.
- Actionable Tip: Look at momentum indicators like the RSI. Extremely low readings can suggest that a market is oversold, though it does not guarantee an immediate reversal.
The Fed's Influence: How Rate Cuts are Impacting Crypto
Maksim and Brian discussed the macroeconomic picture. The market rally in early October was fueled by expectations of three Fed rate cuts. However, recent hawkish comments from the Fed have created uncertainty about whether a third cut will happen. This has likely contributed to the market's decline.
- Key Data: The market's recent decline is partly attributed to shifting expectations from three guaranteed Fed rate cuts to a more uncertain outlook.
- Actionable Tip: Stay informed about major macroeconomic events and central bank policies, as these can have a significant impact on risk assets like cryptocurrencies.

Altcoin Sentiment Check: XRP, Solana, and Dogecoin
A look at altcoin sentiment reveals interesting contrarian signals. Social media commentary on XRP(chart) shows a major spike in fear, which can often precede a price bottom. Dogecoin sentiment is also extremely bearish, yet its price has quietly risen 6% in the last three days. In contrast, Solana traders became too optimistic on a recent minor bounce, which was quickly punished.
- Key Data: Dogecoin's price has increased by 6% over the last three days, despite extremely bearish social sentiment.
- Actionable Tip: Analyze sentiment on an asset-by-asset basis. A strong divergence between price action and crowd sentiment can be a powerful contrarian indicator.
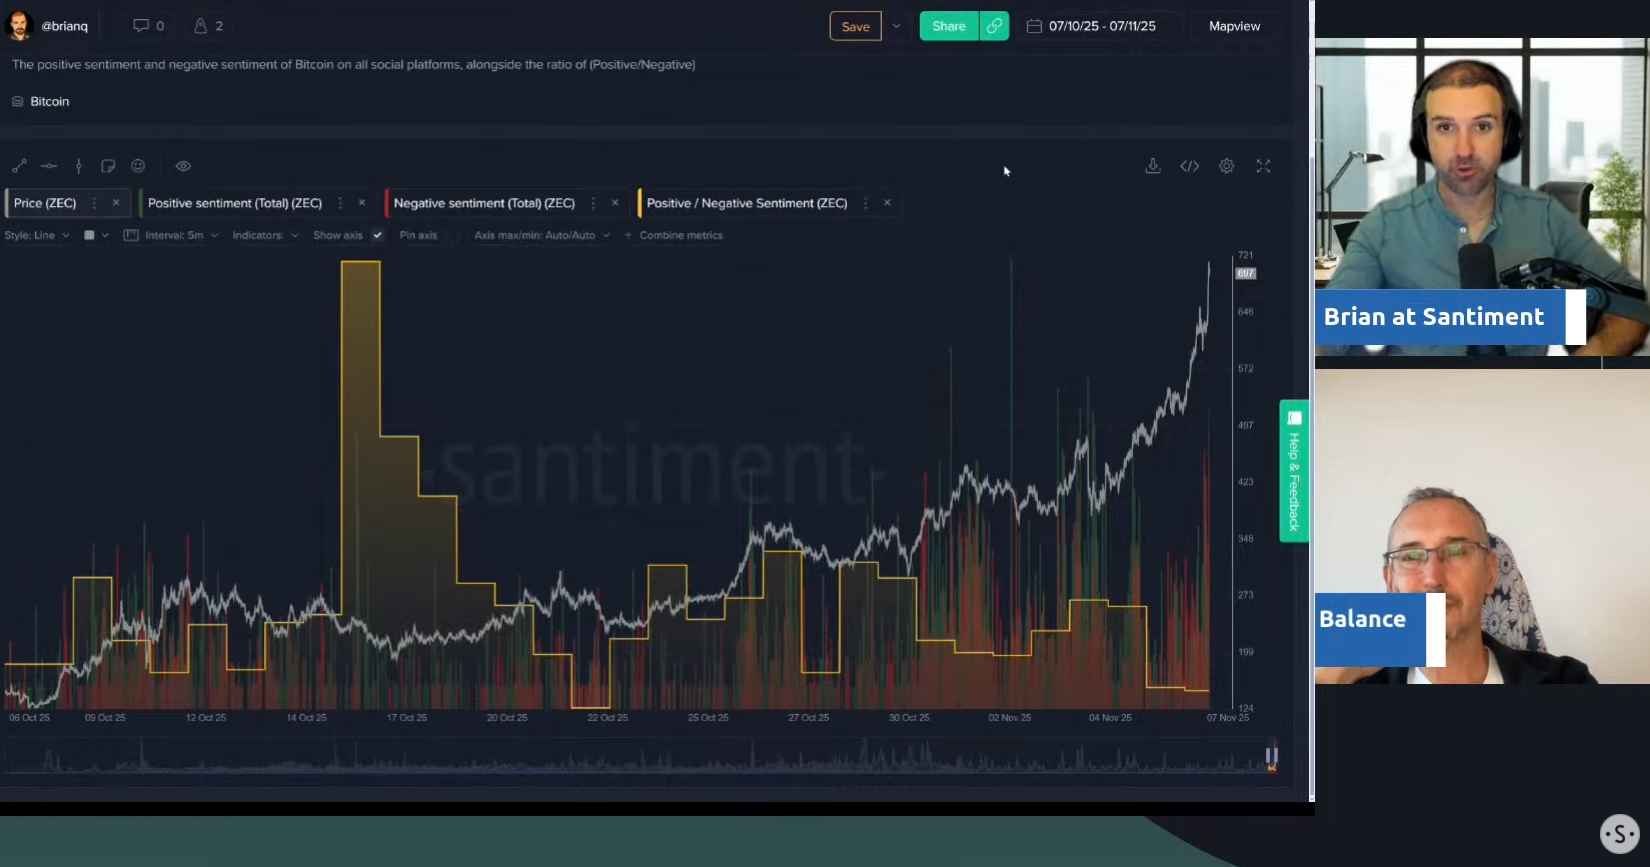
ZCash's Massive Rally Amidst Disbelief
ZCash has been on a remarkable run, tripling in price in just over two weeks. What's fascinating is that social sentiment is overwhelmingly negative. Brian noted that the crowd refuses to believe the rally is real, calling it a "bull trap." This widespread disbelief is ironically adding fuel to the fire.
- Key Data: ZCash's price has tripled (a 200% increase) in just over two weeks, while social sentiment remains negative.
- Actionable Tip: When an asset rallies strongly against a backdrop of widespread disbelief, it can be a sign of a powerful trend. The lack of FOMO can allow a rally to continue longer than expected.
XRP's Network Growth Signals a Potential Bottom
XRP recently registered its second-largest spike in network growth for the entire year(chart). Brian explained that a sudden surge in the creation of new addresses is often a reversal indicator. A similar spike marked a previous top, suggesting this one could signal a potential bottom for XRP's price.
- Key Data: XRP recorded its second-largest spike in new address creation for the year.
- Actionable Tip: Monitor network growth for major assets. A sudden, massive spike in new users after a long price decline can sometimes signal that a bottom is forming.
Coinbase App Ranking: A Contrarian Indicator?
In response to a viewer's question, Maksim and Brian analyzed the Coinbase app's store ranking. The app has climbed from 280th to 136th overall in just one week. Maksim noted that a high ranking is typically a sign of retail euphoria and often coincides with a market top. Seeing its popularity rise while prices are falling is an unusual and potentially bearish signal.
- Key Data: The Coinbase app's ranking jumped from 280th to 136th in one week.
- Actionable Tip: Keep an eye on the app store rankings of major crypto exchanges. A surge in popularity can be a useful proxy for measuring retail investor FOMO.

Conclusion
This week's analysis reveals a market gripped by fear and uncertainty. Key takeaways include the concerning trend of whales selling to retail investors, mixed signals from on-chain data, and the powerful influence of macroeconomic news. However, indicators like the MVRV and RSI suggest that the market may be in an opportunity zone after a period of intense selling.
To get the full analysis, be sure to watch the complete livestream. To get more data-driven crypto analysis, subscribe to our YouTube channel, our Substack, or follow us on Santiment Insights.