That doesn't look good

We’ll keep this update brief.
As you may have seen on our social channels, we’ve recently rolled out our initial set of on-chain metrics for the Solana ecosystem. Prior to this launch, I spent considerable time experimenting with these metrics during their beta phase. Our main question was whether the behavioral patterns we’ve identified over the years - particularly those related to retail participants and whales - would also apply to SOL and its memecoins.
The short answer: they do.
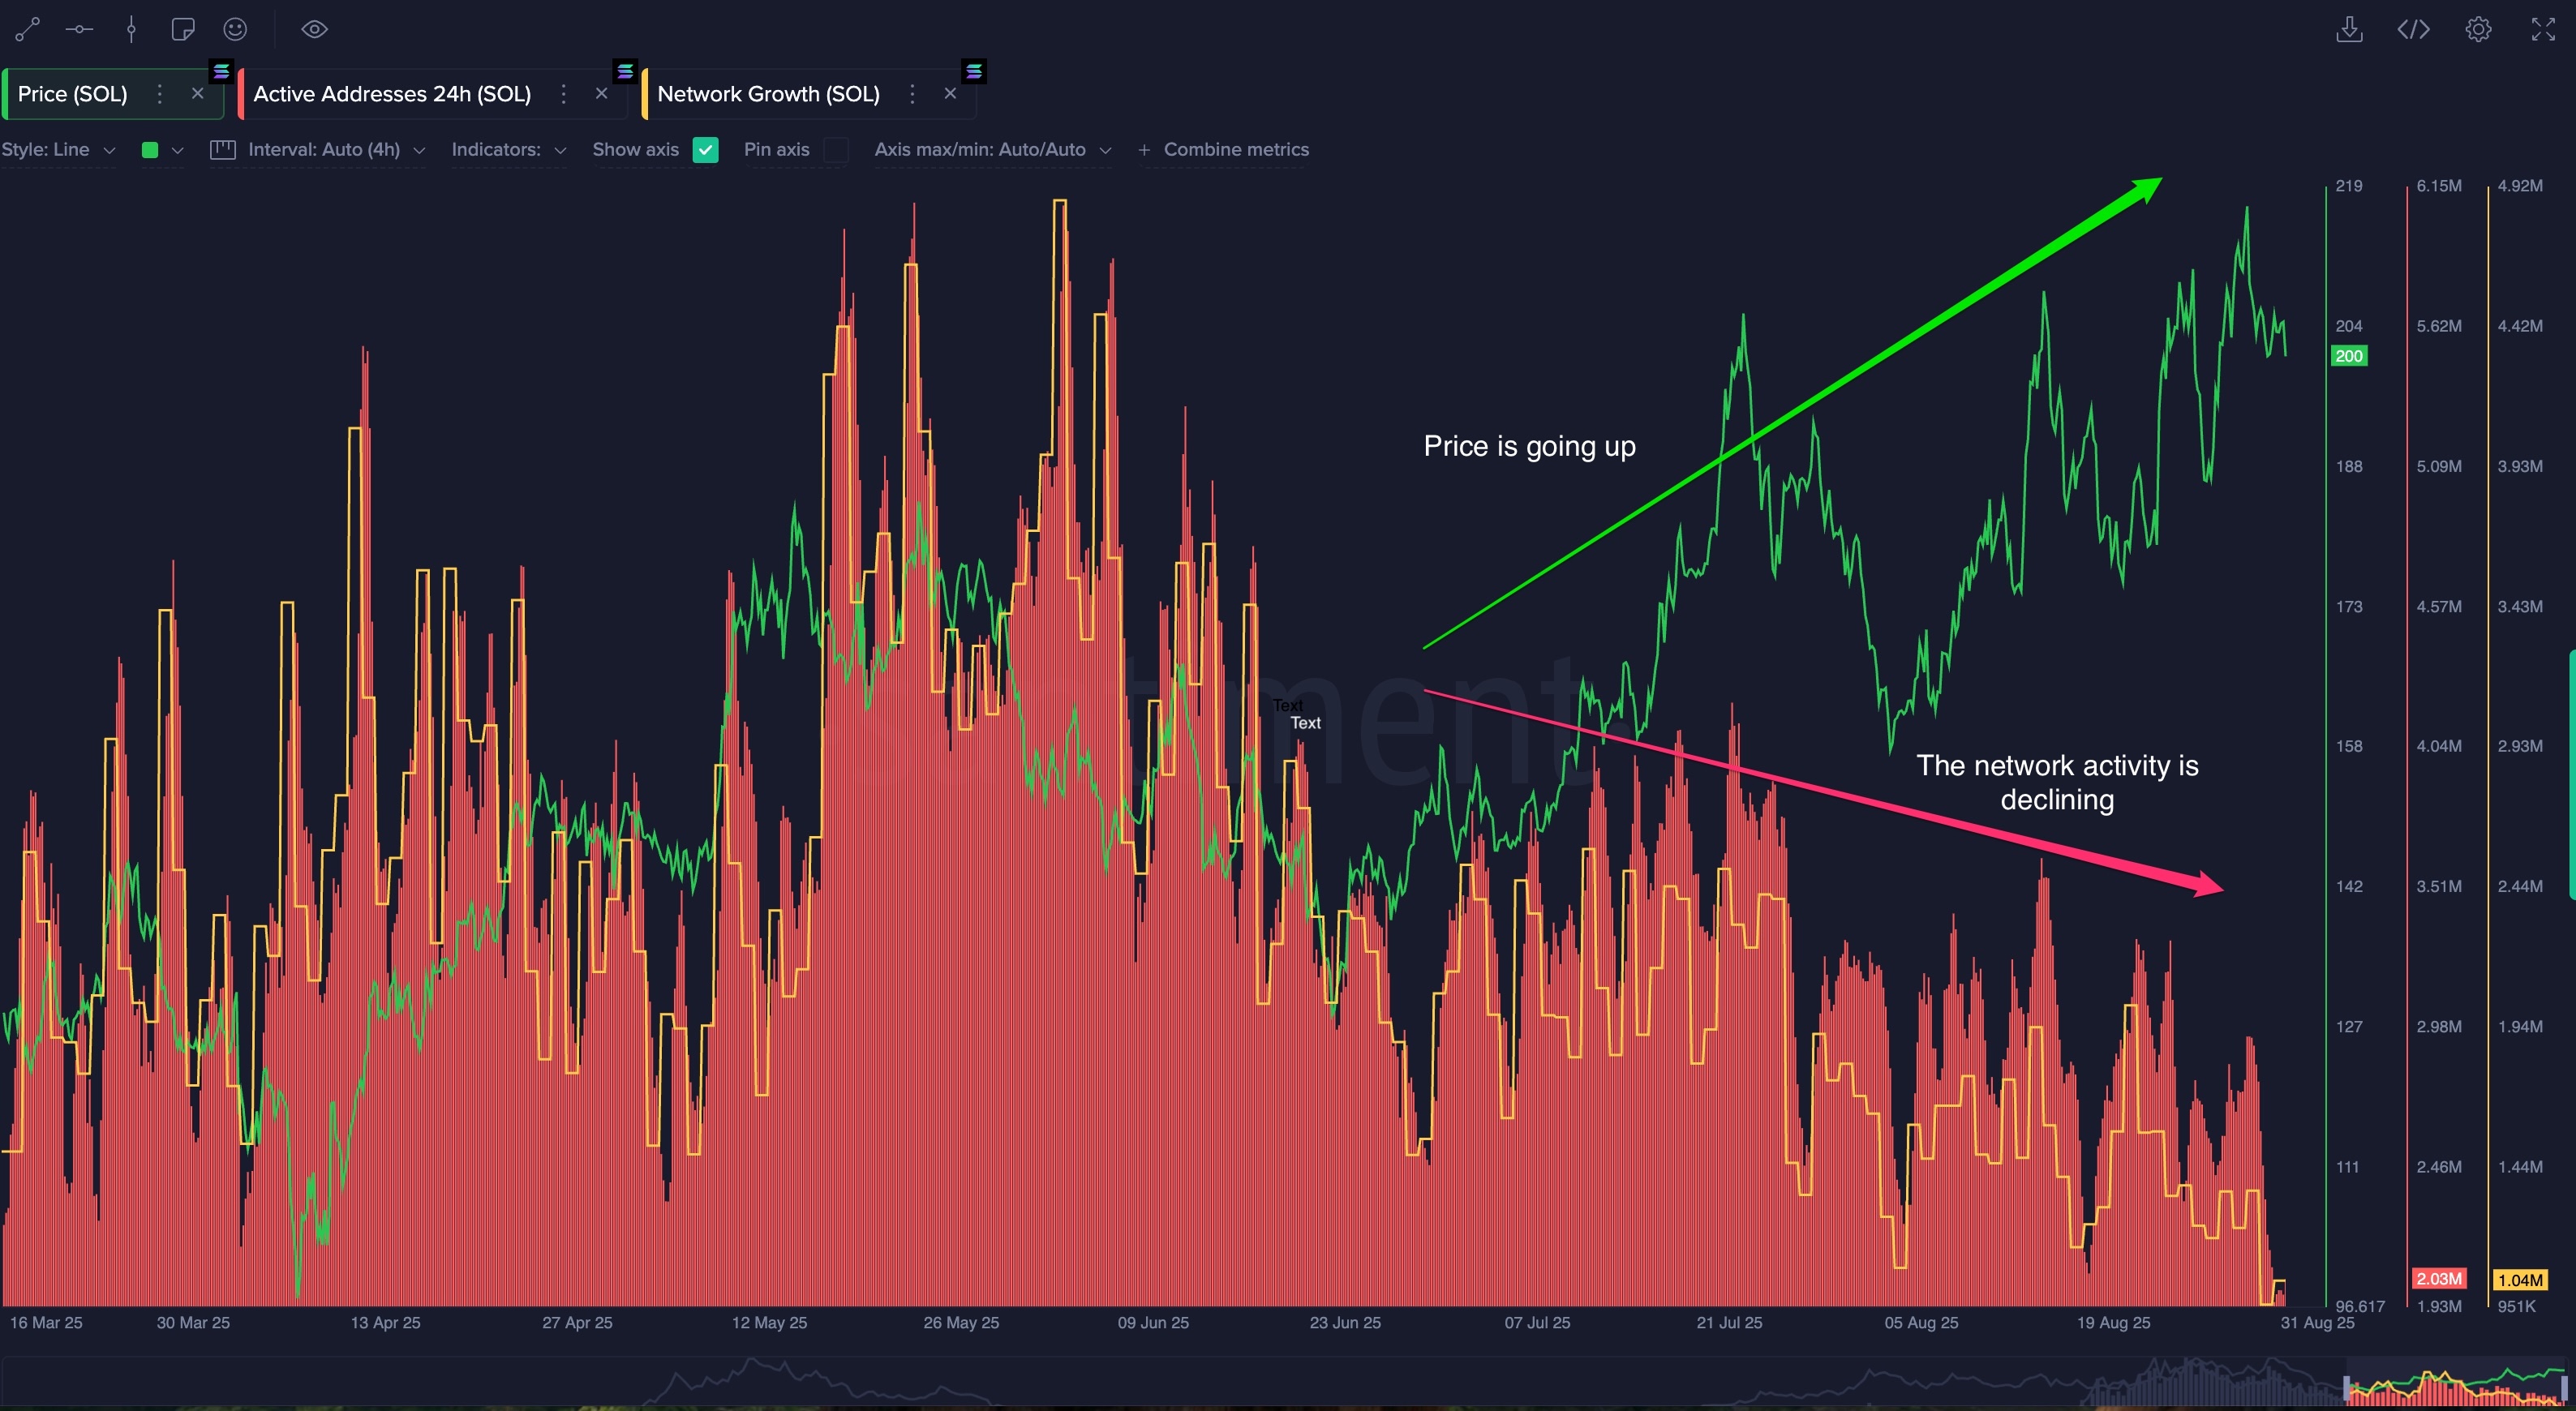
We’ve observed several familiar patterns, but one that stands out is what I like to call “divergence in the chain” (don’t take the name too literally). If you’ve followed my previous insights, you might recognize this approach. For those who haven’t (I tend to keep a low profile), here’s a quick explanation - though, as the attached screenshot shows, sometimes a picture says it best.
Currently, the data reveals a clear case of bearish divergence: while the price continues to push upward, underlying network metrics suggest the current trend is losing momentum. Historically, this kind of setup often precedes a sharp move in the opposite direction.
While this isn’t trading advice, it’s a pattern that has played out in similar contexts about 90% of the time.
If you’re reading this insight after the fact, let us know in the comments how things played out for you.