Morpho Metrics Are Ready at Your Fingertips Any Time!

Morpho is a decentralized finance (DeFi) protocol designed to optimize yields in lending and borrowing markets. It operates as a layer on top of existing protocols like Compound and Aave, improving the efficiency of capital allocation by matching lenders and borrowers directly. This direct matching reduces intermediaries, enhancing both the interest rates for lenders and borrowers. The protocol aims to offer seamless and more profitable interactions within the DeFi ecosystem.
Here is a breakdown of each metric that is offered on this new chart template, featuring exclusive for Morpho:
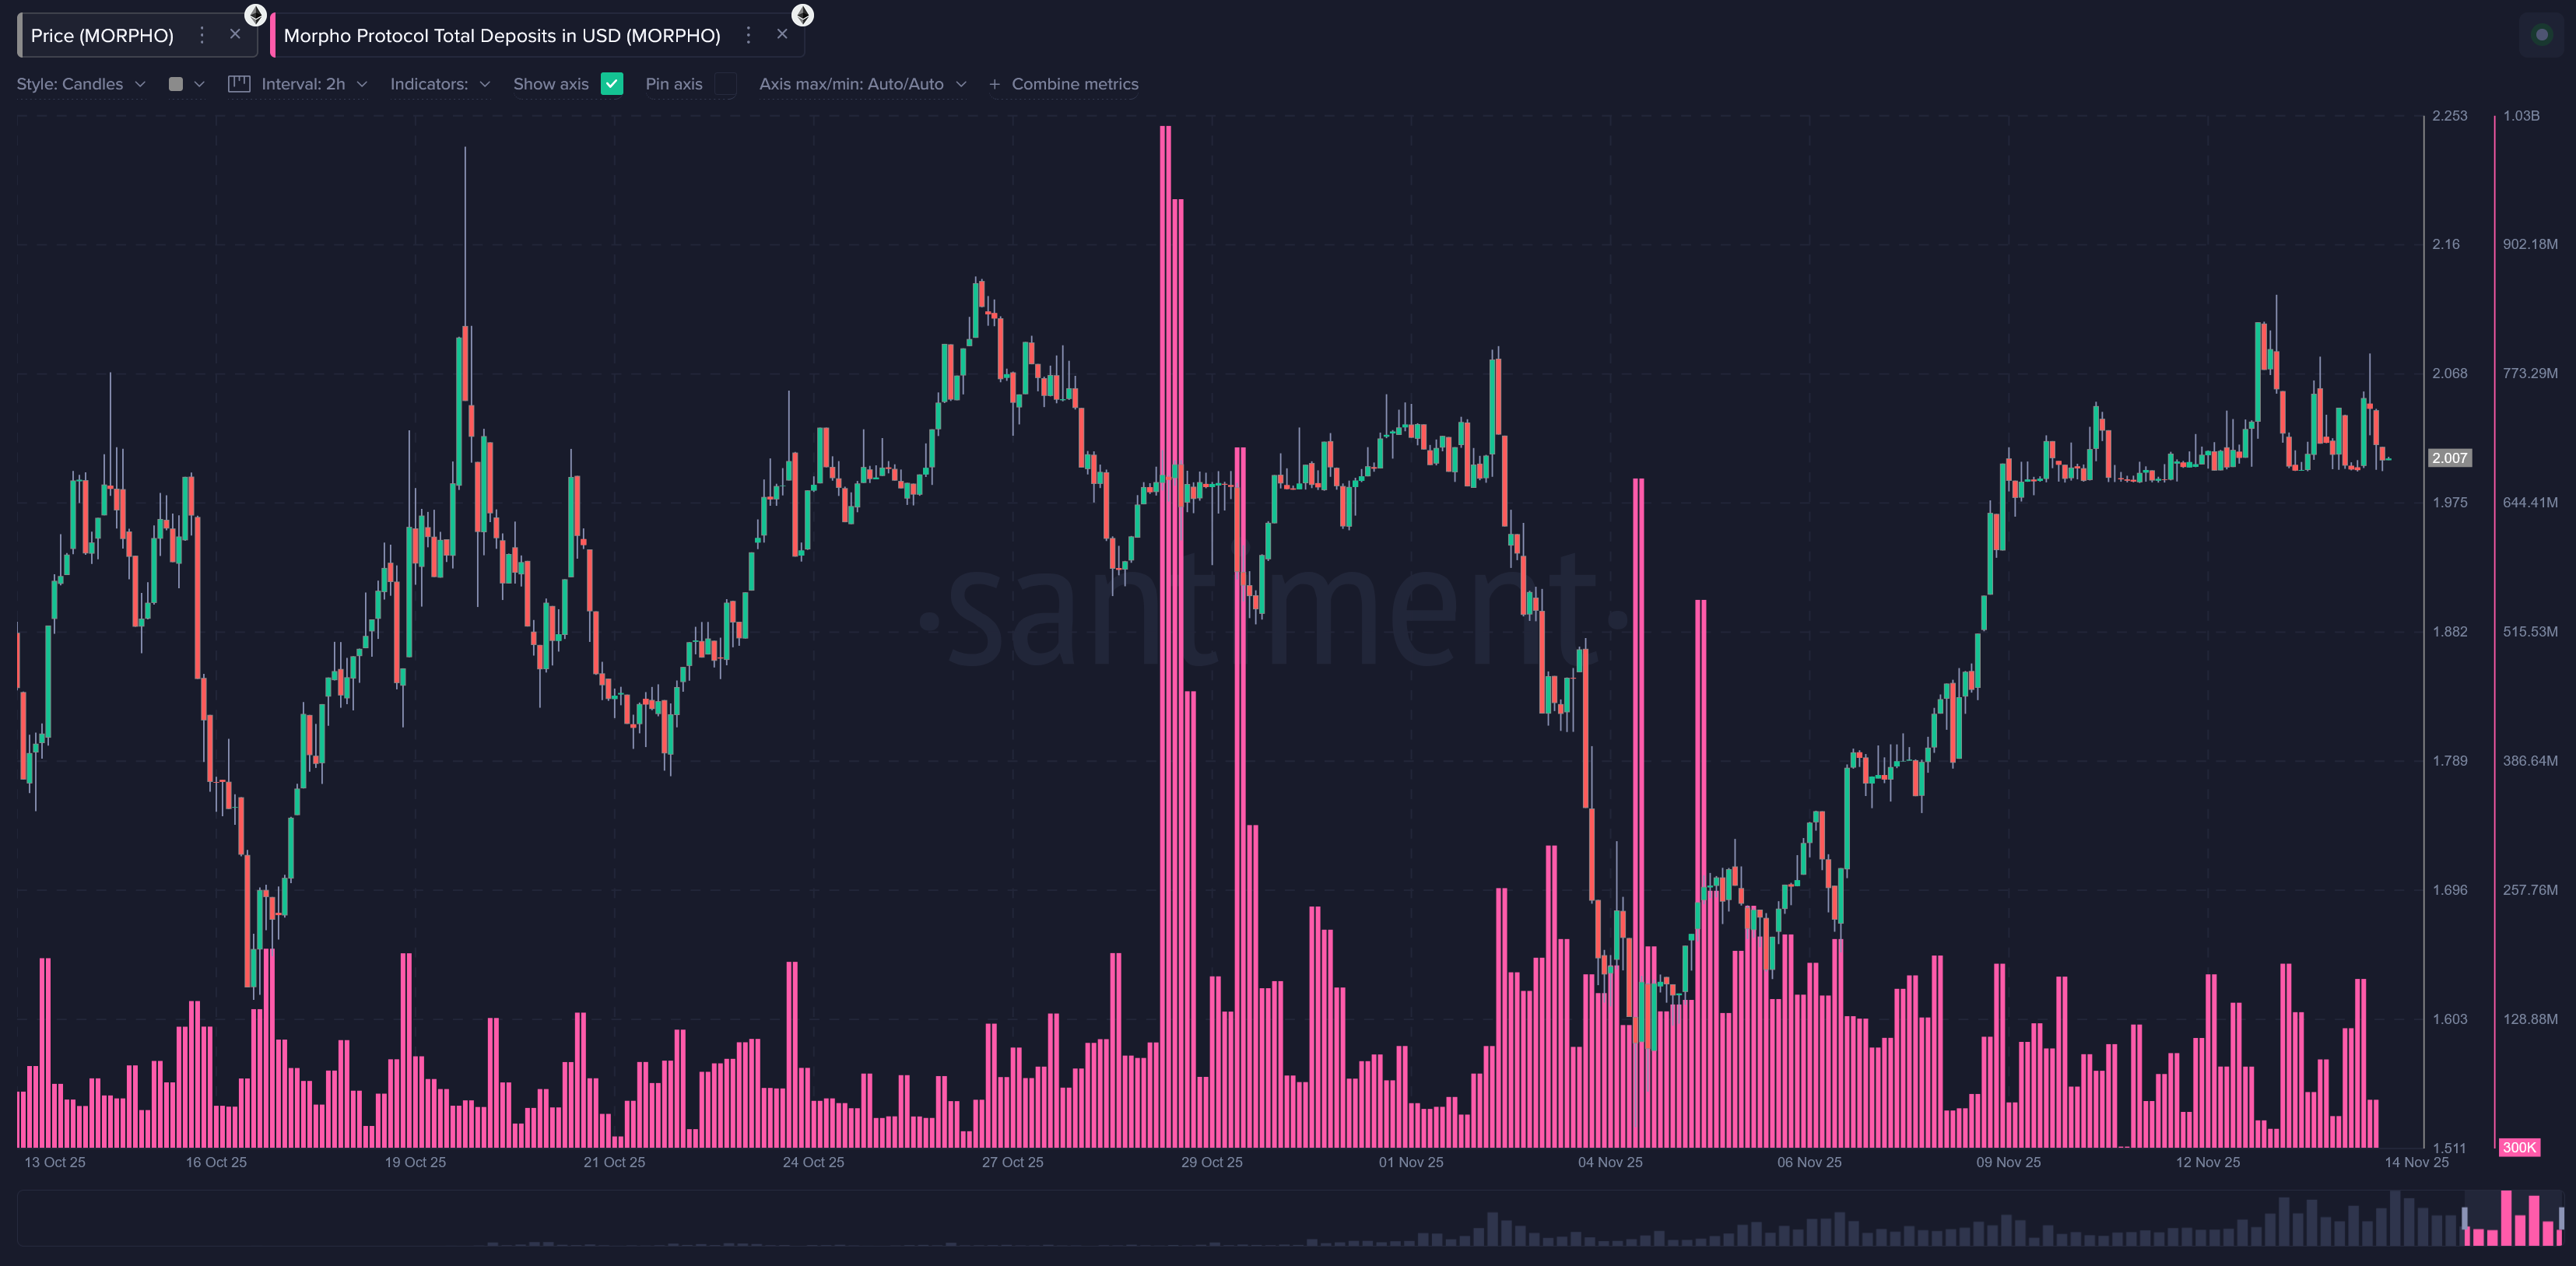
Morpho Protocol Total Deposits in USD
This shows the total USD value of deposits entering the protocol, across all supported assets. Deposits typically increase when users feel confident about the protocol’s yields and risk profile. A sharp rise may precede major yield opportunities, new incentives, or broader DeFi inflows. Drops may reflect caution, outflows to competing platforms, or short-term market fear. Deposits help gauge the inflow of fresh liquidity into the Morpho economy.
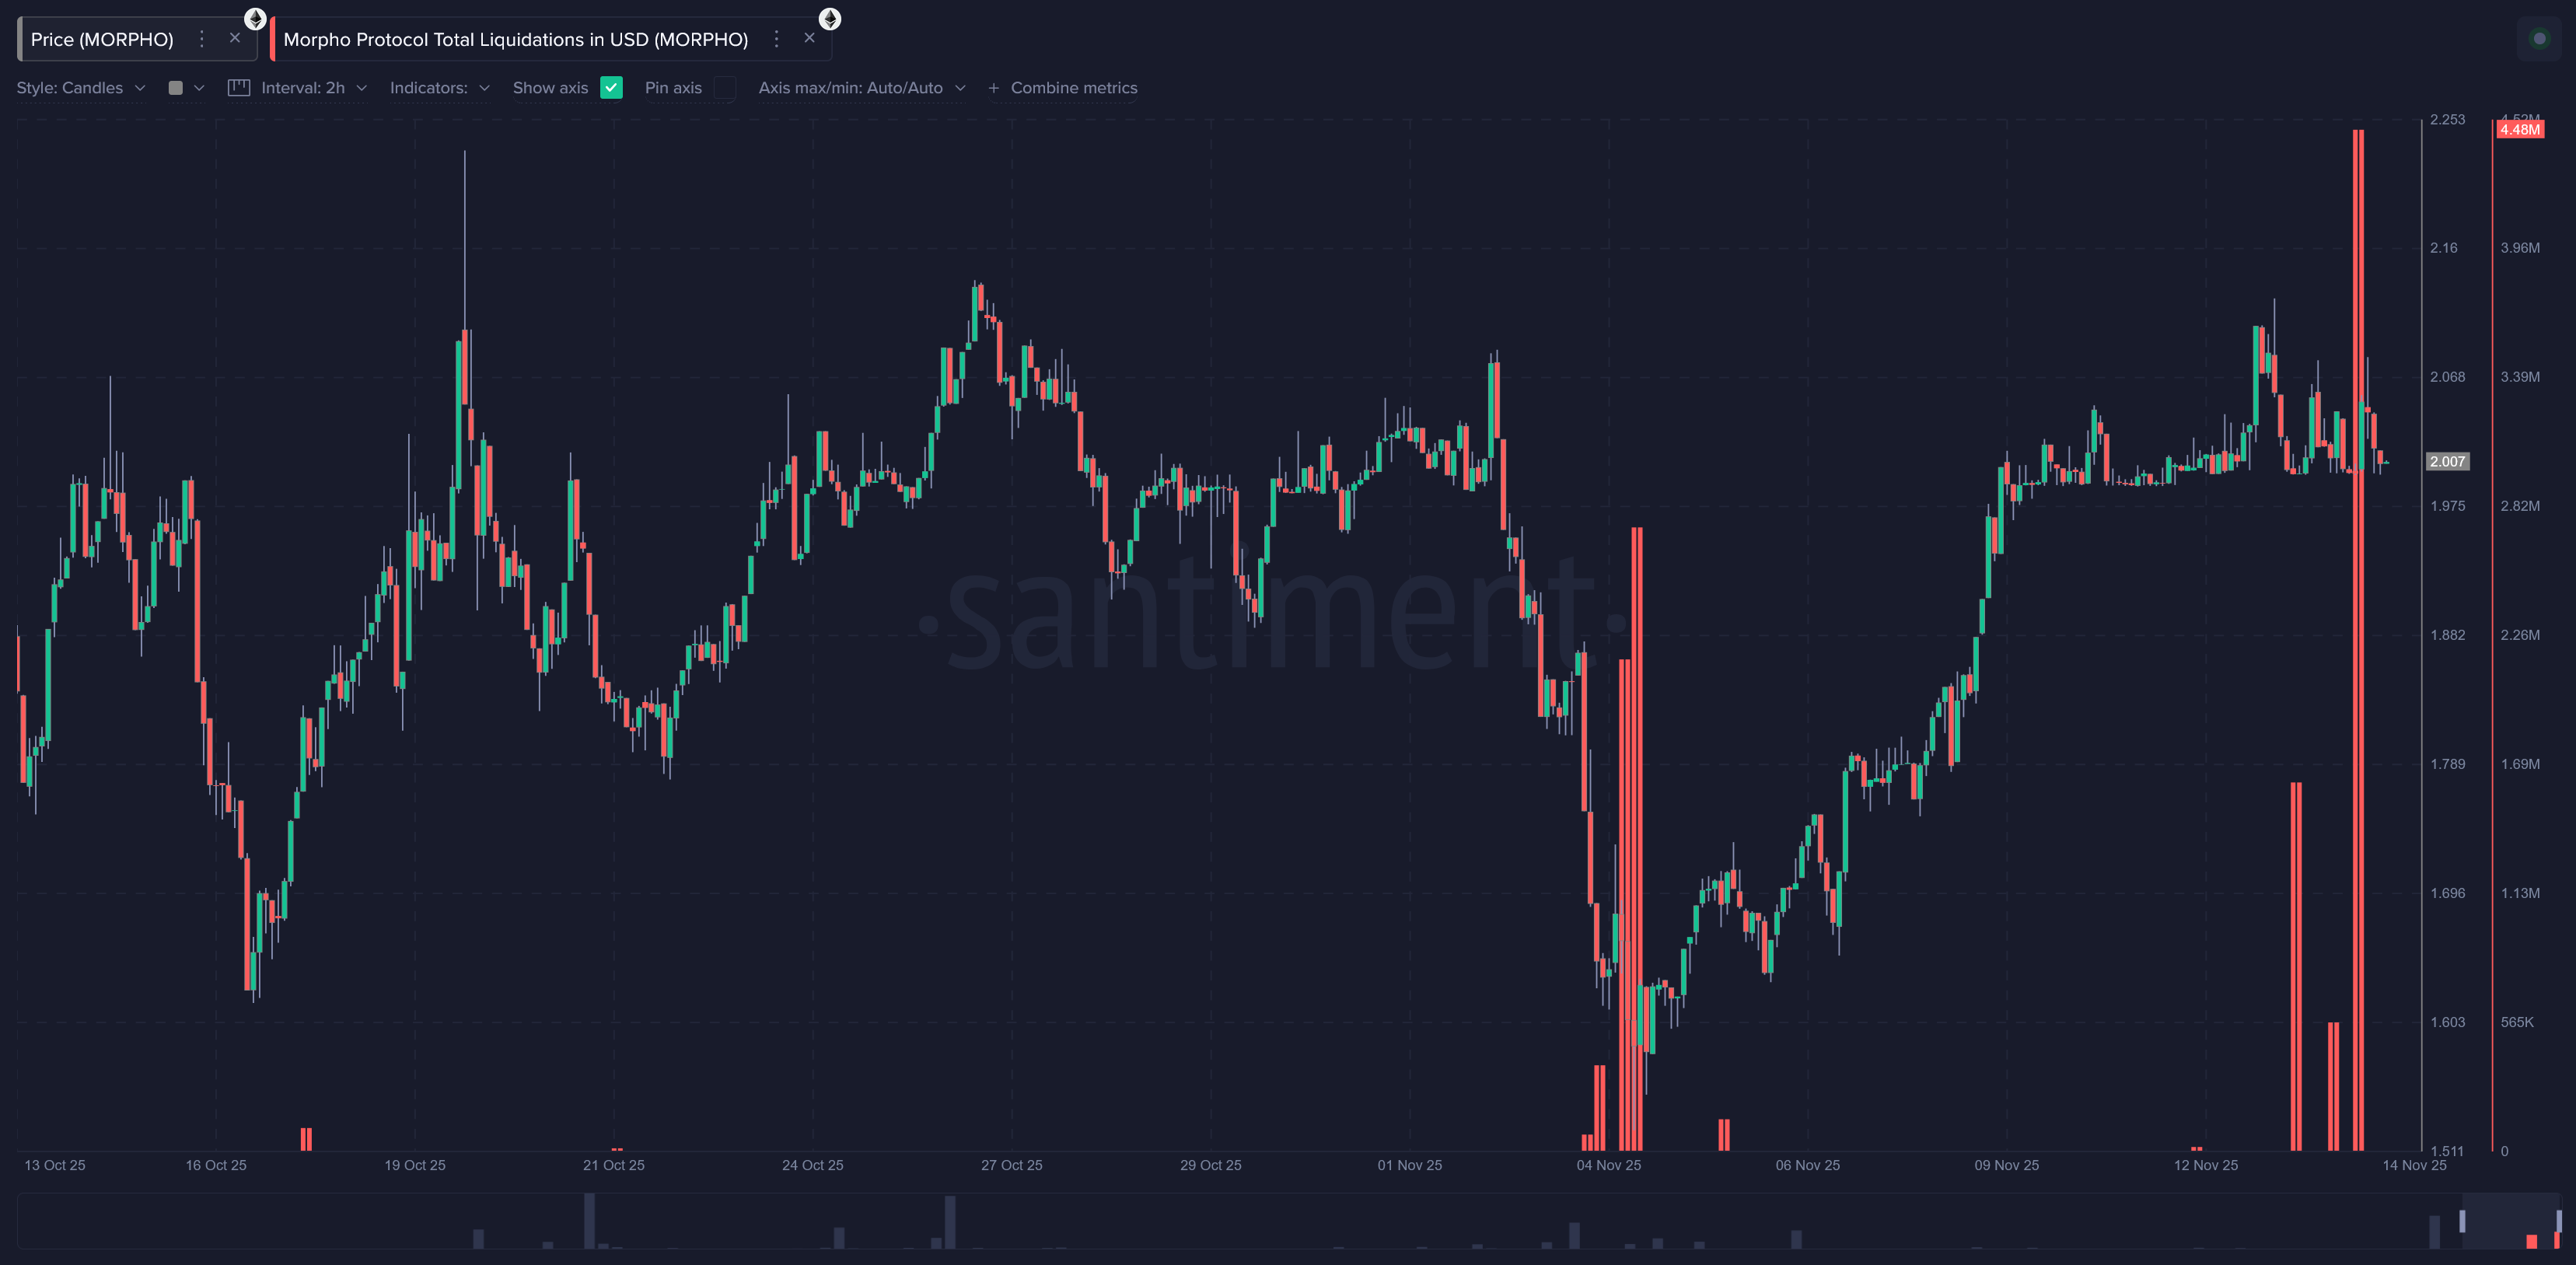
Morpho Protocol Total Liquidations in USD
This measures the total USD value of liquidated positions on Morpho. Liquidations happen when borrowers fail to maintain enough collateral to support their loans. Large spikes indicate high stress in the system, often caused by sharp price drops. Periods of few liquidations mean borrowers are managing risk well or markets are stable. Traders often use liquidation data to anticipate forced selling events or future price turbulence.
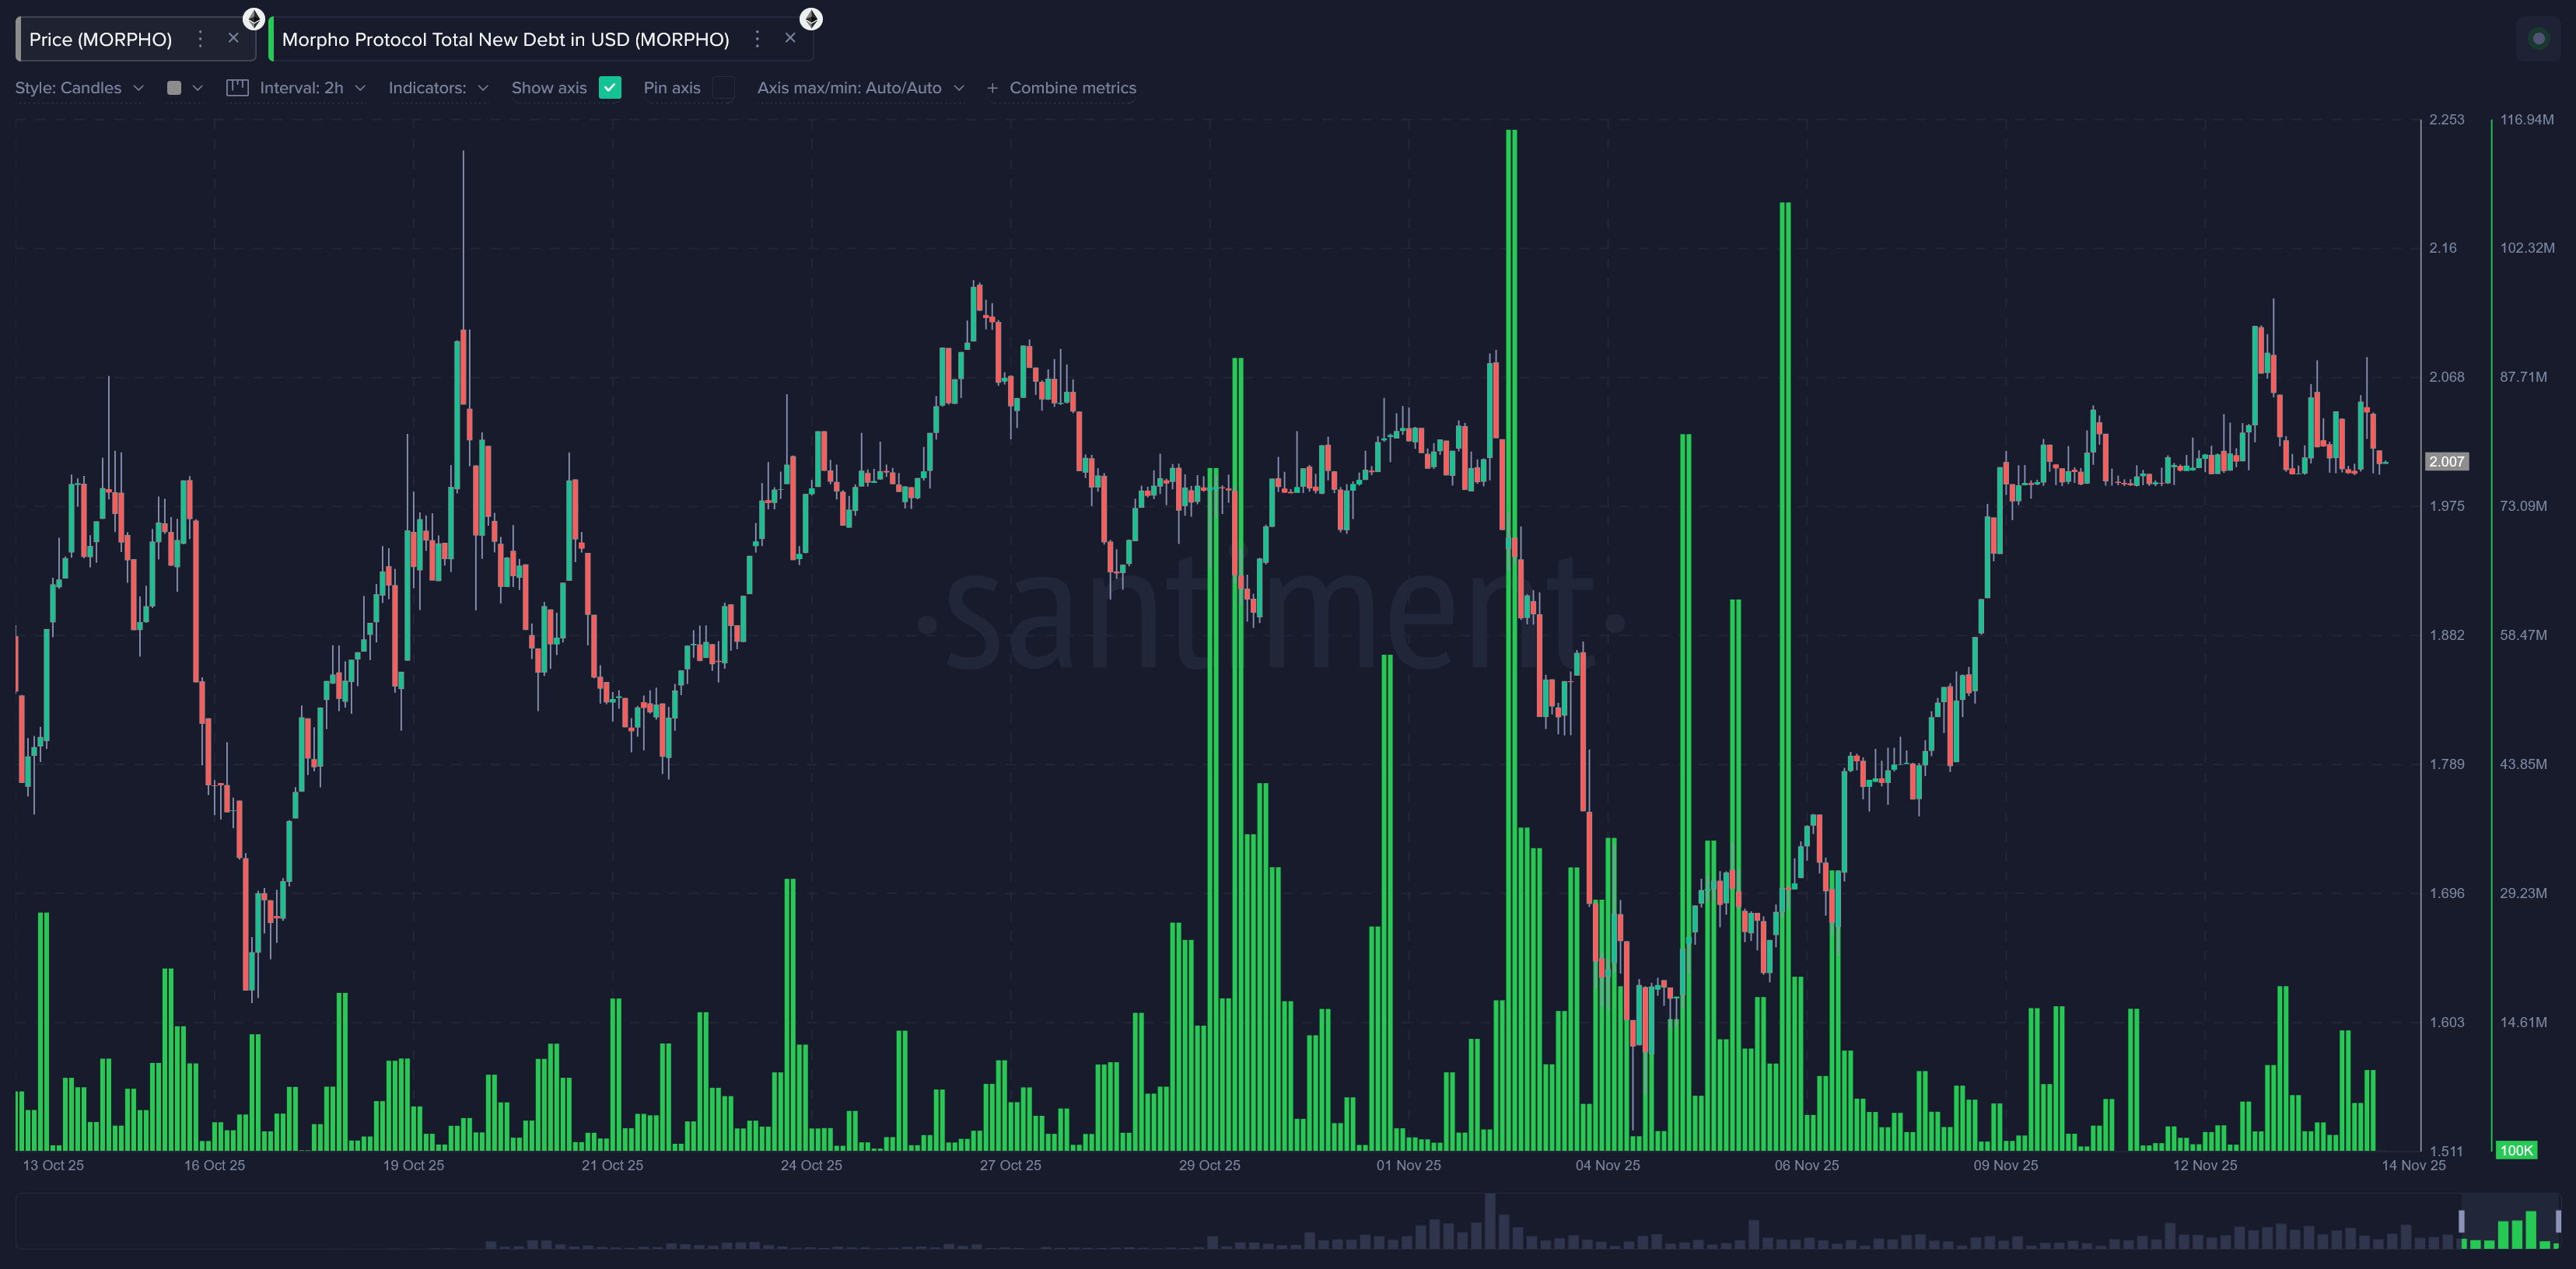
Morpho Protocol Total New Debt in USD
This metric shows the total value of new loans (newly opened debt) taken within a given period, converted to USD. Surges in new debt often signal bullish sentiment, as traders borrow to chase opportunities. It is a forward-looking indicator of risk-taking behavior on the platform. Low levels suggest users are cautious, avoiding leverage due to market uncertainty. Sudden spikes often align with price pumps, volatility windows, or arbitrage opportunities.
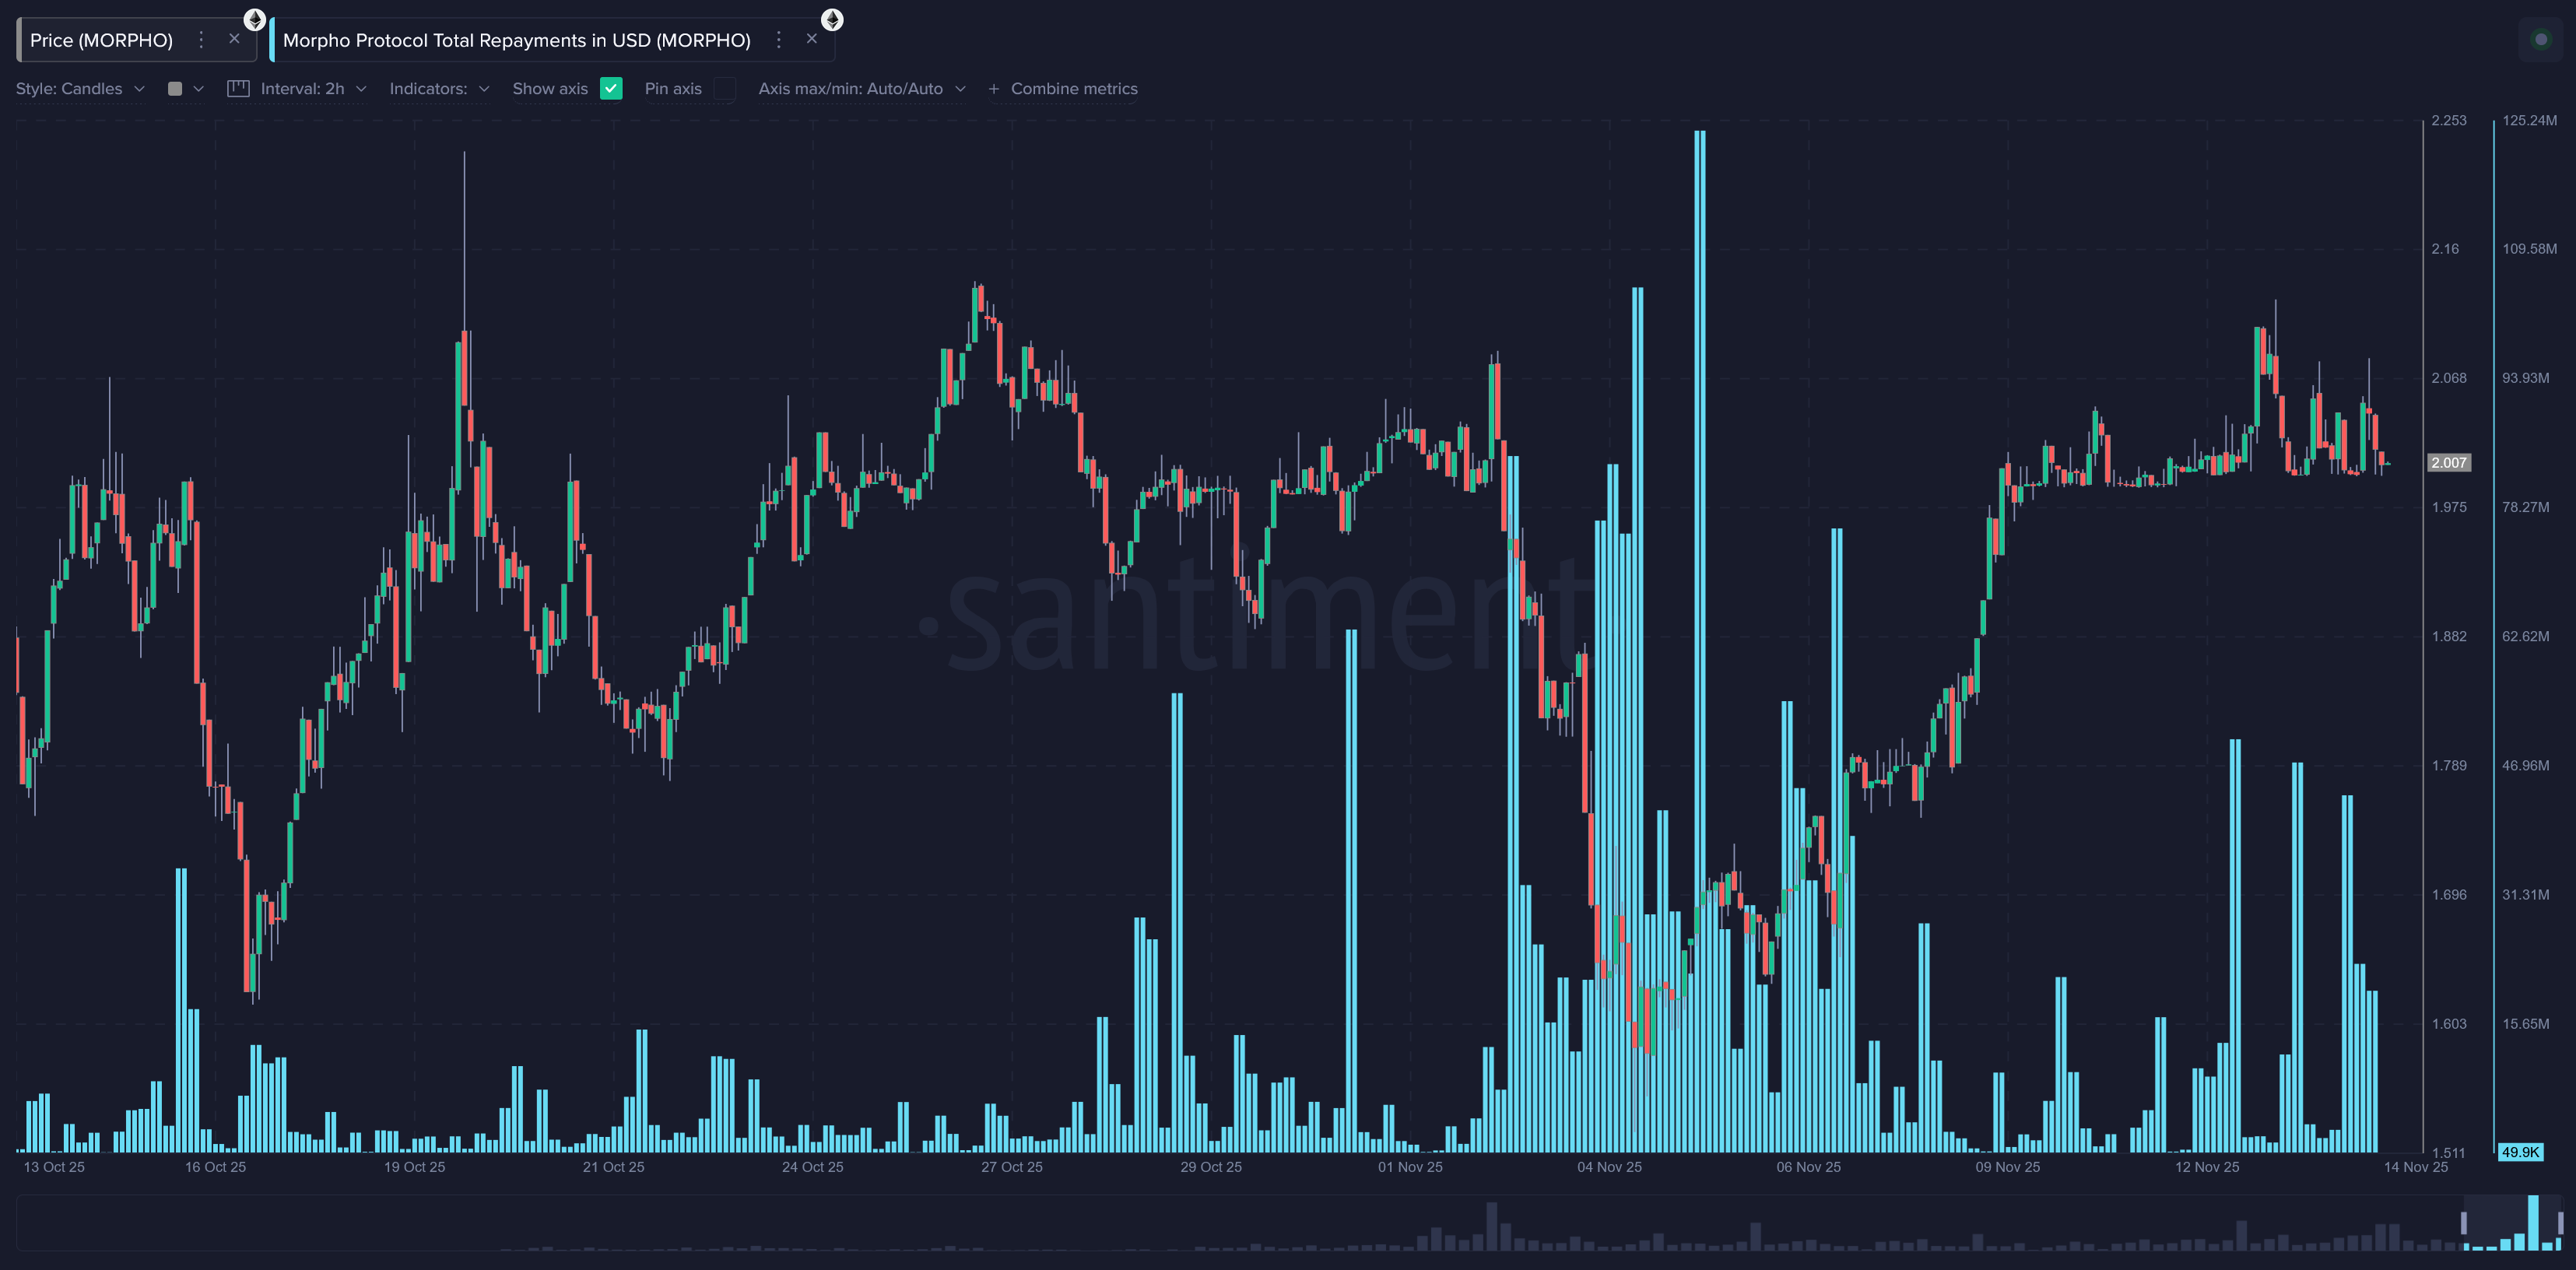
Morpho Protocol Total Repayments in USD
This represents the total value of debt repaid across Morpho, summed in USD. High repayment spikes generally mean borrowers are closing positions—often during volatility or liquidation risk. Regular repayment activity is healthy, as it shows a functioning credit cycle. Sharp drops in repayments may suggest users are holding their positions longer or are unable to repay due to market stress. Monitoring repayment bursts can reveal when borrowers are actively derisking.
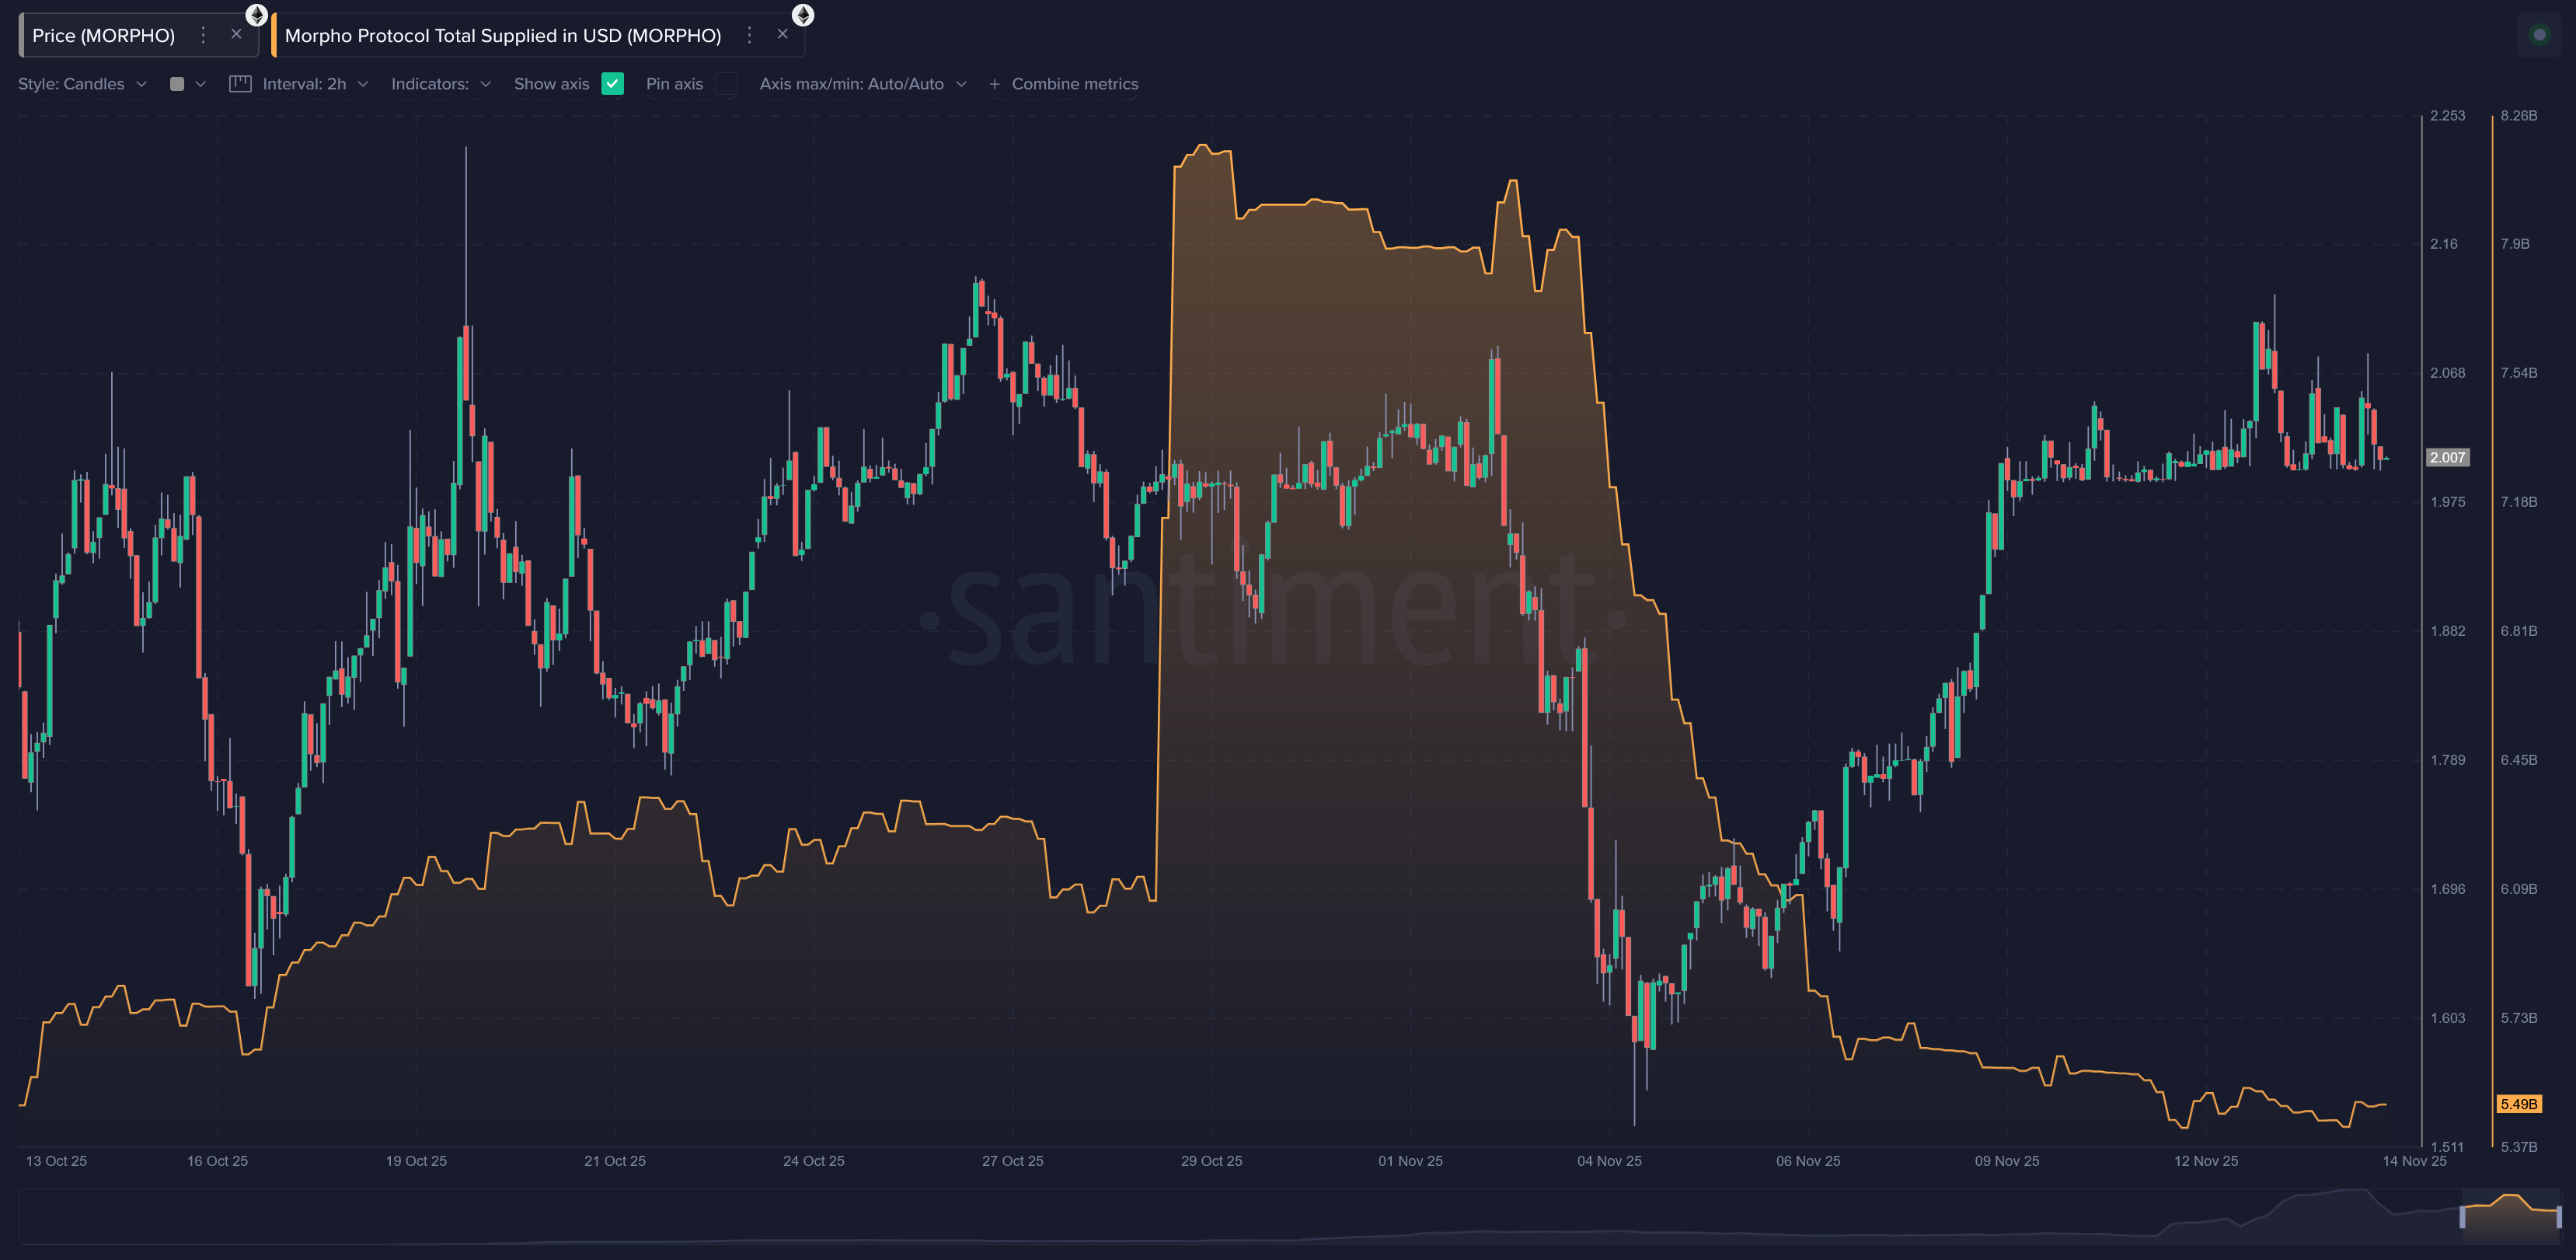
Morpho Protocol Total Supplied in USD
This metric tracks the total value supplied (lent) into Morpho’s lending pools, converted to USD. It reflects general confidence in the protocol and demand for lending yields. A rising supply trend suggests more users want to earn passive yield with their assets. Declines may indicate risk fears, migration to other yield platforms, or reward reductions. It is a core indicator of the protocol’s total liquidity health.
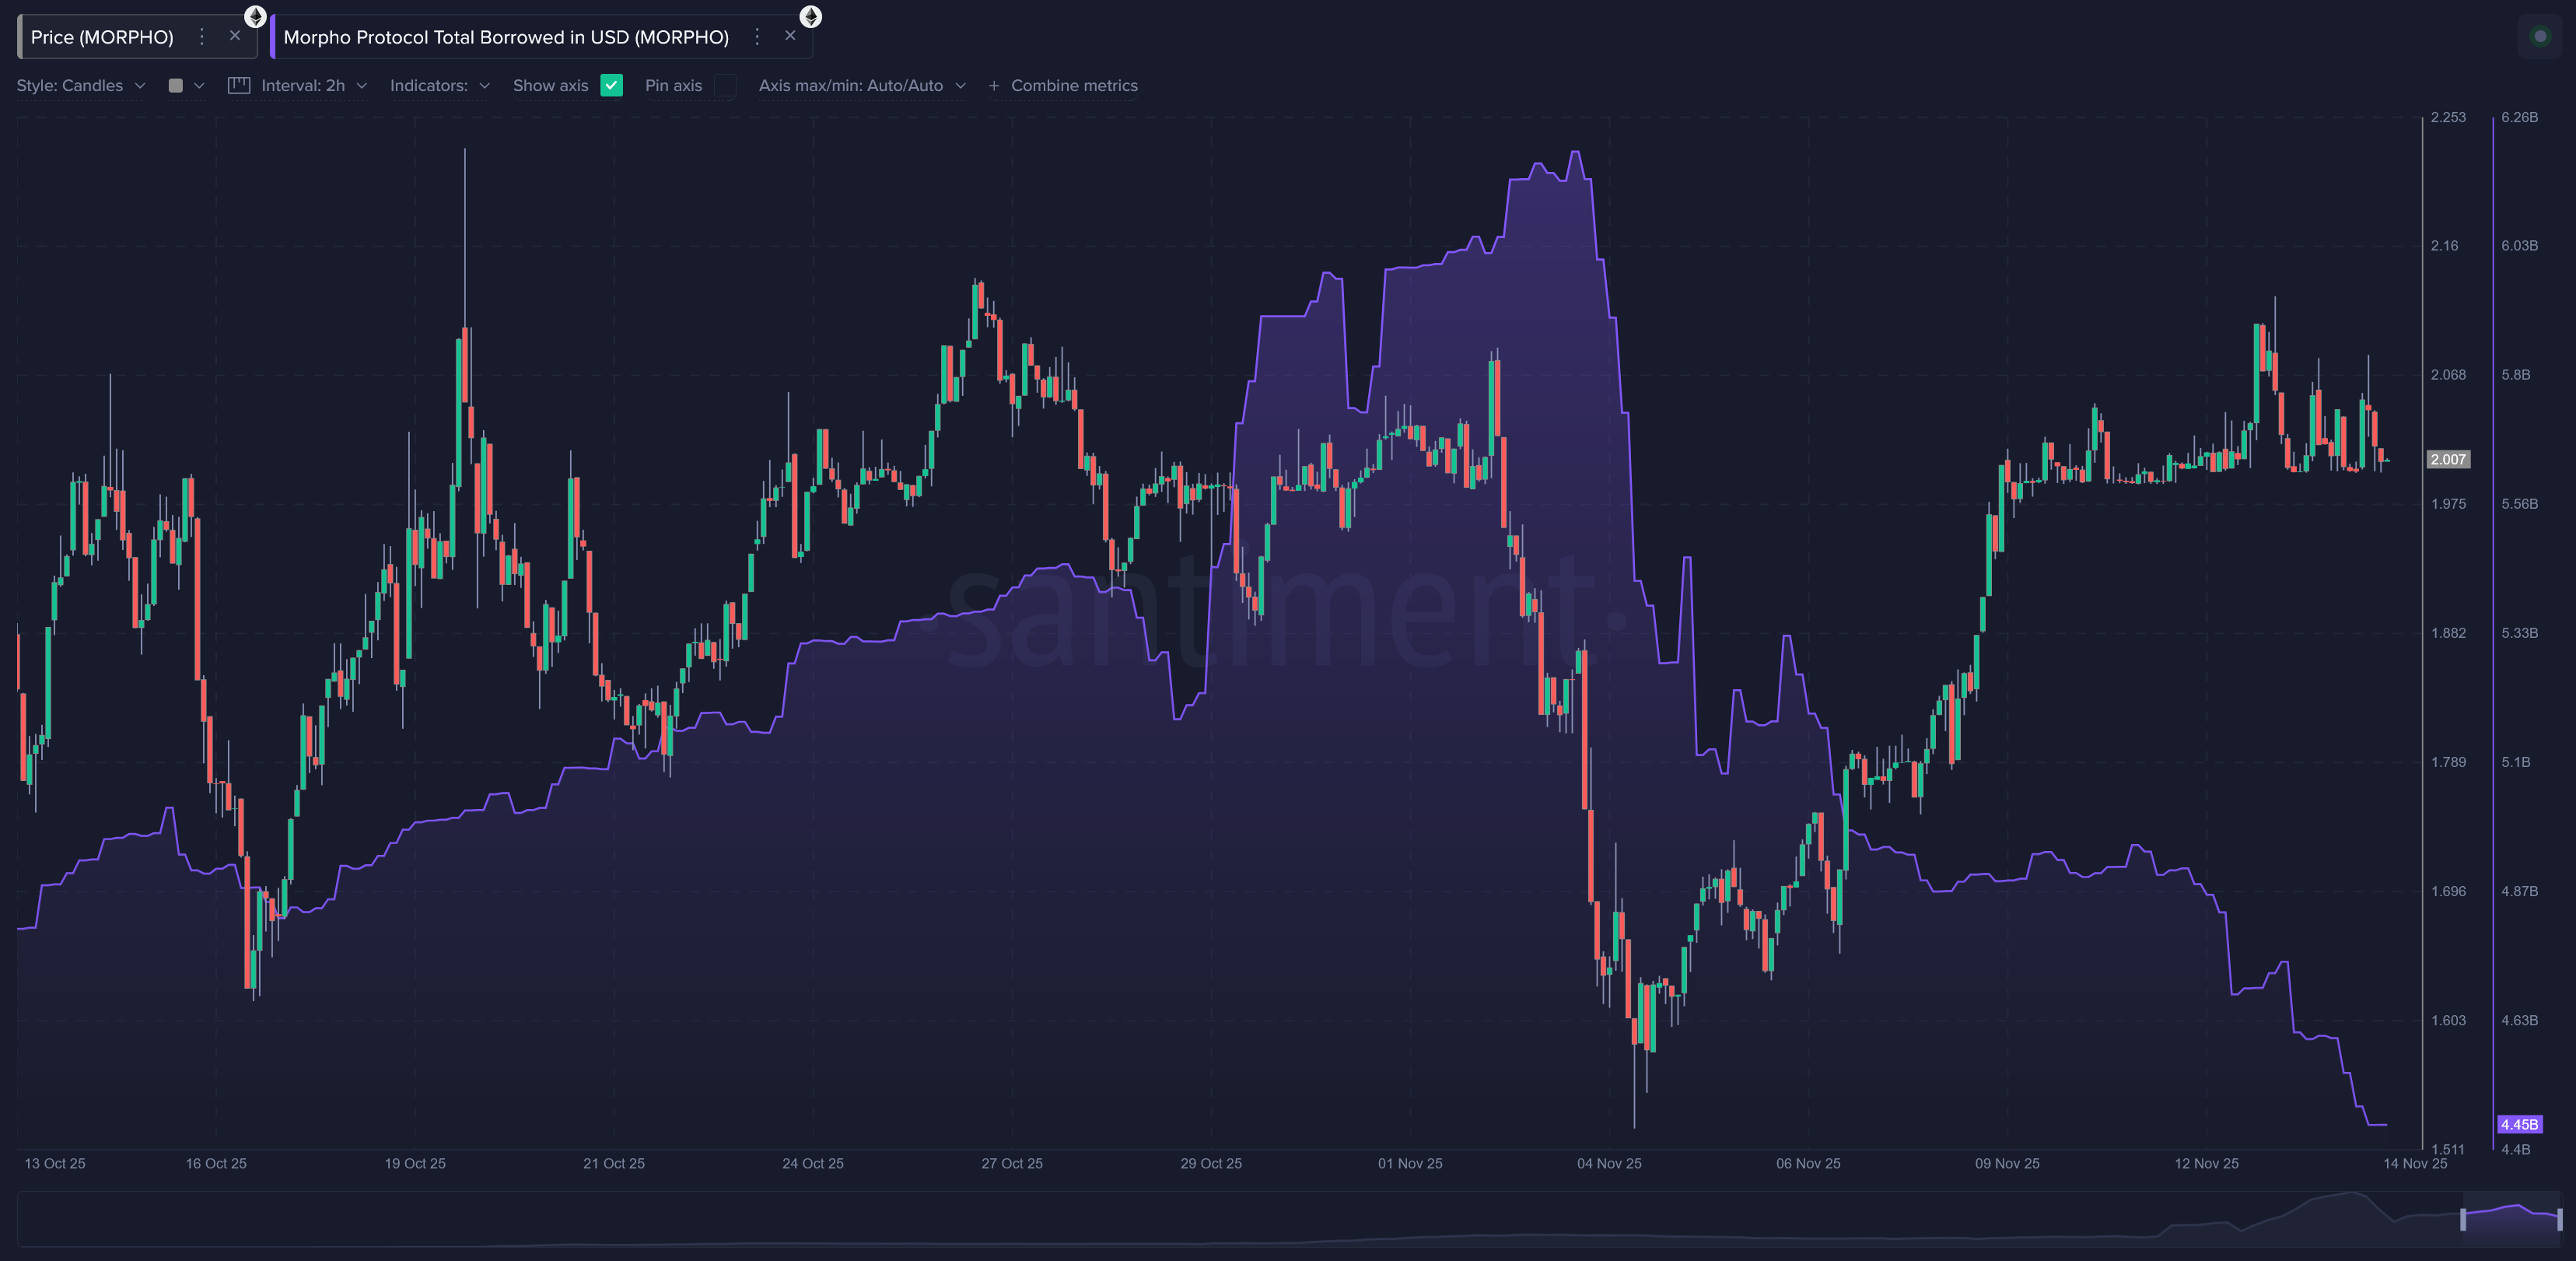
Morpho Protocol Total Borrowed in USD
This shows the total amount that users have borrowed on Morpho, expressed in USD across all assets. It rises when users are willing to take on leverage or borrow stablecoins to deploy elsewhere. A growing borrowed amount may indicate bullish risk-taking or strong demand for liquidity. A falling amount can signal deleveraging, increased caution, or expensive interest rates. Traders often compare borrowing trends to price movement to understand risk appetite.
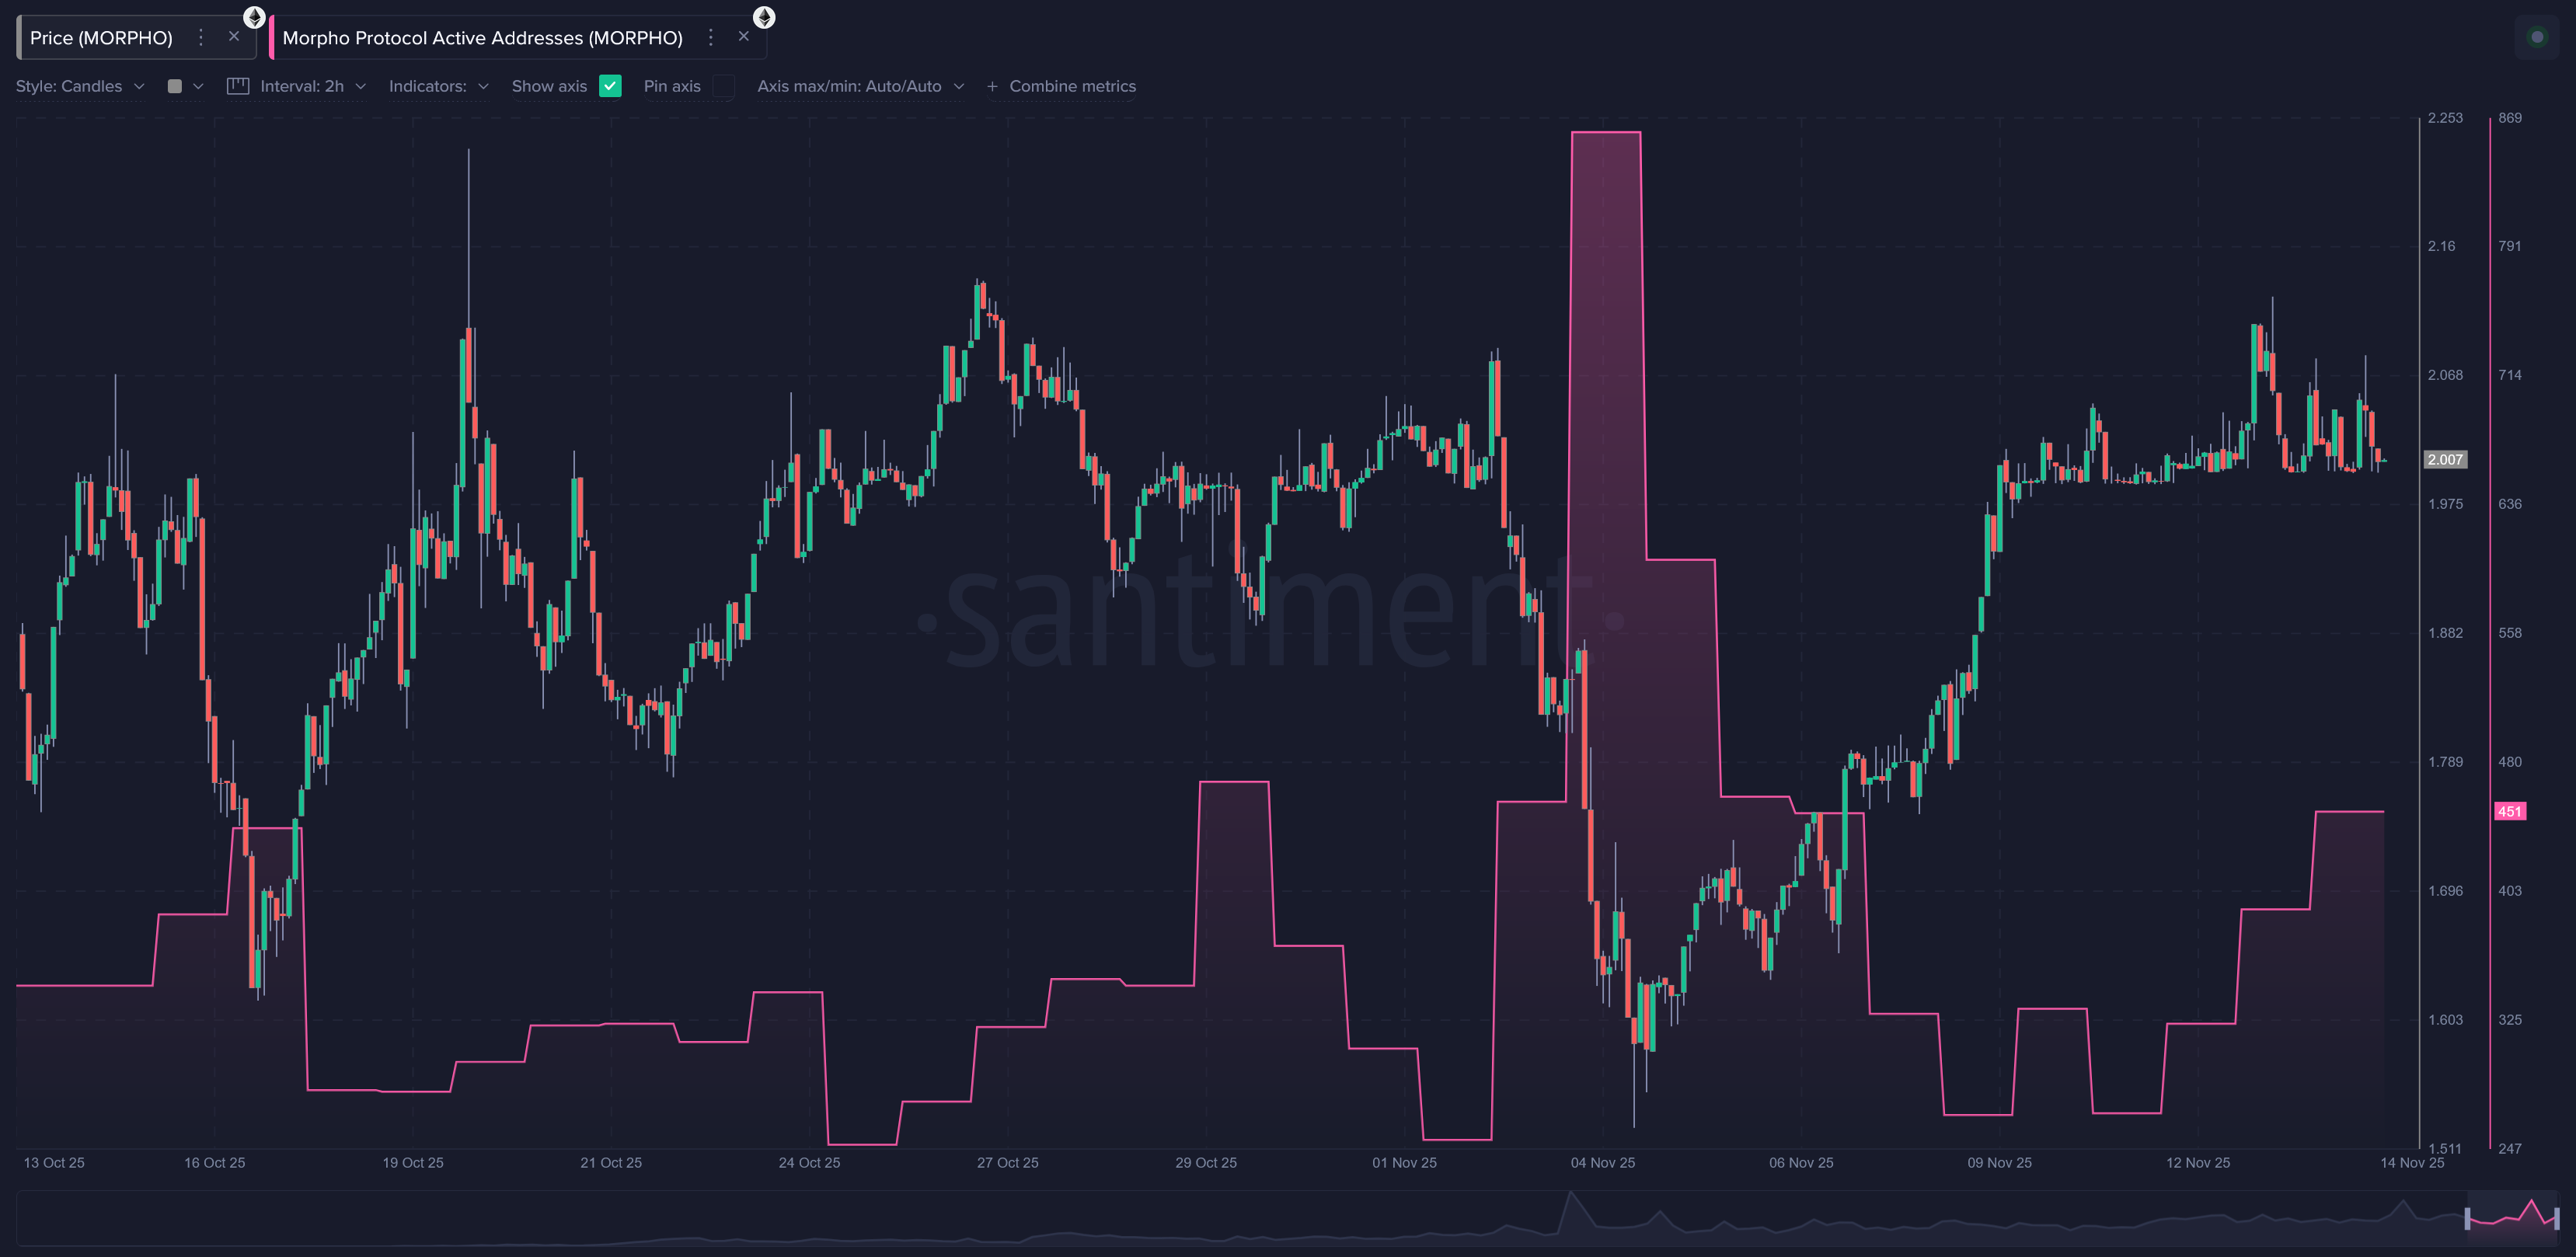
Morpho Protocol Active Addresses
This metric tracks the number of unique users interacting with the Morpho protocol each day. It includes borrowers, lenders, depositors, rebalancers, and any wallet executing transactions. Higher active addresses typically signal strong on-chain interest and user engagement. Sharp spikes often coincide with major events like liquidations, yield changes, or large price moves. Sustained low activity may reflect cooling interest or reduced protocol usage.
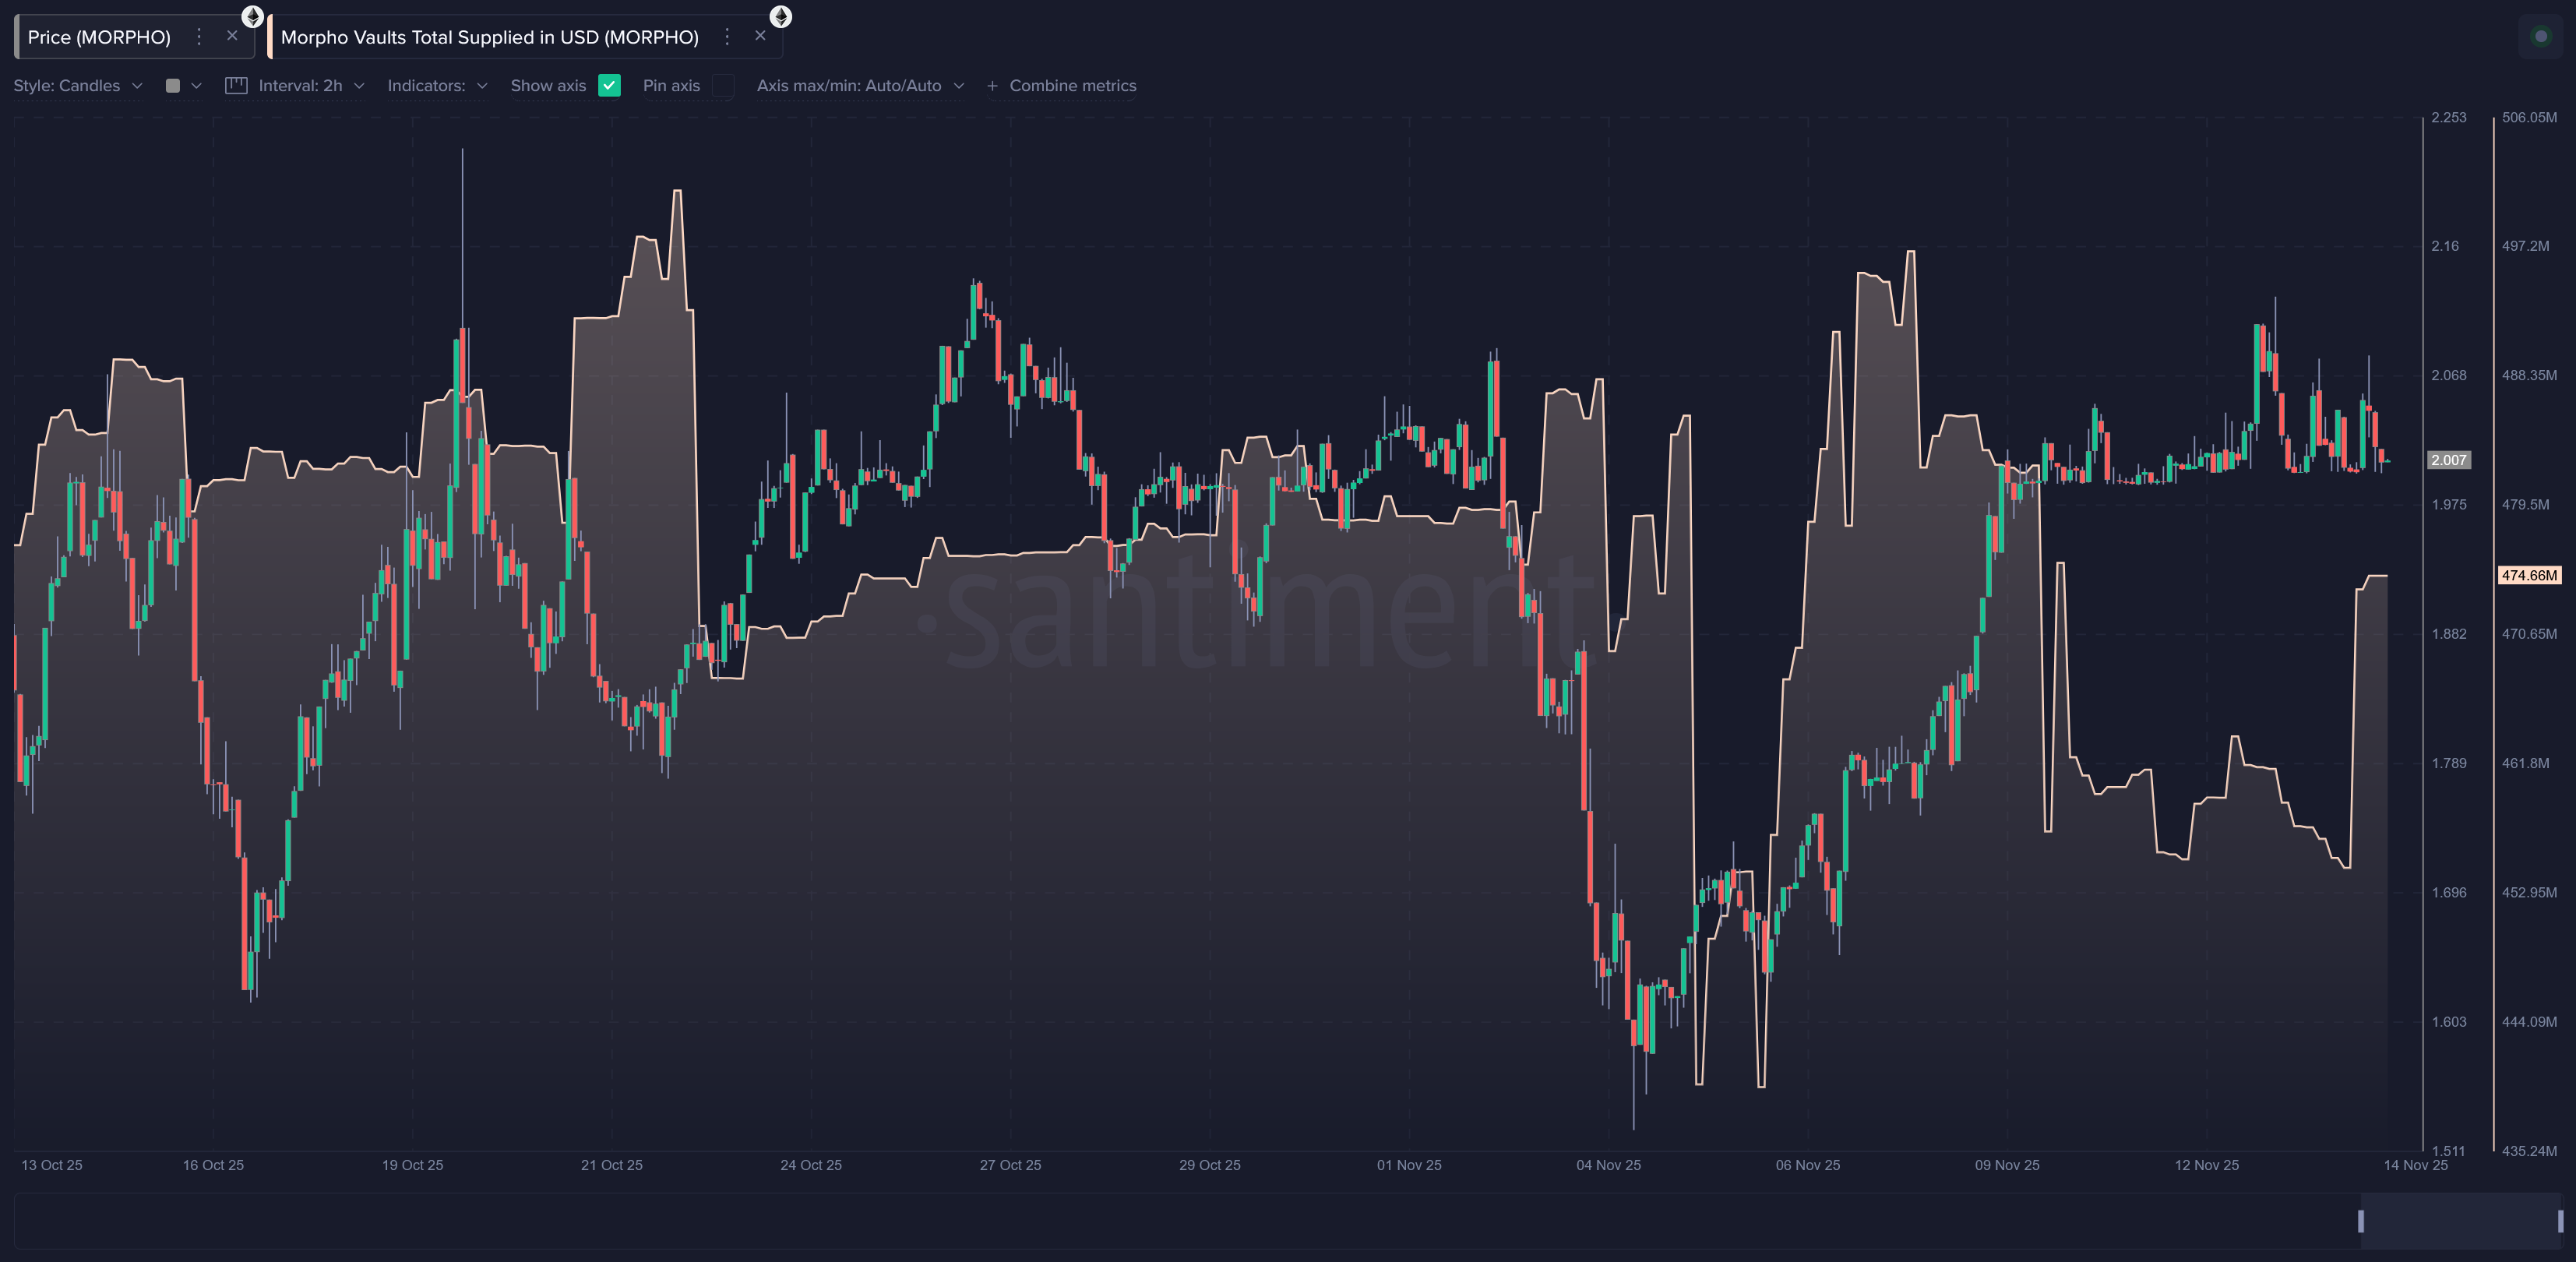
Morpho Vaults Total Supplied in USD
This metric measures the total value deposited into Morpho Vaults, converted to USD. It shows how much liquidity the Morpho Vault ecosystem has at any moment. Sudden increases usually indicate strong confidence from depositors or yield-seeking inflows. Drops may reflect withdrawals due to risk concerns, lower yield, or market volatility. It helps traders understand whether the vault system is attracting or losing capital.
Morpho Vaults APY
This metric shows the annual percentage yield (APY) that Morpho Vault depositors currently earn. It reflects how much interest a user would receive over a year if the present yield stayed constant. APY is influenced by borrowing demand, market interest rates, and vault utilization. Rising APY often signals increased demand for borrowing or temporarily boosted rewards. Lower APY often reflects capital oversupply or reduced lending activity.

Together, these Morpho metrics give a clear and easy way to understand what is really happening inside the protocol. Instead of guessing based on price alone, users can watch how money moves in and out, how much risk people are taking, and how active the community is at any moment. When you see things like a sudden jump in liquidations, a big wave of new borrowing, or a rise in vault APY, you can quickly spot shifts in behavior that might matter later. This template brings all of these signals into one place so anyone can track important changes as they happen.
For investors, traders, and analysts, these insights are extremely useful. The metrics help show when people feel confident, when they are becoming cautious, and when they are taking on more or less leverage. Long-term holders can use the data to see if Morpho is growing in a steady and healthy way, while short-term traders can watch for moments of high opportunity or increased risk. By combining protocol data with real user activity, Sanbase gives you a smarter way to understand Morpho without relying on guesses or hype.