Deep Dive: Has the Crowd Capitulated? We Explore!

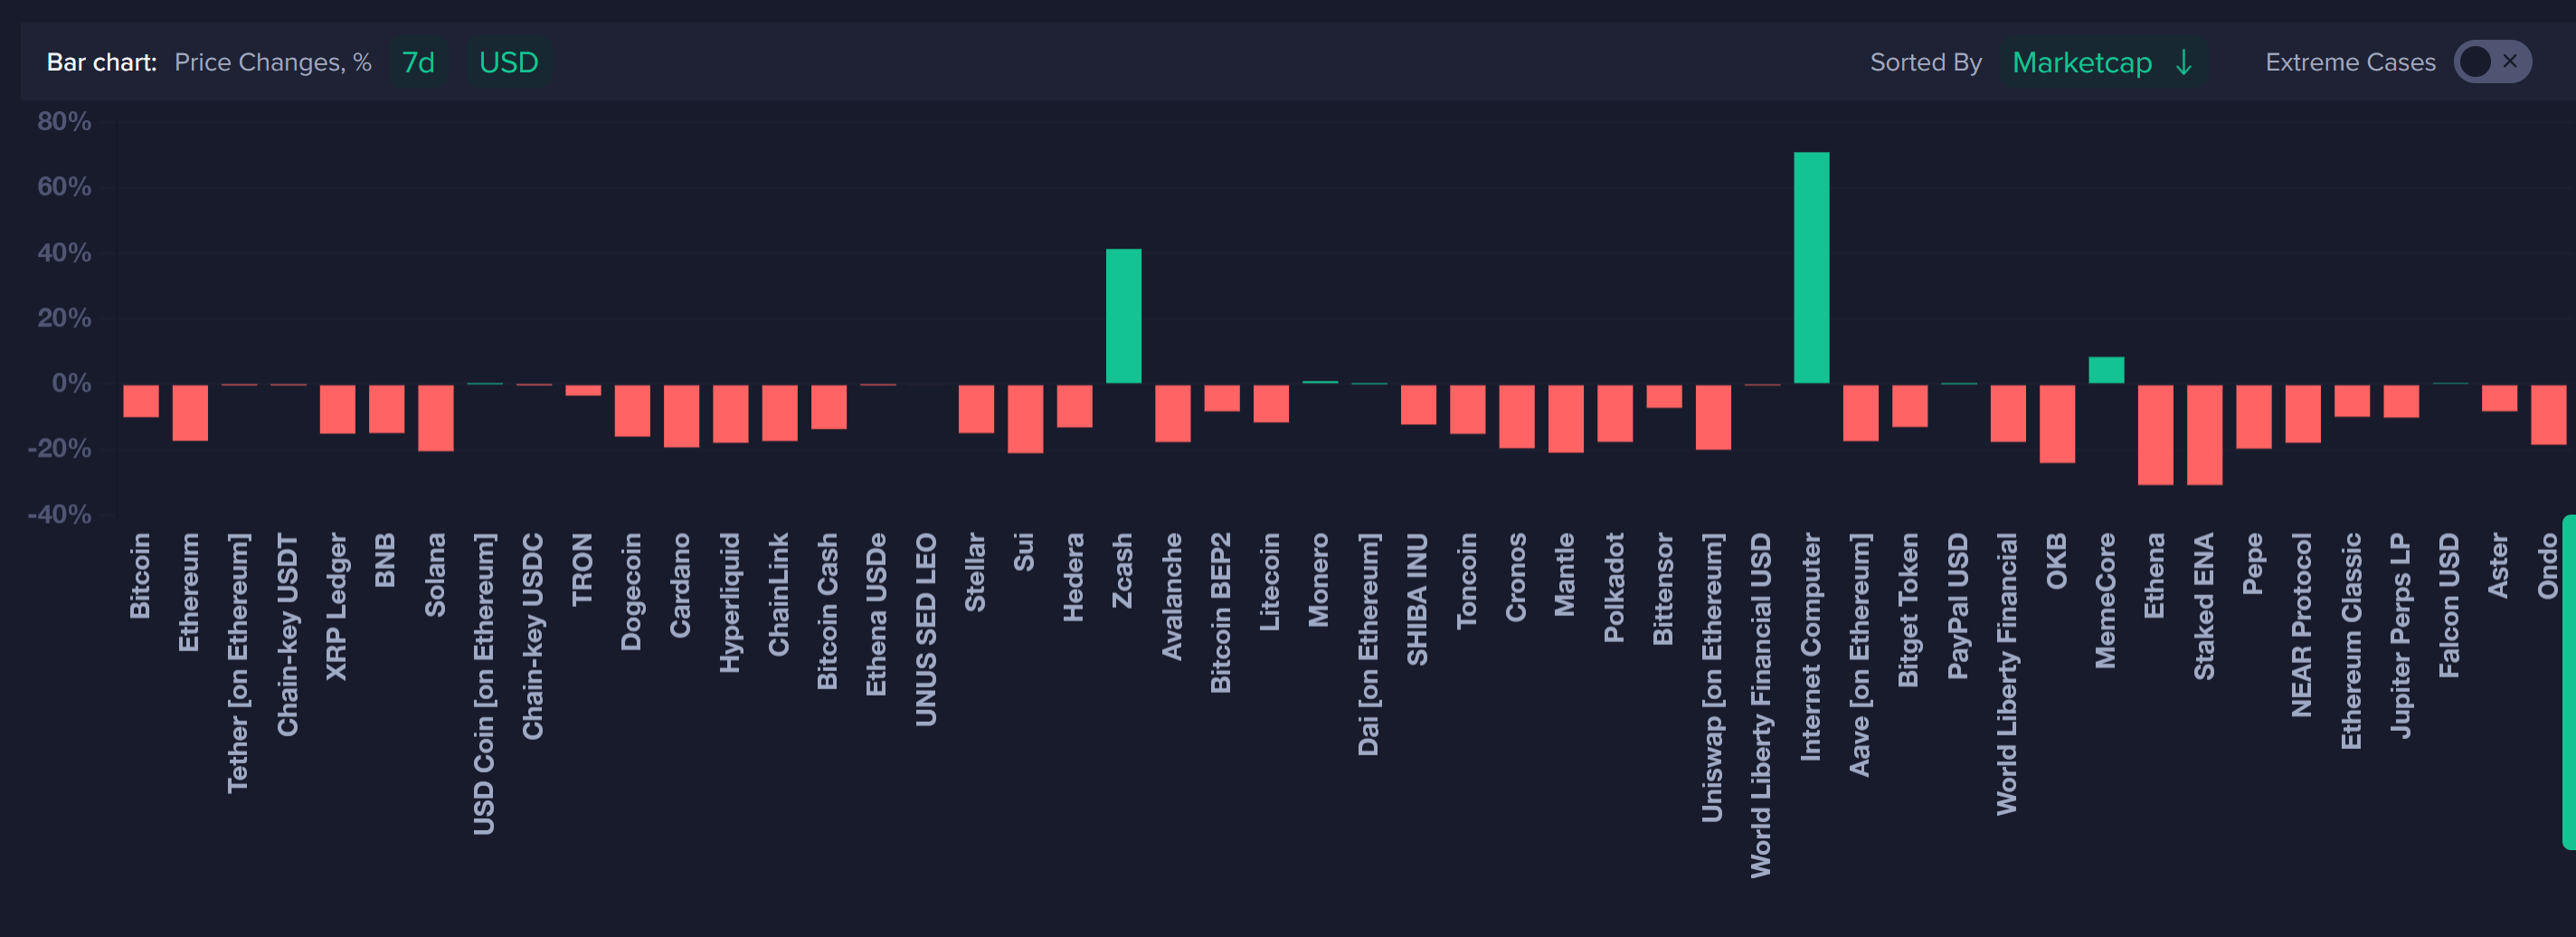
Bitcoin, Ethereum, and crypto markets did what much of the crowd thought was unthinkable Tuesday, plunging to levels not seen since June less than a month after Bitcoin's all-time high of ~$125.8K back on October 6th. Notably, BTC dropped all the way to $98.9K en route to falling below the psychological 6-figure support of $100K for the first time since June 22nd. Over the past week, BTC has now fallen over -10% and ETH over -17%.
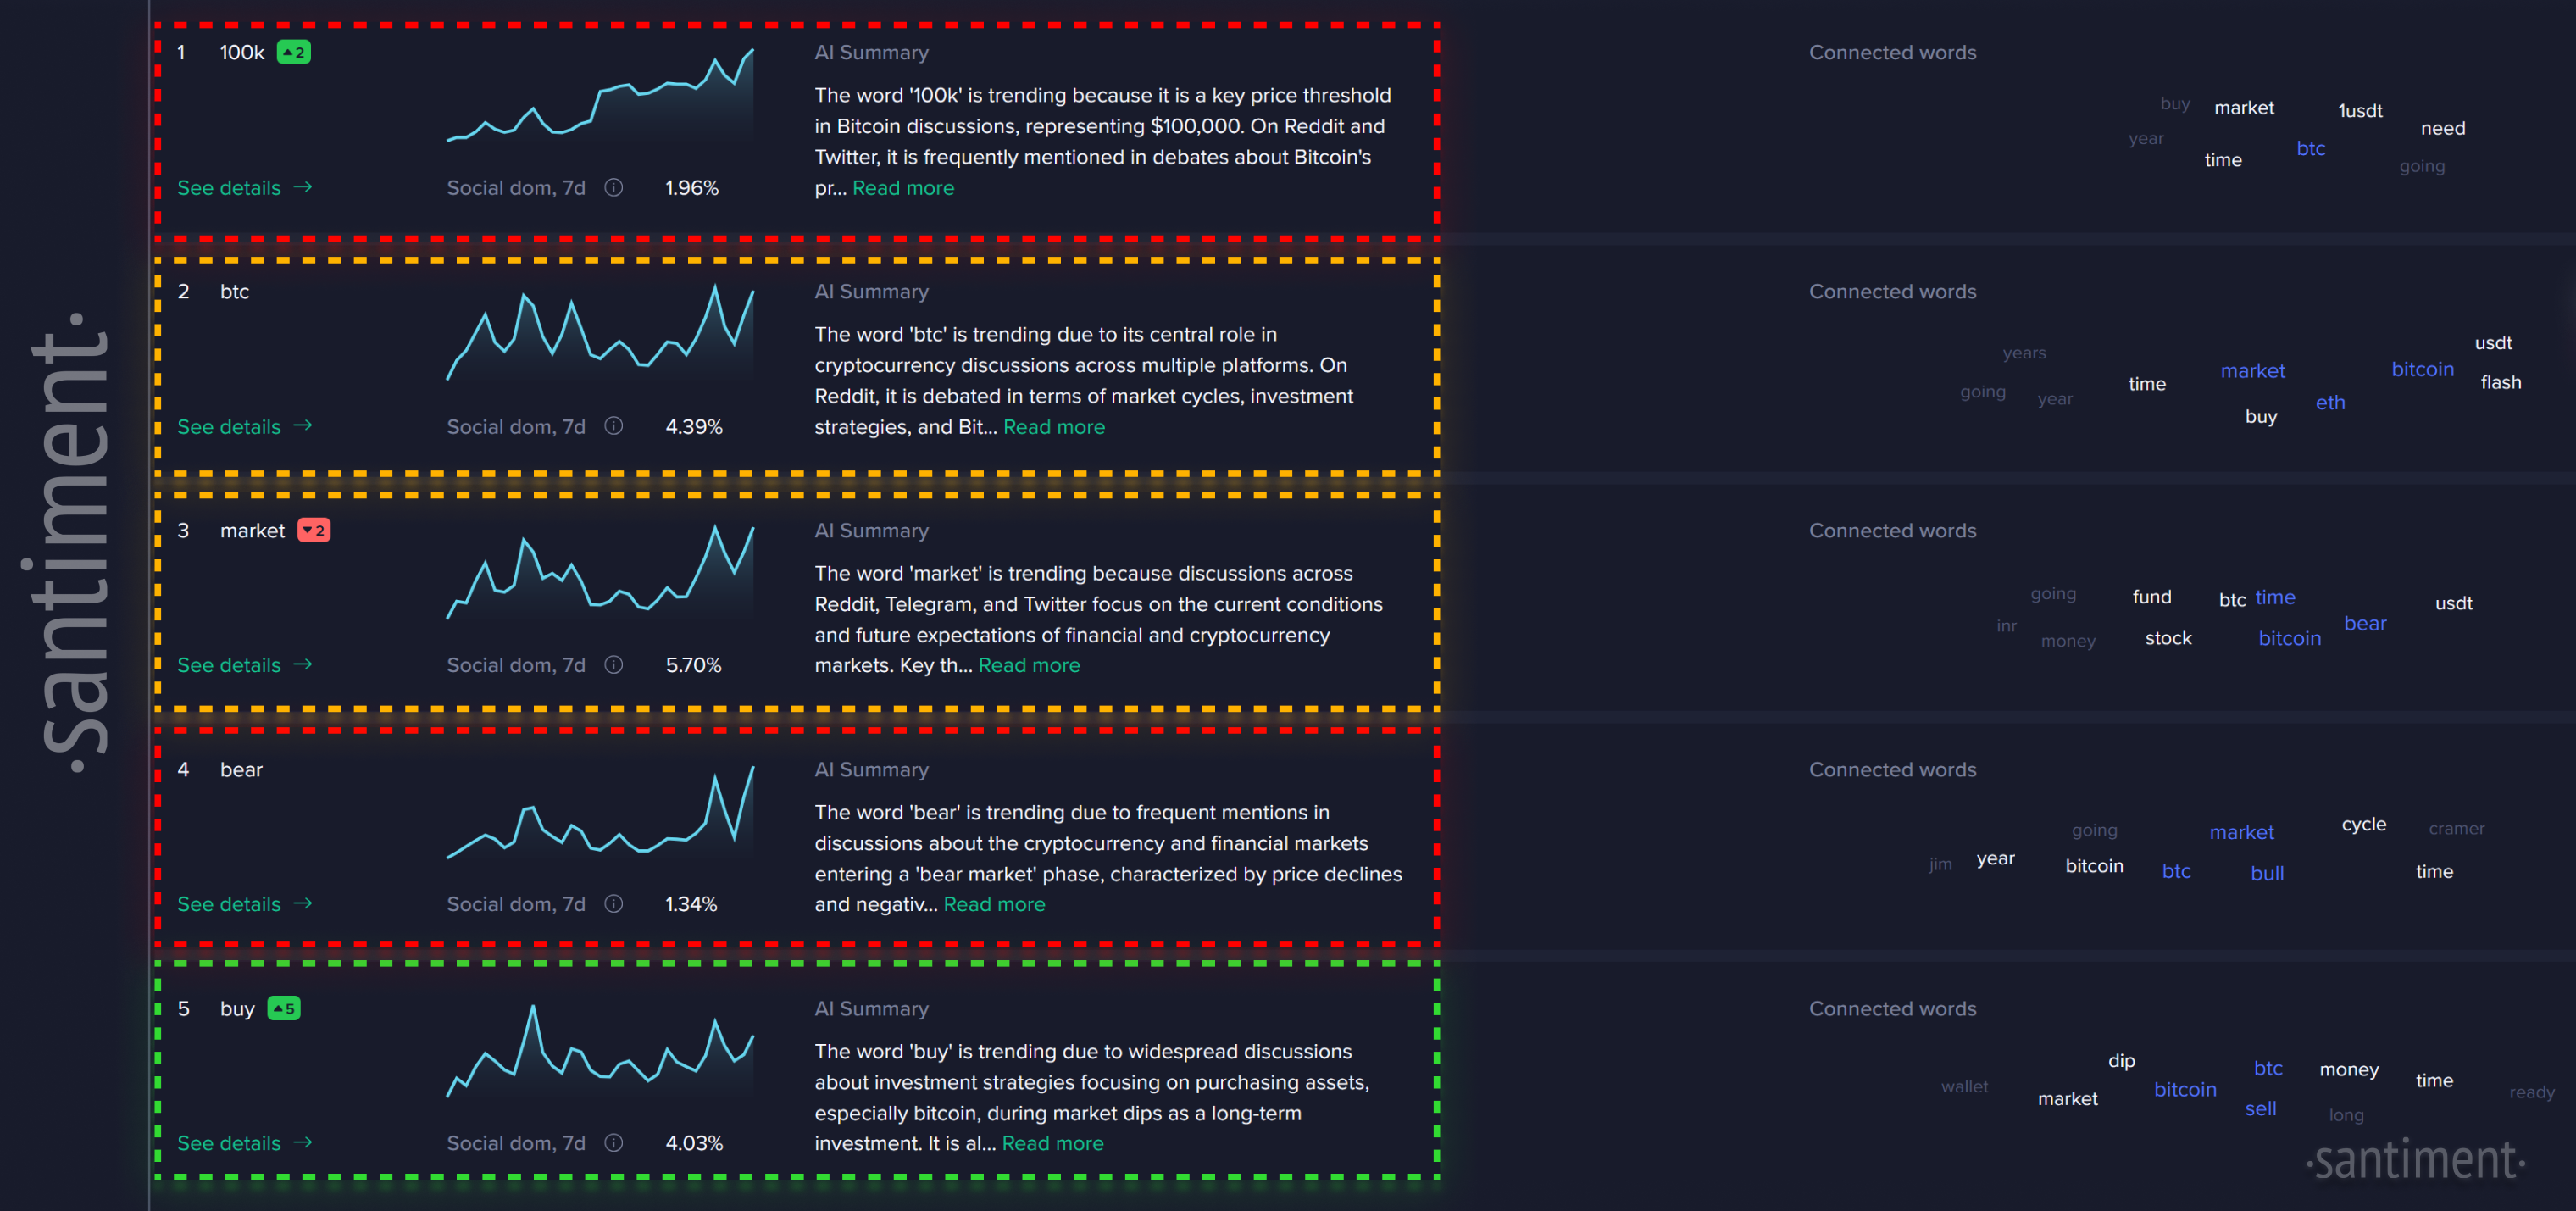
As we can see below on Santiment's Trending Words Dashboard, the top keywords being spammed across social media are all about price levels and the markets, as the crowd tries to figure out what to do next. During uncertain times after a major drop, it's normal to see plenty of mixed opinions. "100K" is the top rising topic, followed by "btc". This signals that traders are looking at crypto's top market cap, as they should, as a major signal for the health of all of crypto moving forward. We've highlighted the bearish keywords in red, neutral in yellow, and bullish in green.
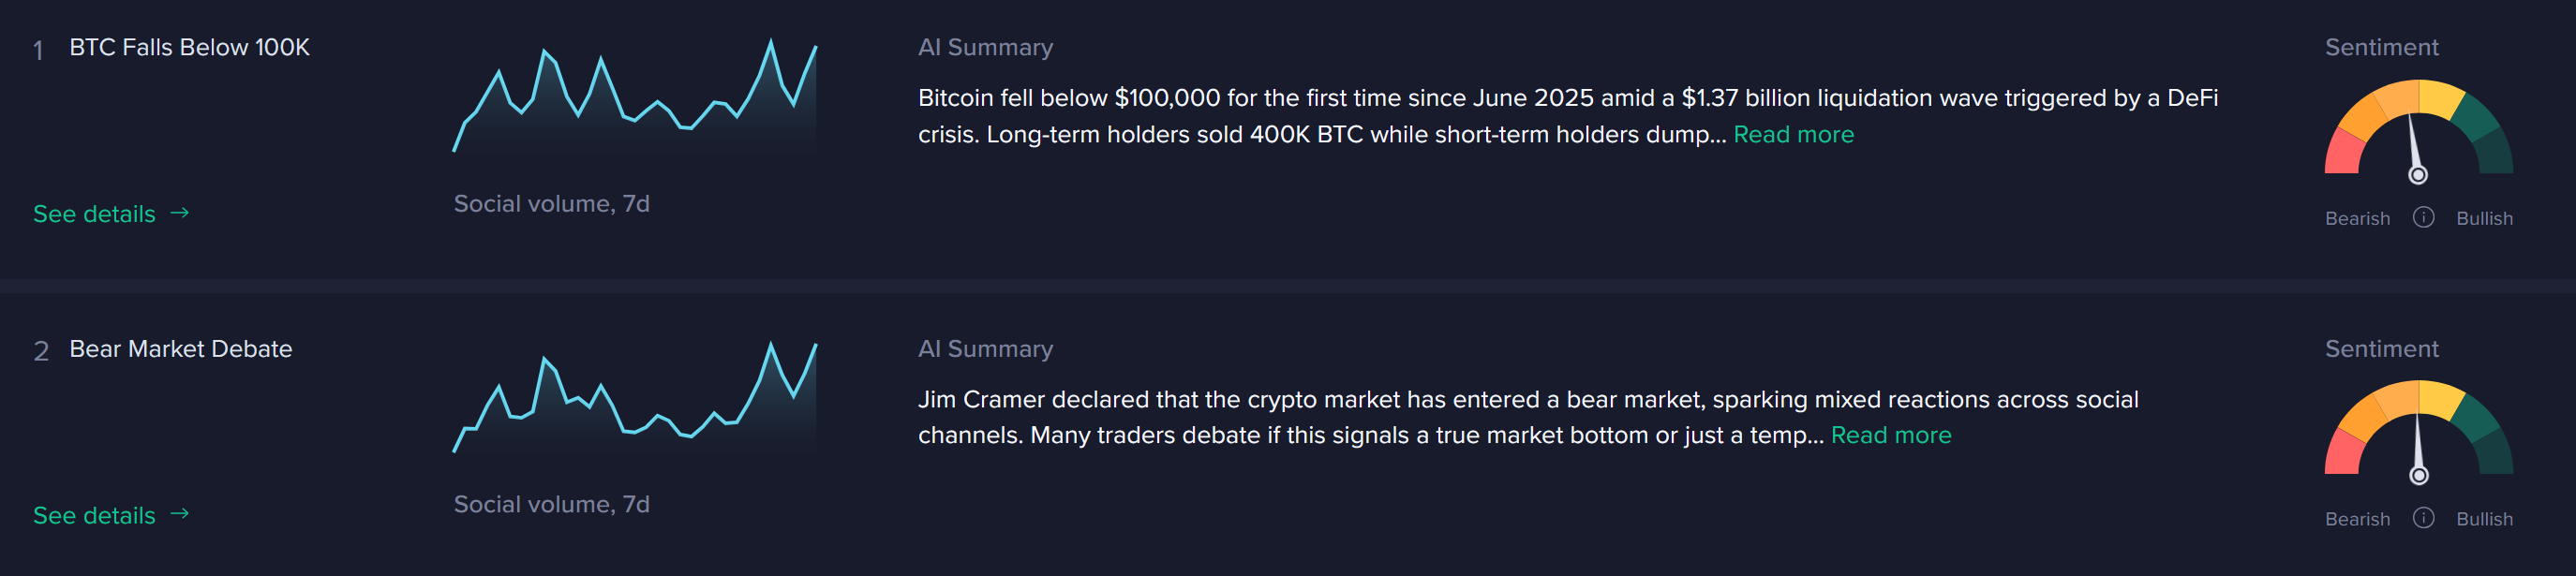
Similarly, we can see the Top Trending Stories Dashboard highlighting the top two bearish keywords (above) in further detail. As the top two stories our algorithm sees an influx of conversations on, Bitcoin's fall below $100K and the bear market debate signal obvious connections between the coin falling below this support level, and crypto entering a bear market.
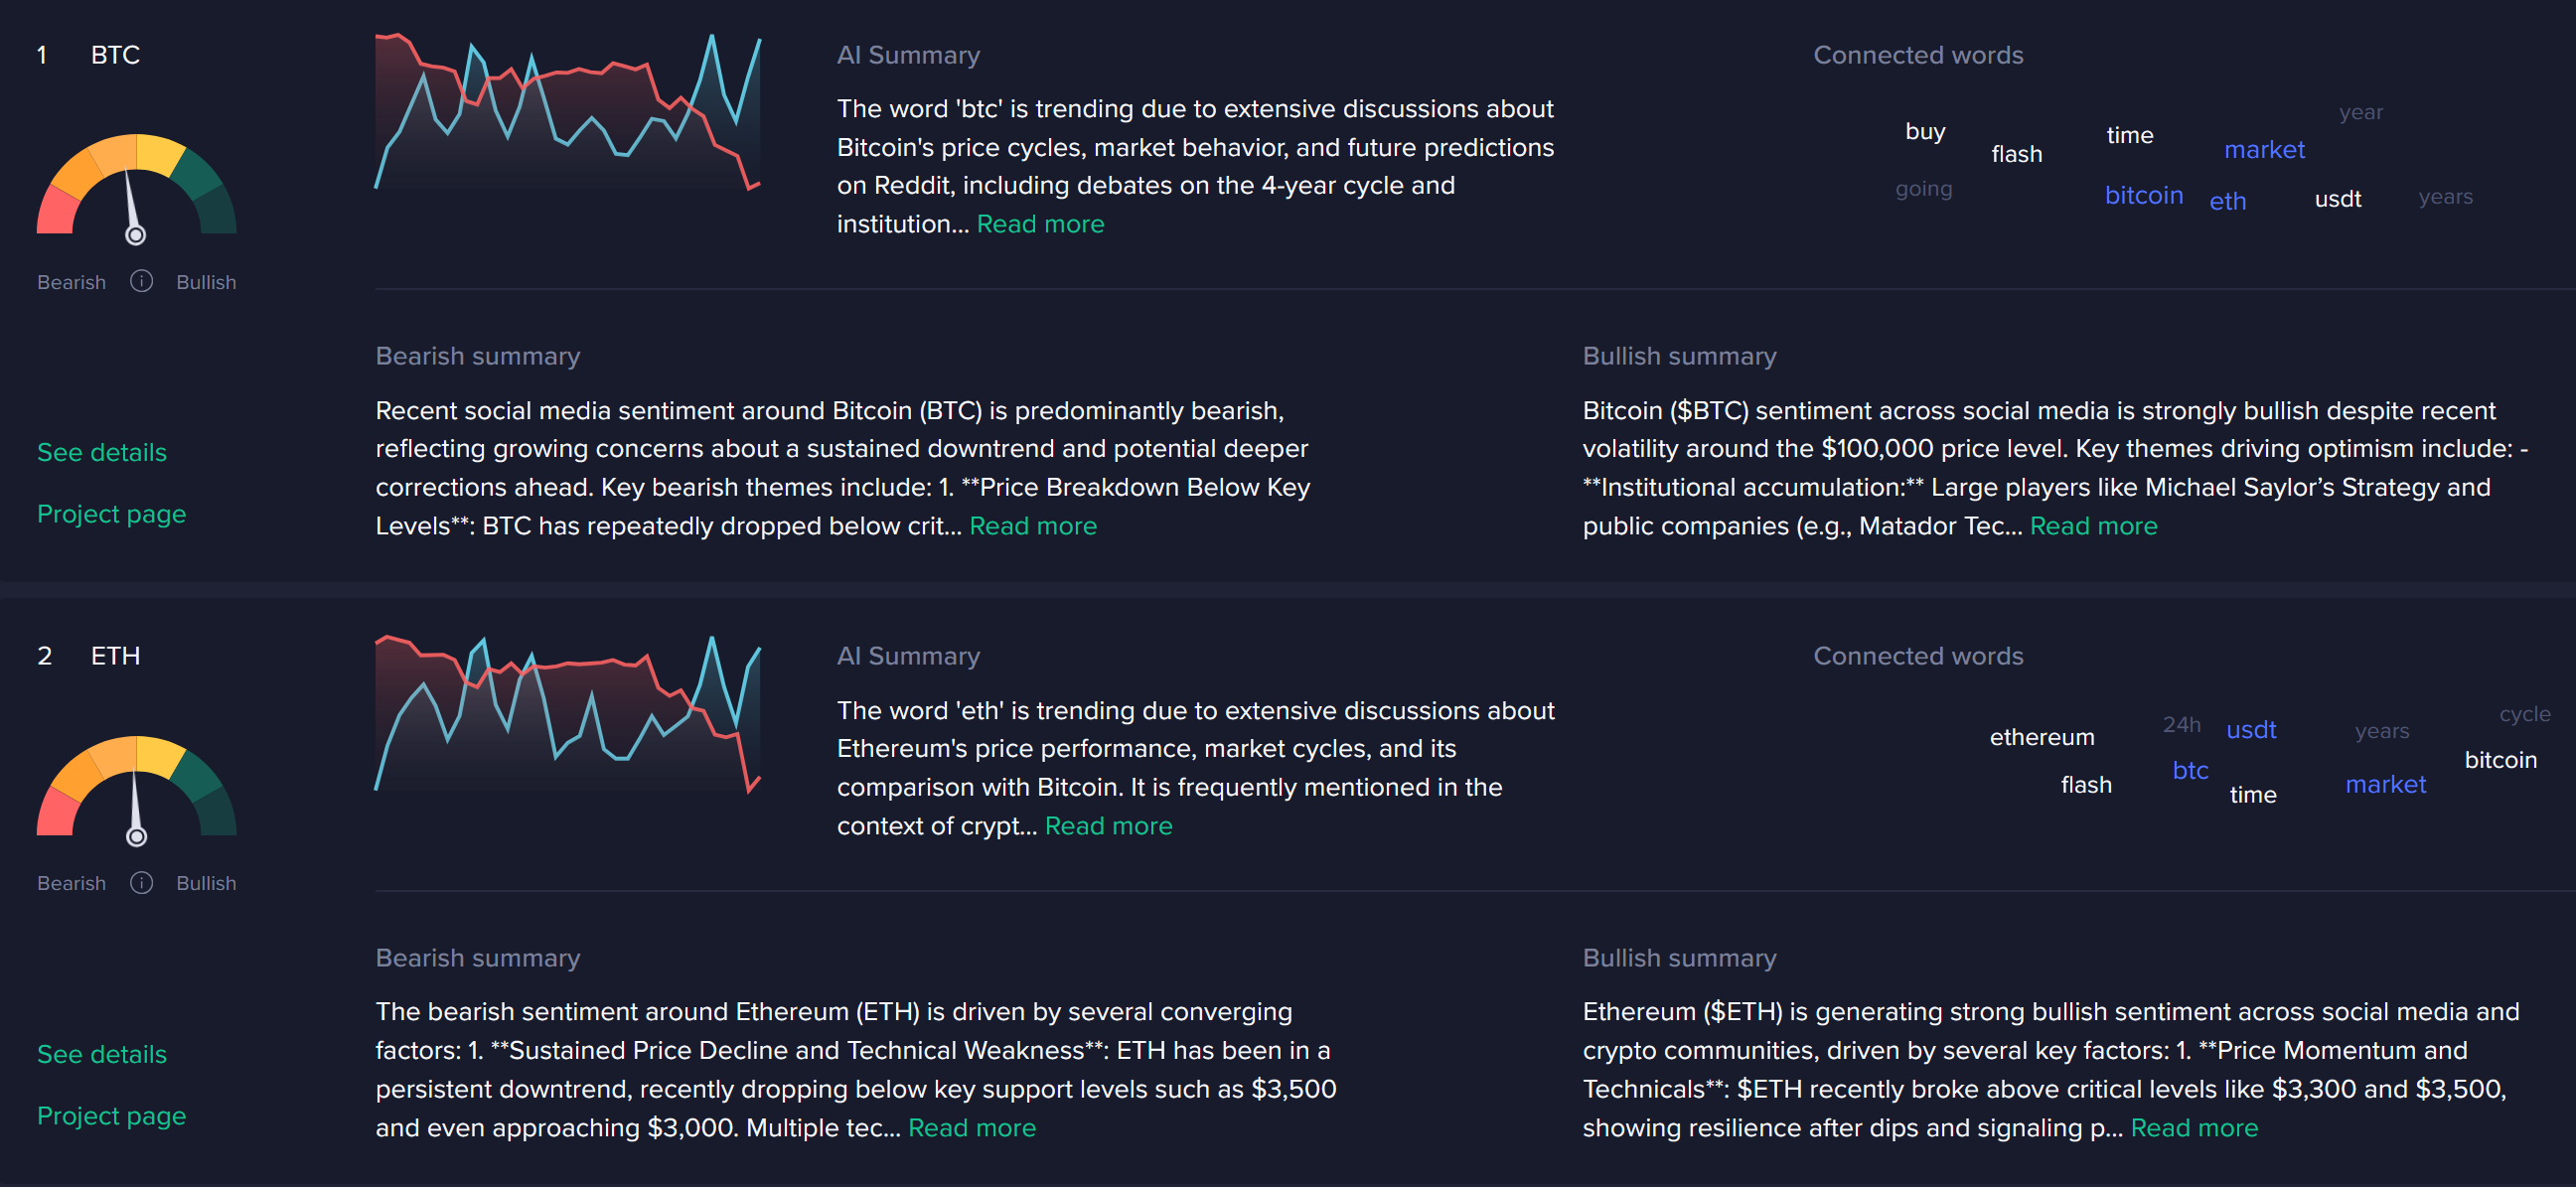
Naturally, when we see a crypto-wide market collapse, the Trending Coins Dashboard transitions from showing obscure coins that may be having airdrops or promos, and instead the crowd shifts their attention back to BTC and ETH. When meme coins or speculative assets are no longer the focus, it's a definitive sign that retail is expressing fear and concern.
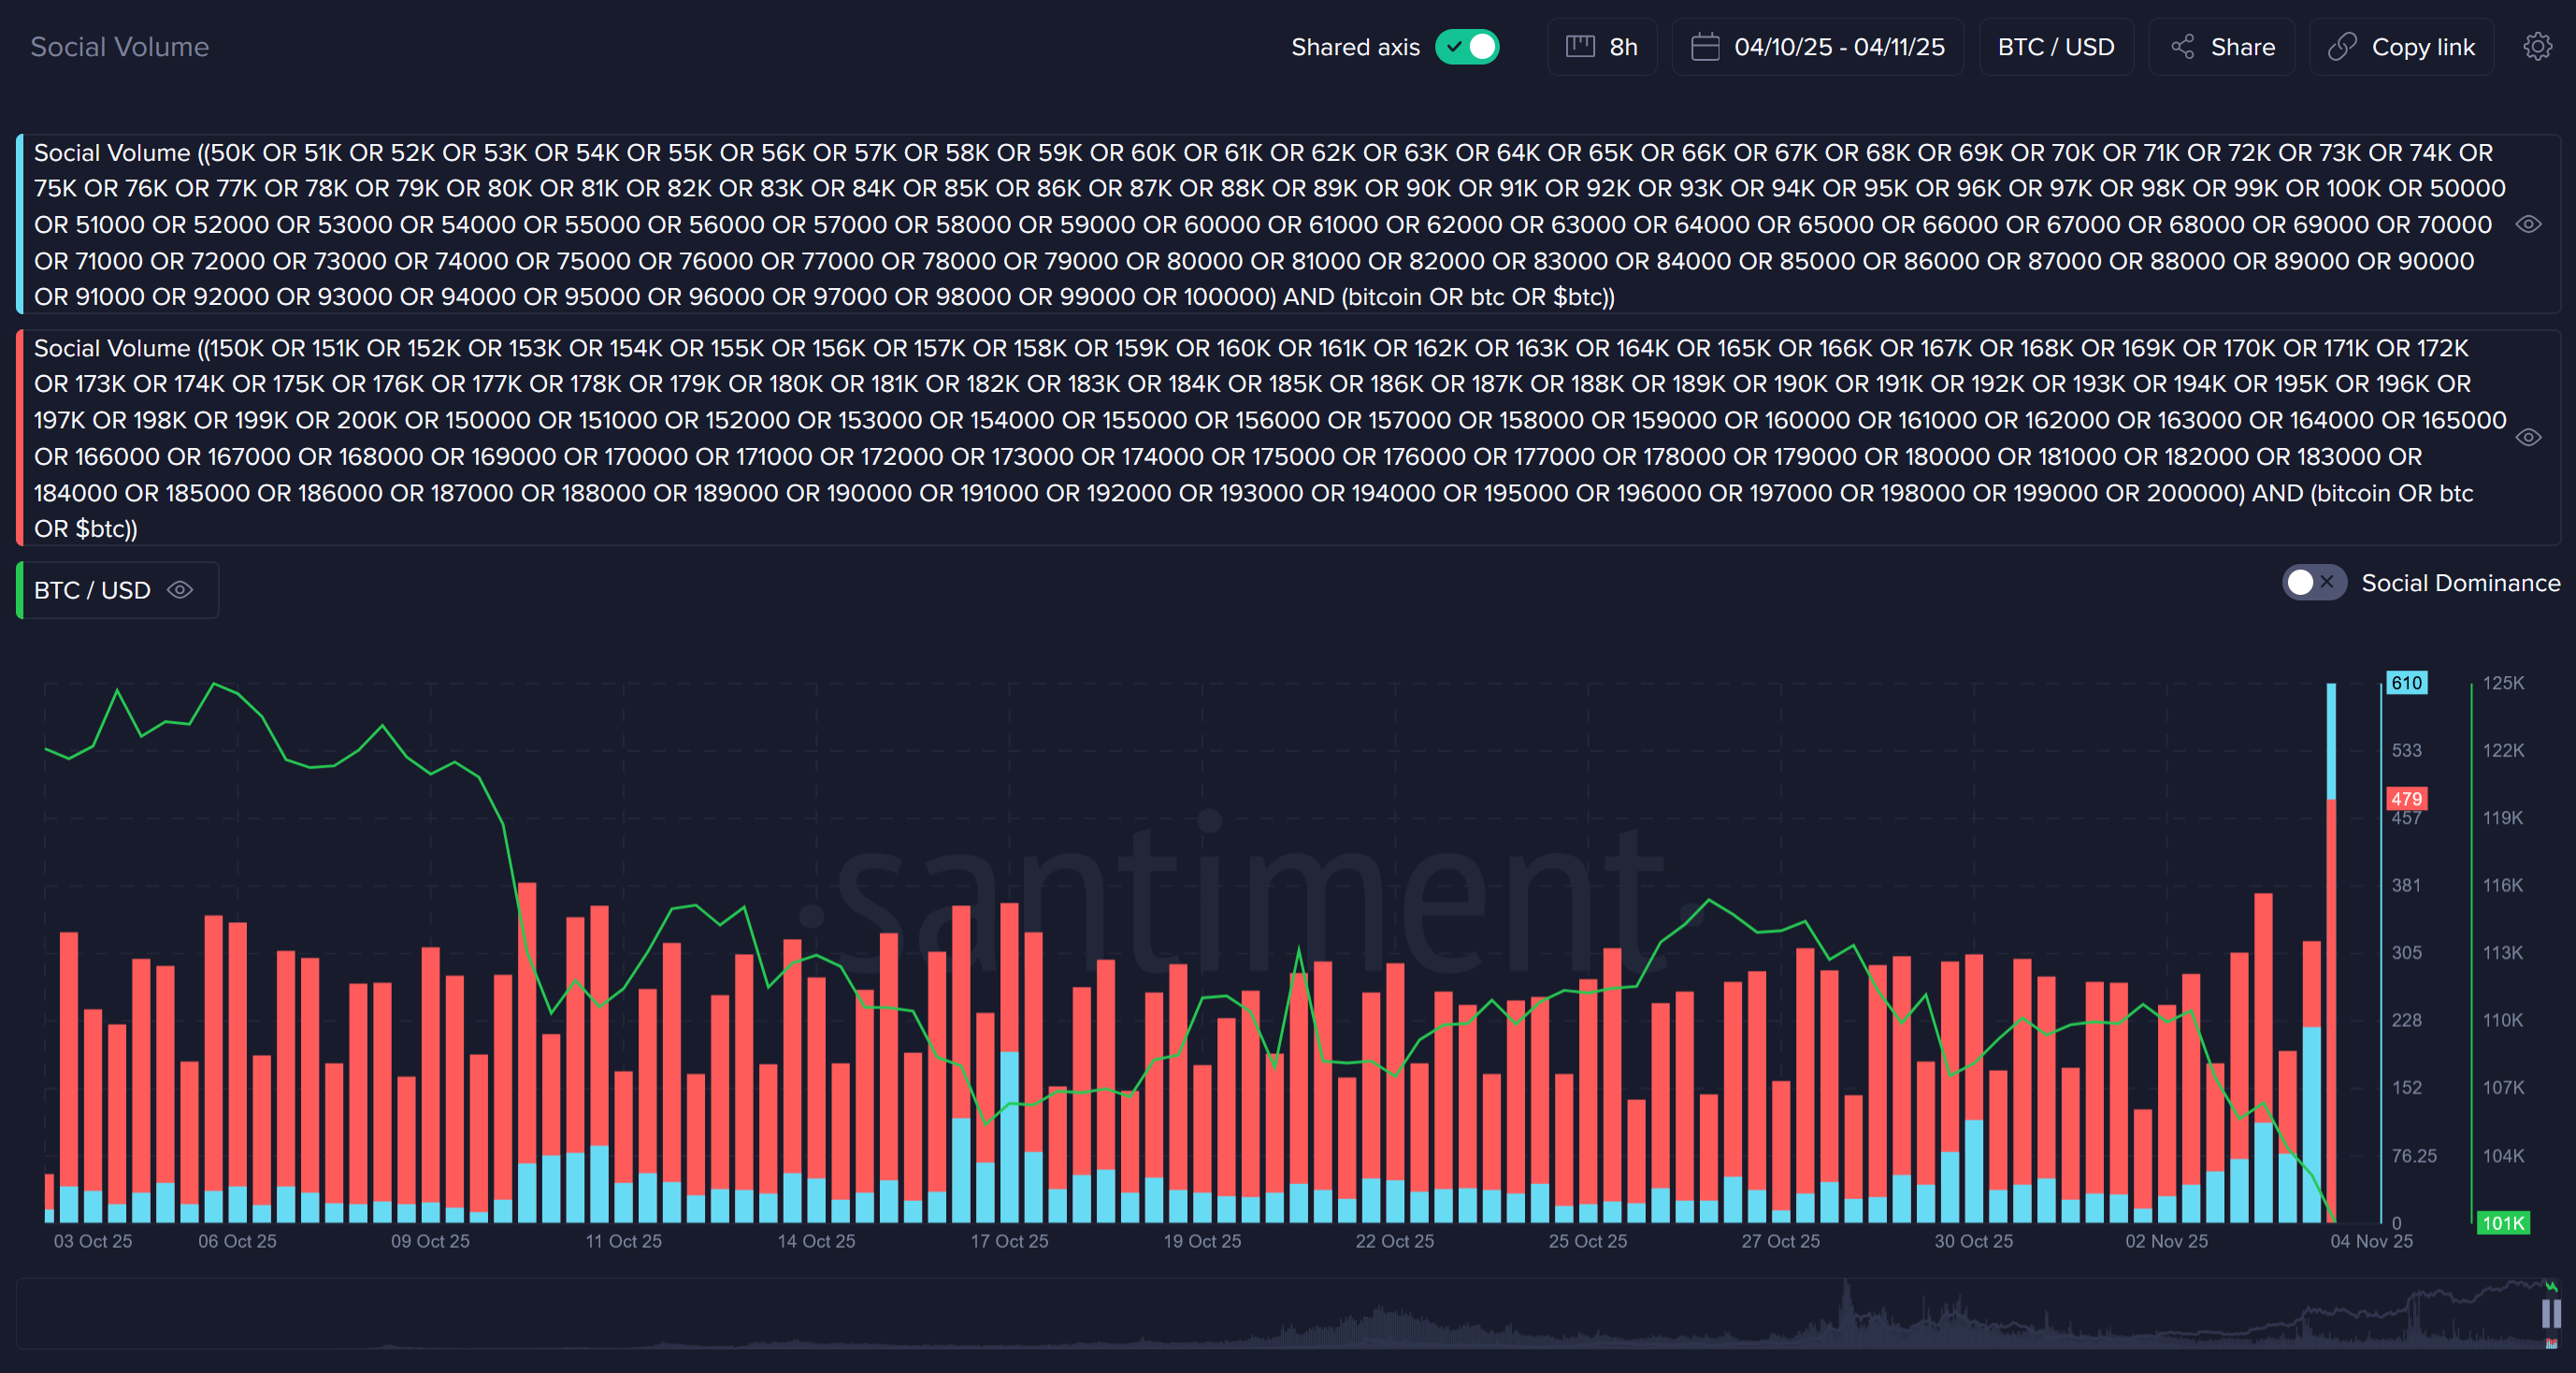
Now that Bitcoin has officially breached one of the zones on our highly popular $50K-$100K vs. $150K-$200K, some adjustments will need to be made in order to accurately measure when the crowd is getting greedy or fearful. Generally, when the crowd calls for prices well above BTC's price, it's a sign they are having too much FOMO and prices go down afterward. And when they call for price well below BTC's prices, it's a sign of FUD and prices go up afterward. We'll have some updates on the parameters of this chart soon, but take a look at what happened Tuesday in the blue "$50K-$100K" mentions once it was clear that $100K had been breached:
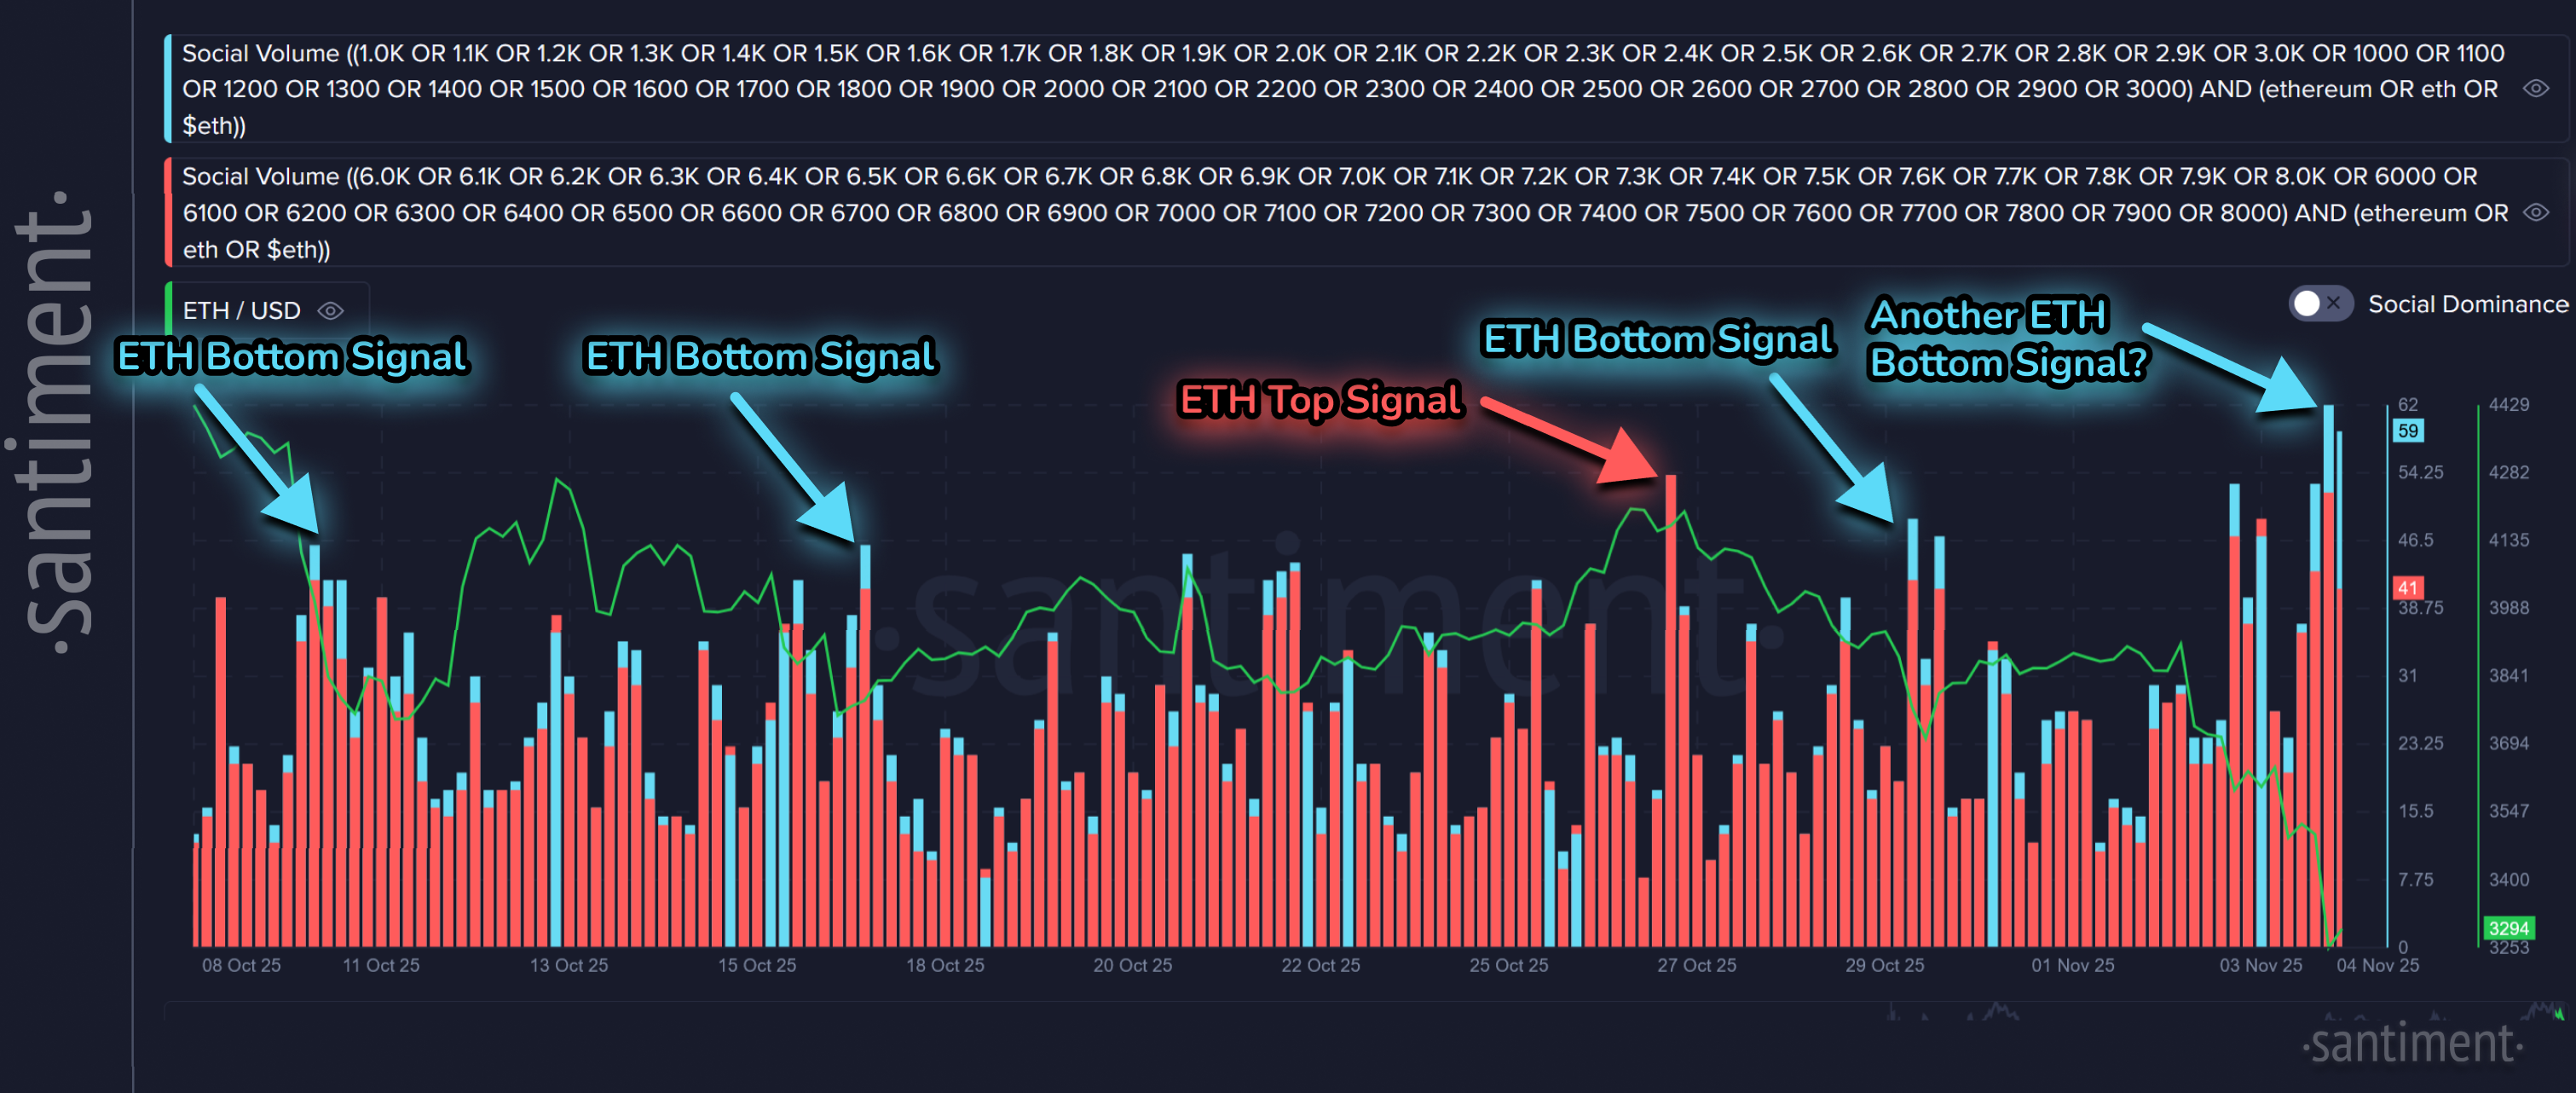
And not to be outdone, Ethereum's calls for sub-$3K have surged after falling to as low as ~$3,090 during Tuesday's dump. The signals for fear vs. greed on this chart have been fairly reliable for crypto's #2 market cap, with every strong red (FOMO) candle foreshadowing a downswing, and every blue (FUD) candle foreshadowing an upswing. We will see if it can come to fruition while traders appear to be predicting the worst for ETH.
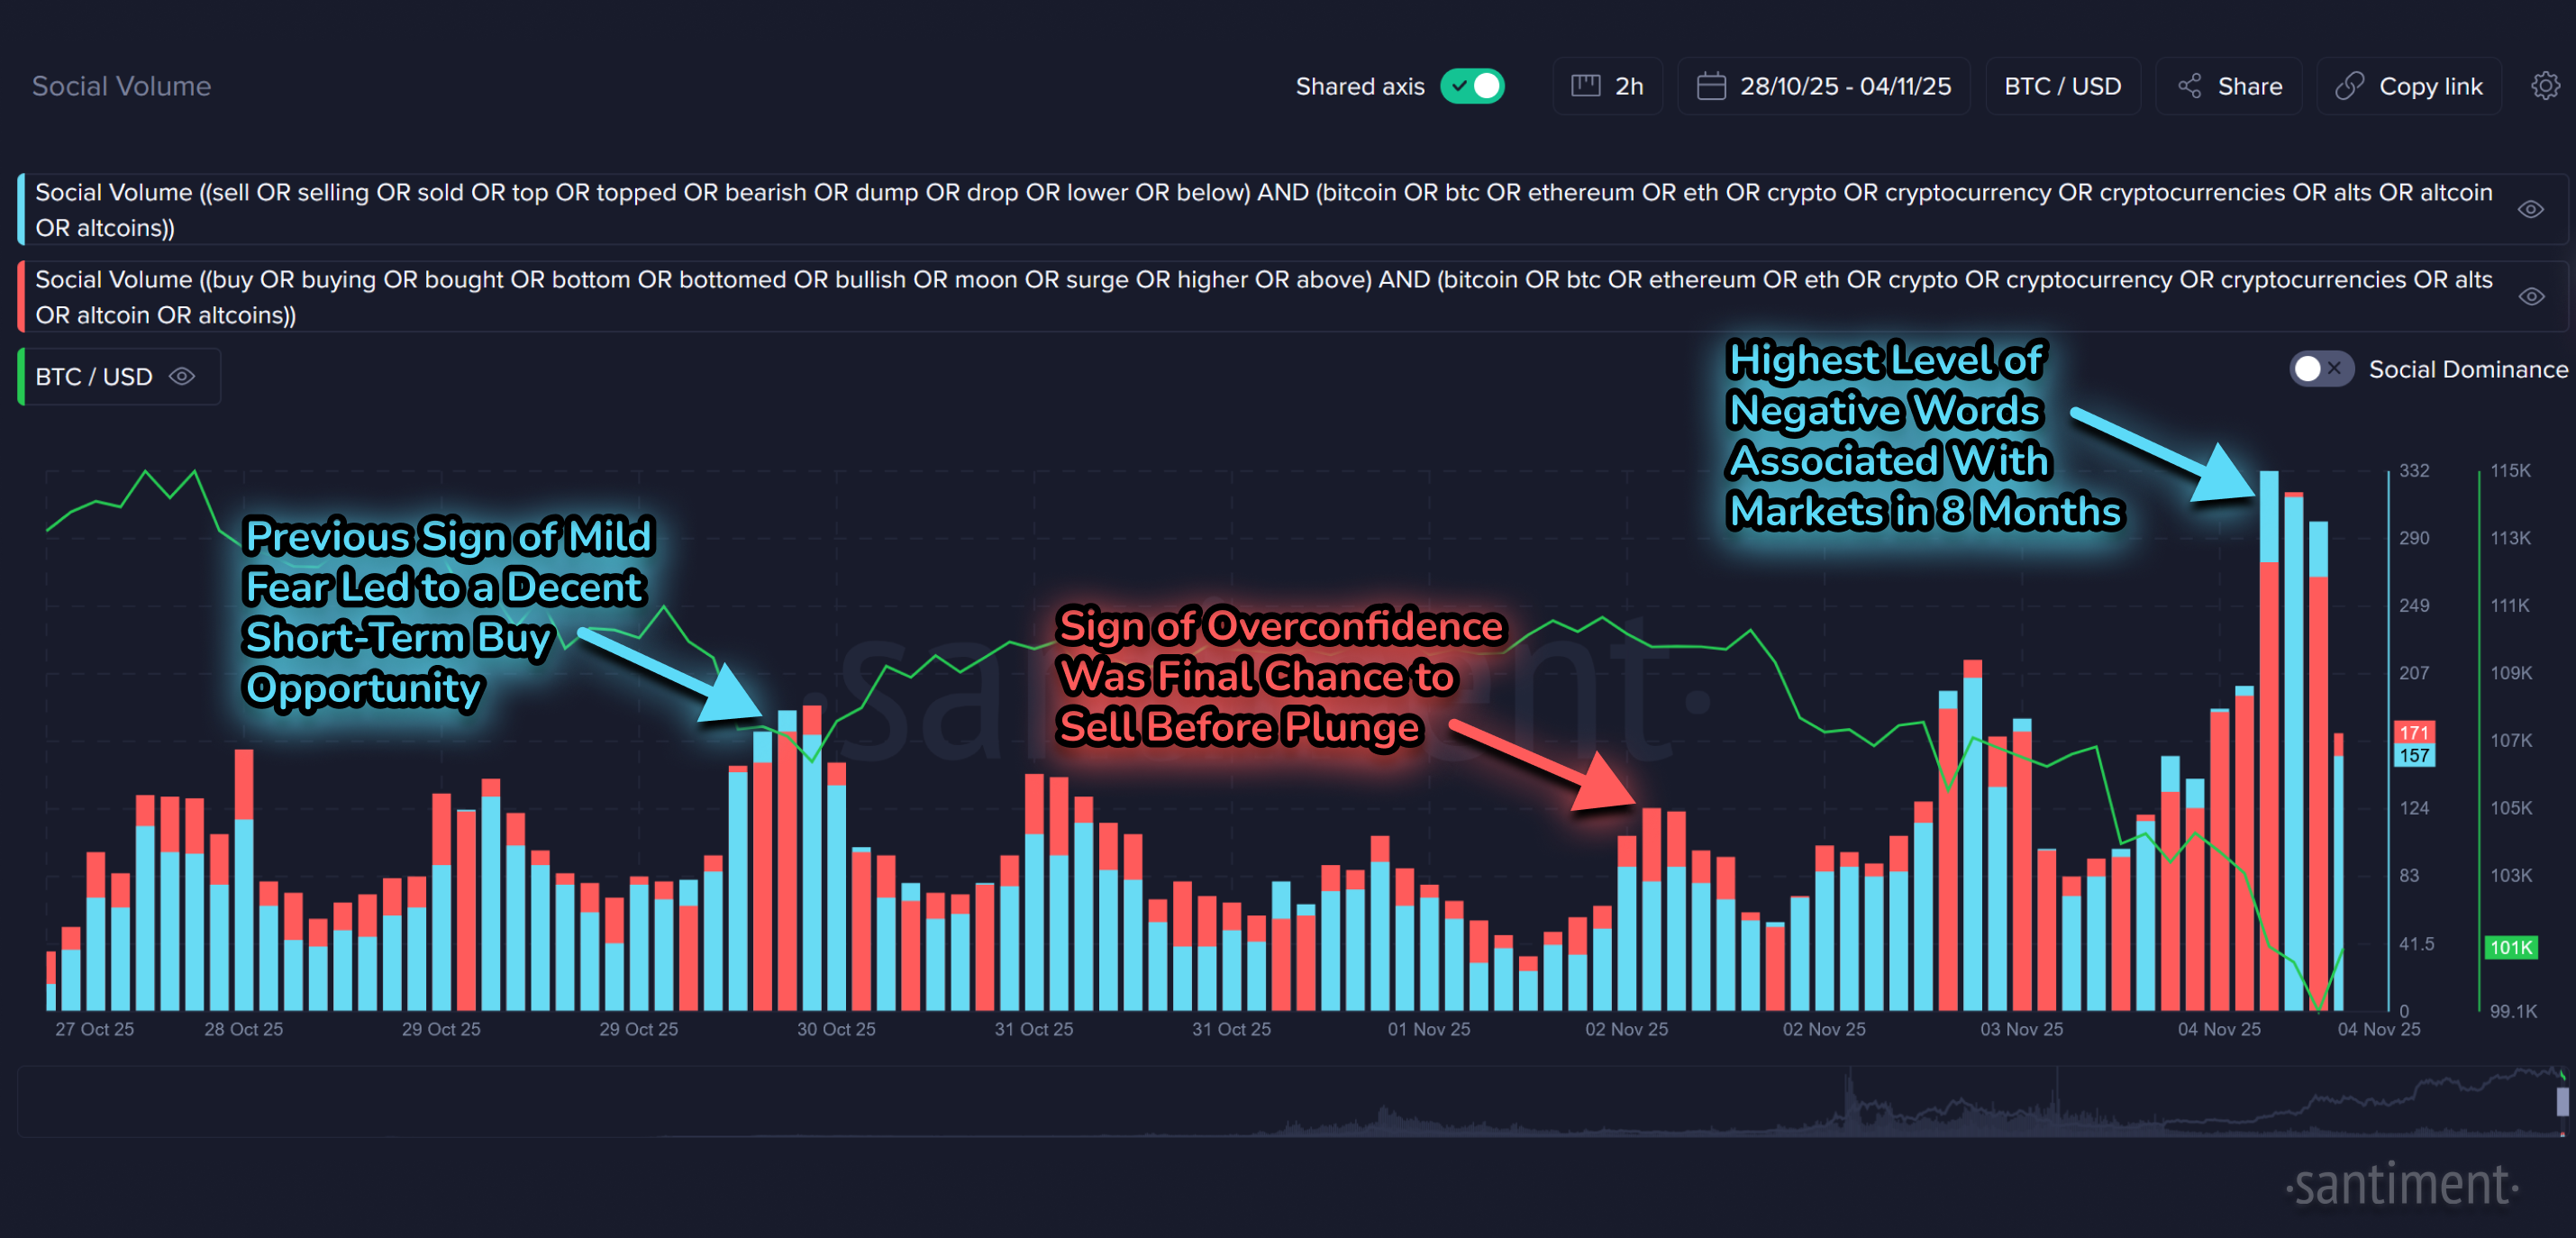
And we can also turn our attention to the overall level of positive words related to crypto (in red) and negative words related to crypto (in blue). As you might imagine, there has been a big increase in retail mentioning that they are "selling" or that the price is going "lower" as of late. This is typically a good sign, as we did get a brief 3-day relief rally at the end of October the last time we saw a high level of doom and gloom on this chart.
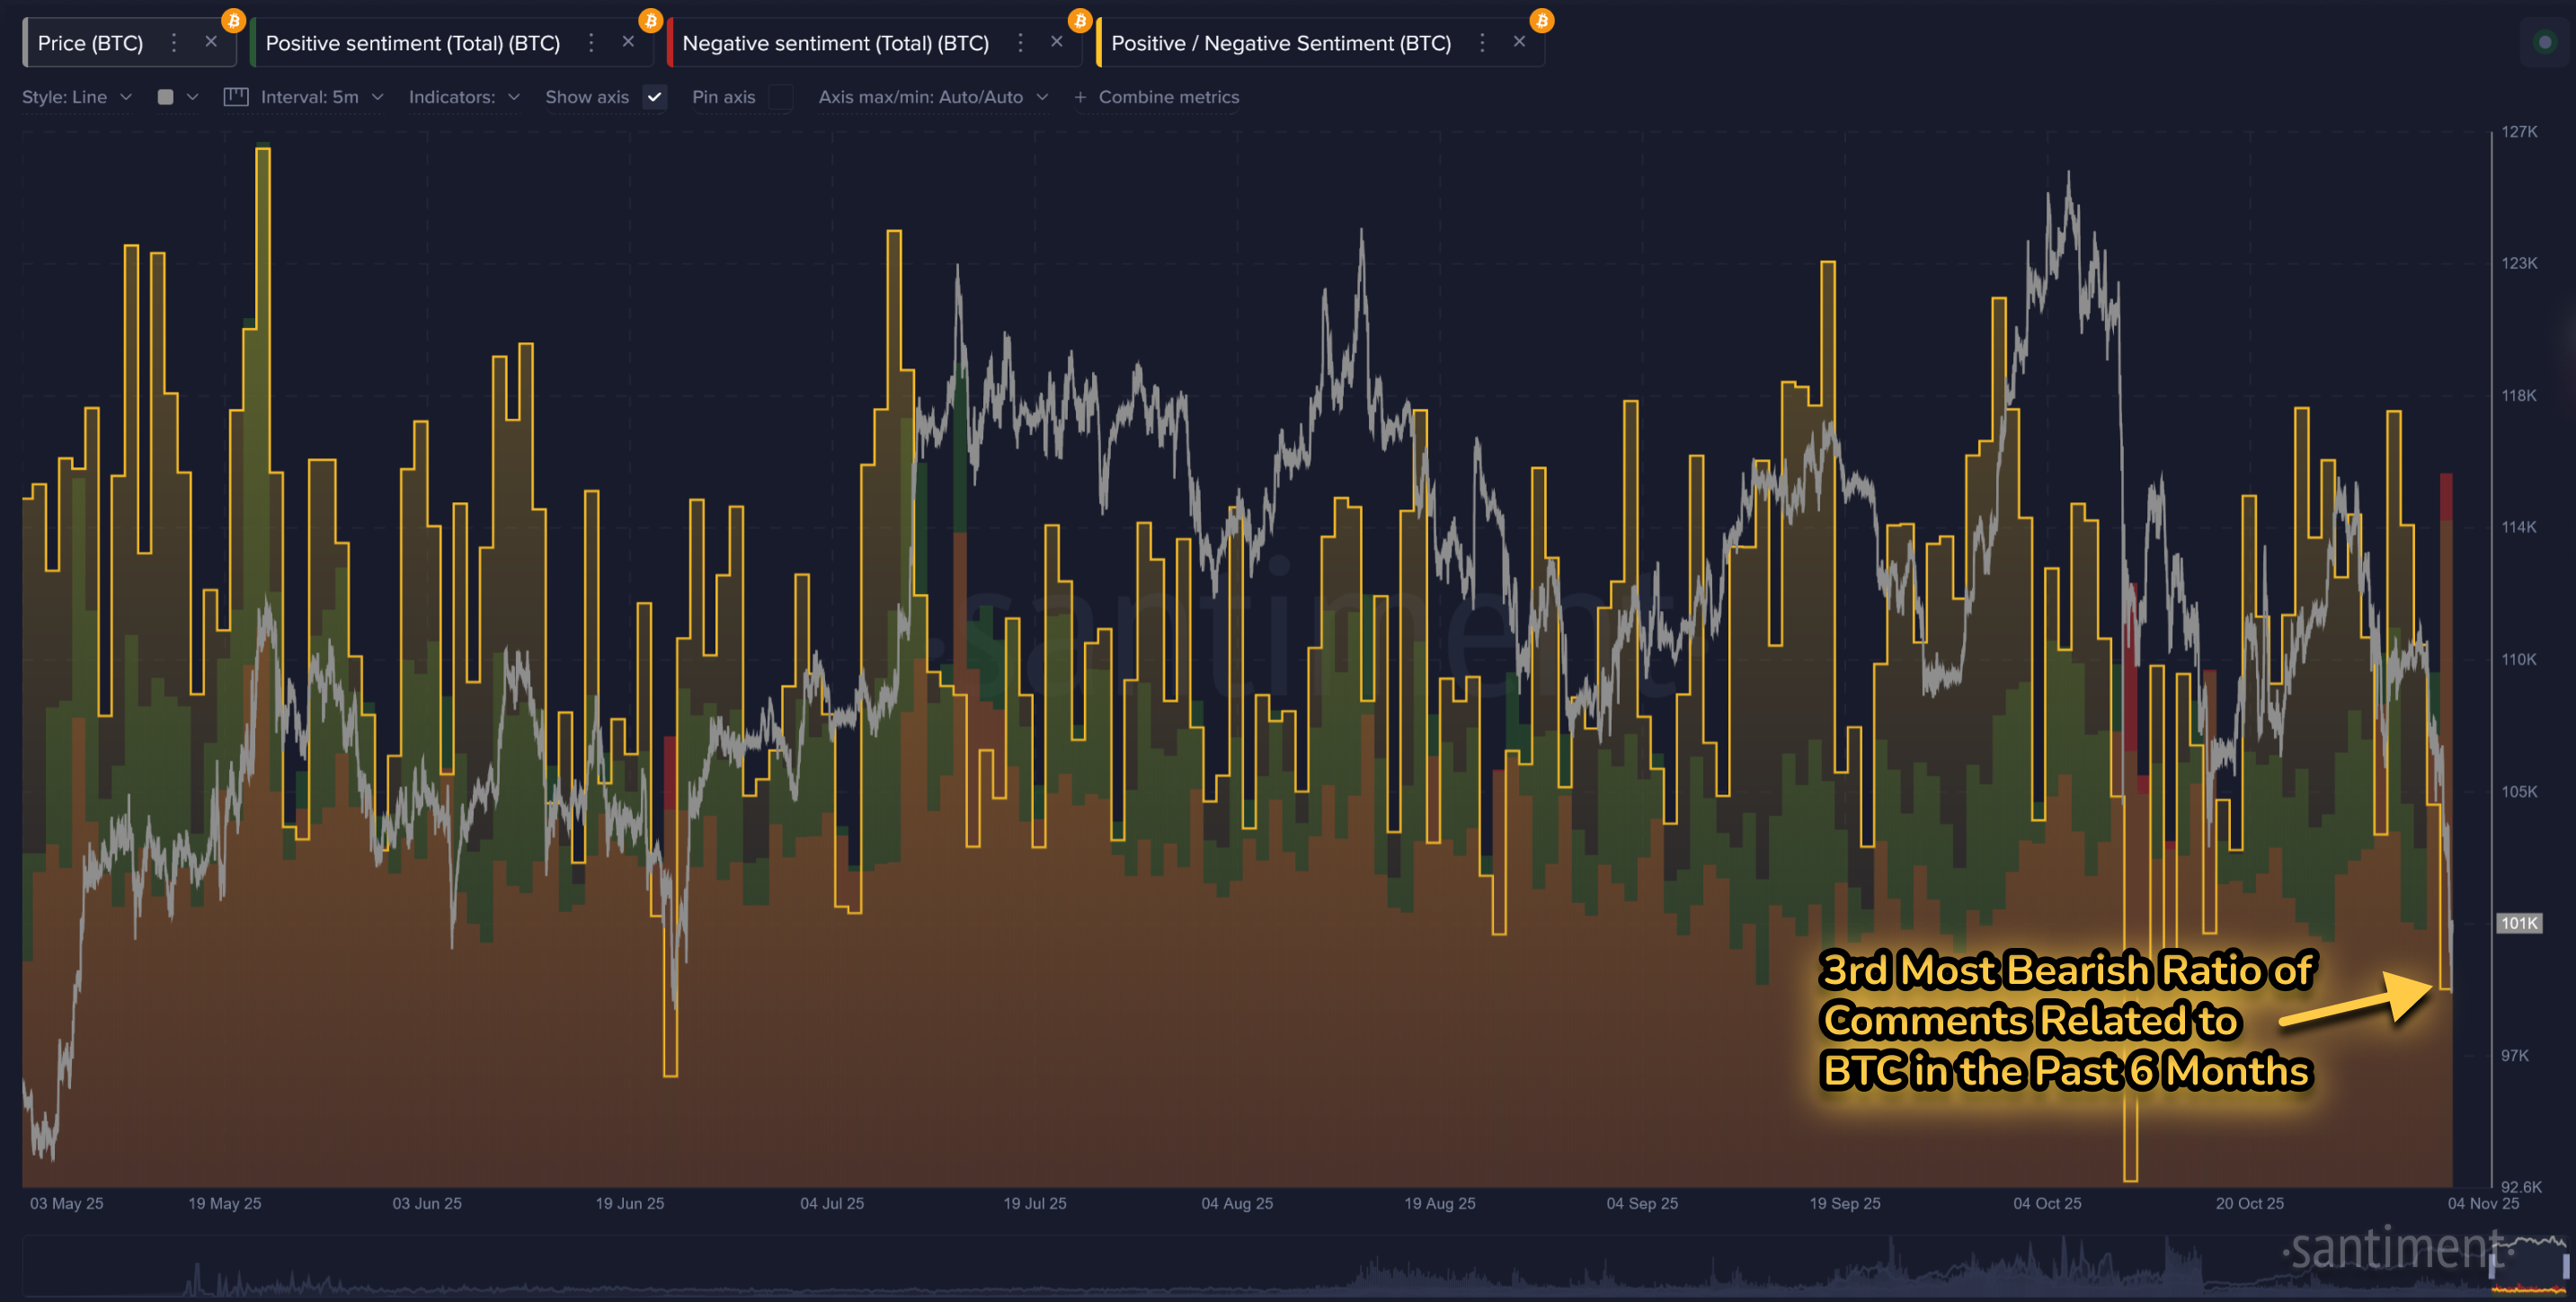
This market plummet is also a nice opportunity to check for how the ratio of positive vs. negative comments are for Bitcoin and other assets. Based on all of the comments that our algorithm deems as positive or negative, Tuesday marked the 3rd most bearish day of the past 6 months, according to the raw ratio of all of the bullish vs. bearish posts happening across social media. And the two more bearish days than today? Yes, they both marked bottoms and ideal buying opportunities. Clearly, this is a favorable sign of some upcoming relief.
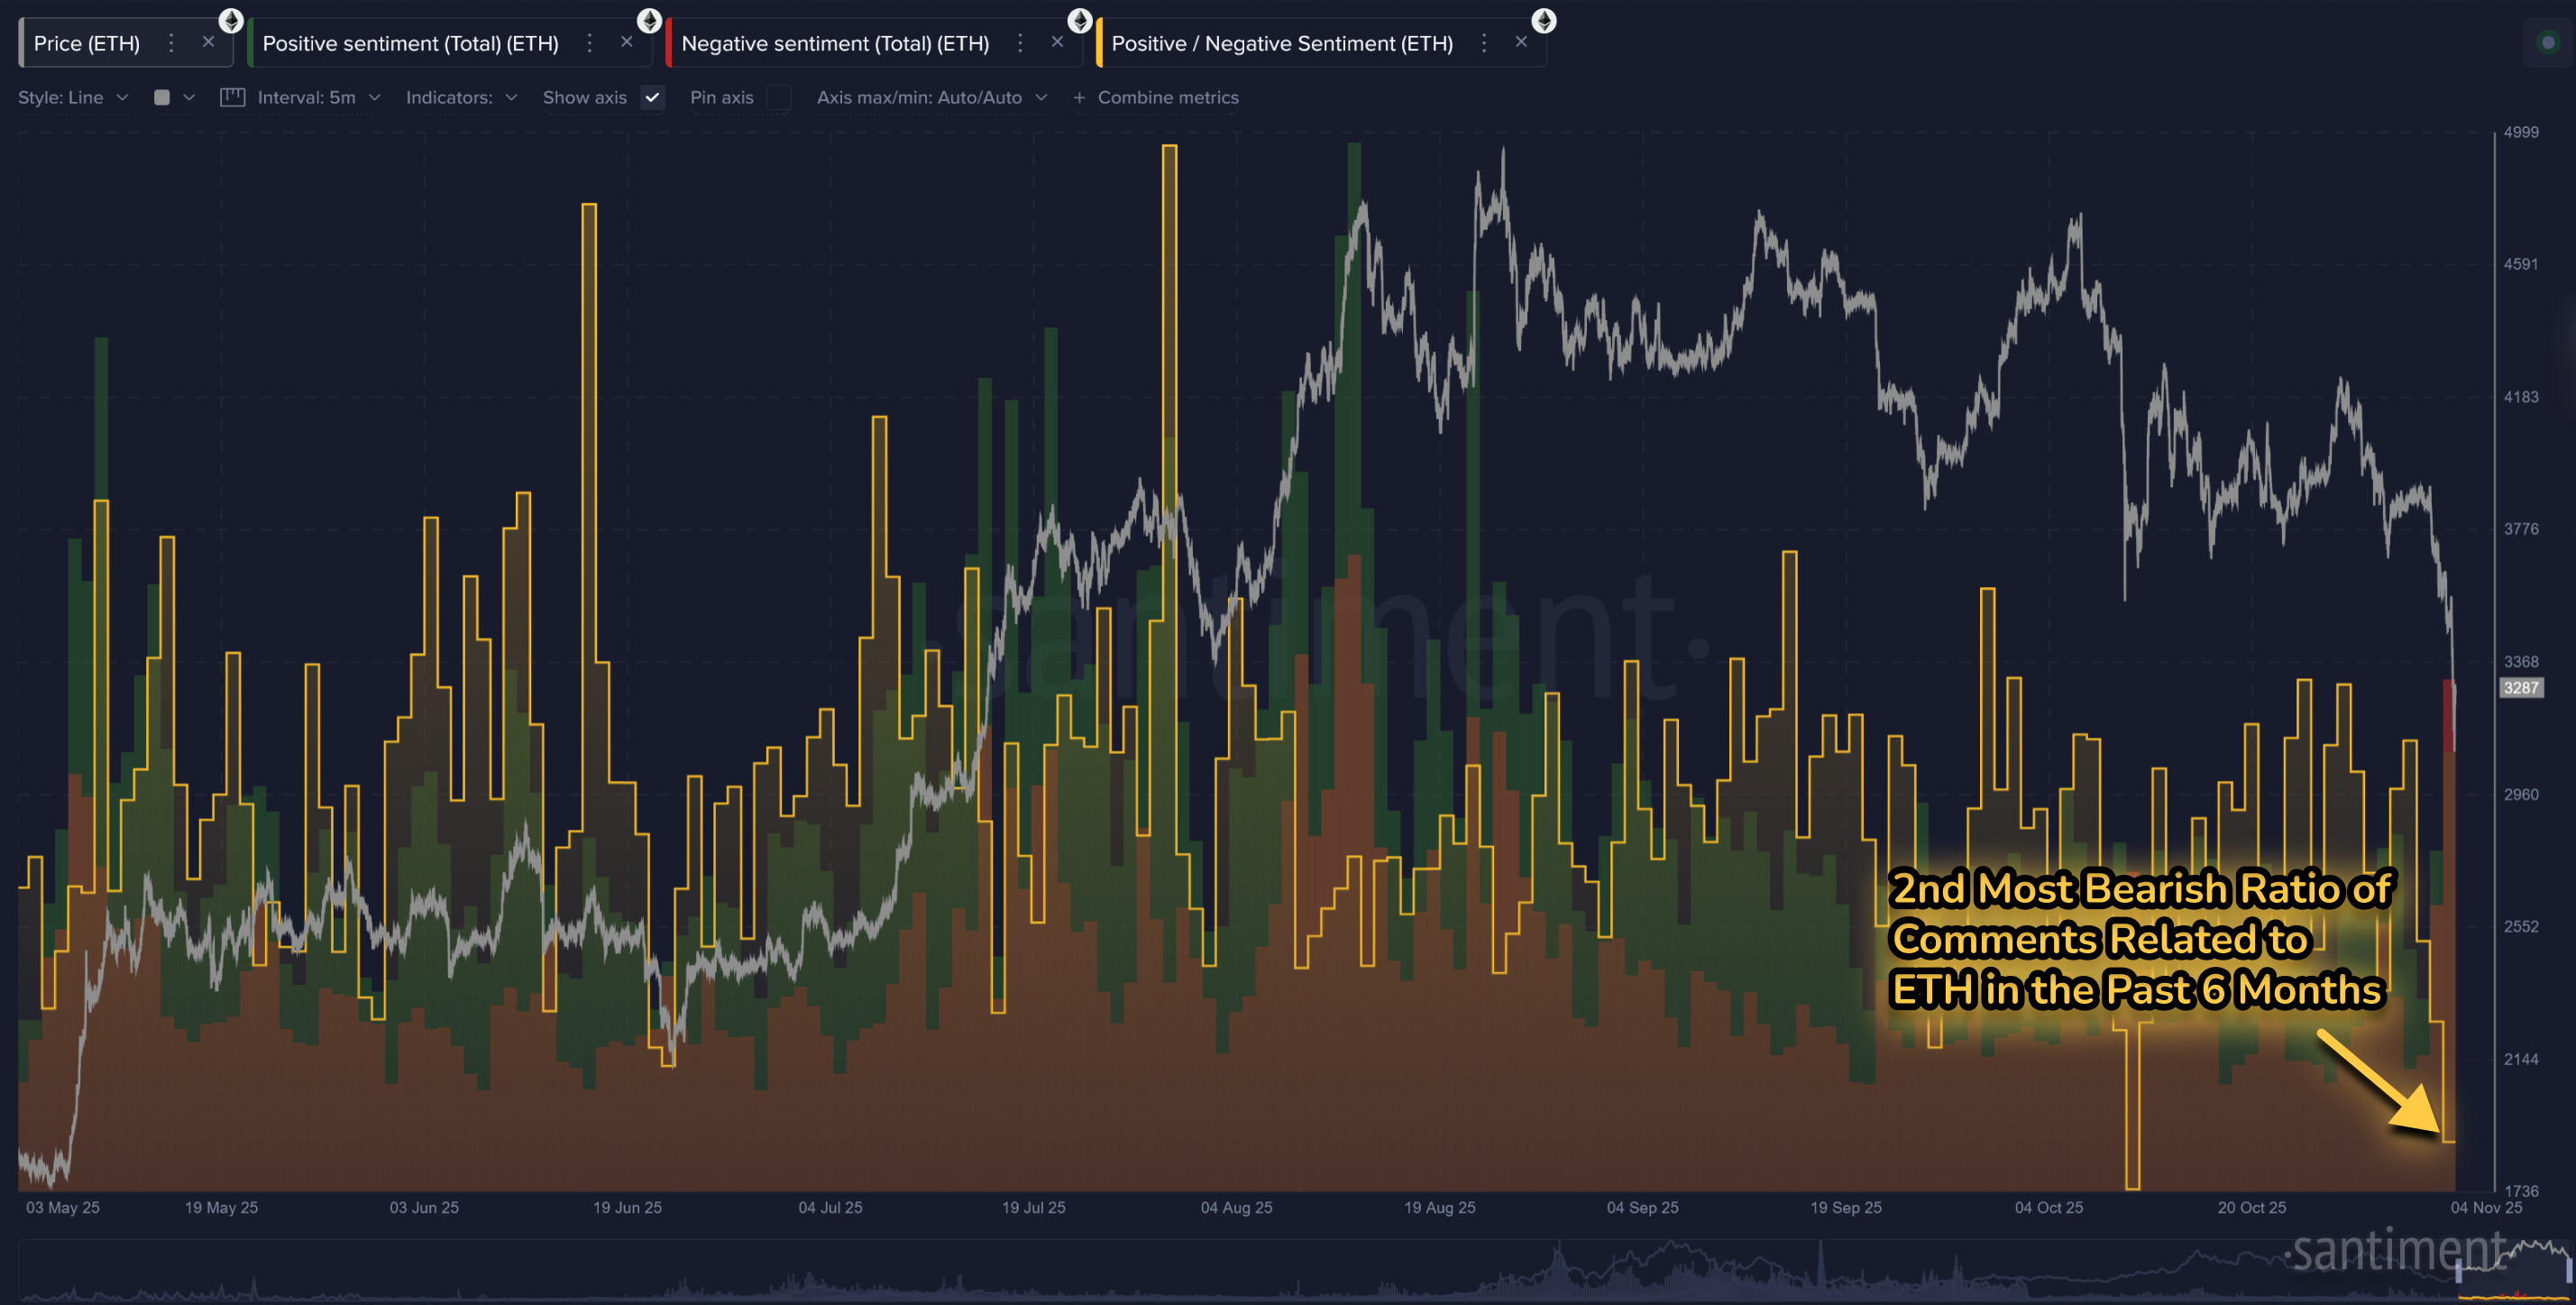
Ethereum's ratio of positive vs. negative comments is even more extreme, with today being the 2nd most bearish day in the past 6 months. Only the flash crash back on October 10th, when Trump temporarily threatened 100% tariffs on China, saw a higher level of bearish vs. bullish comments. FUD spikes have been relatively reliable signs of bottoms for ETH, just like it has been for BTC.
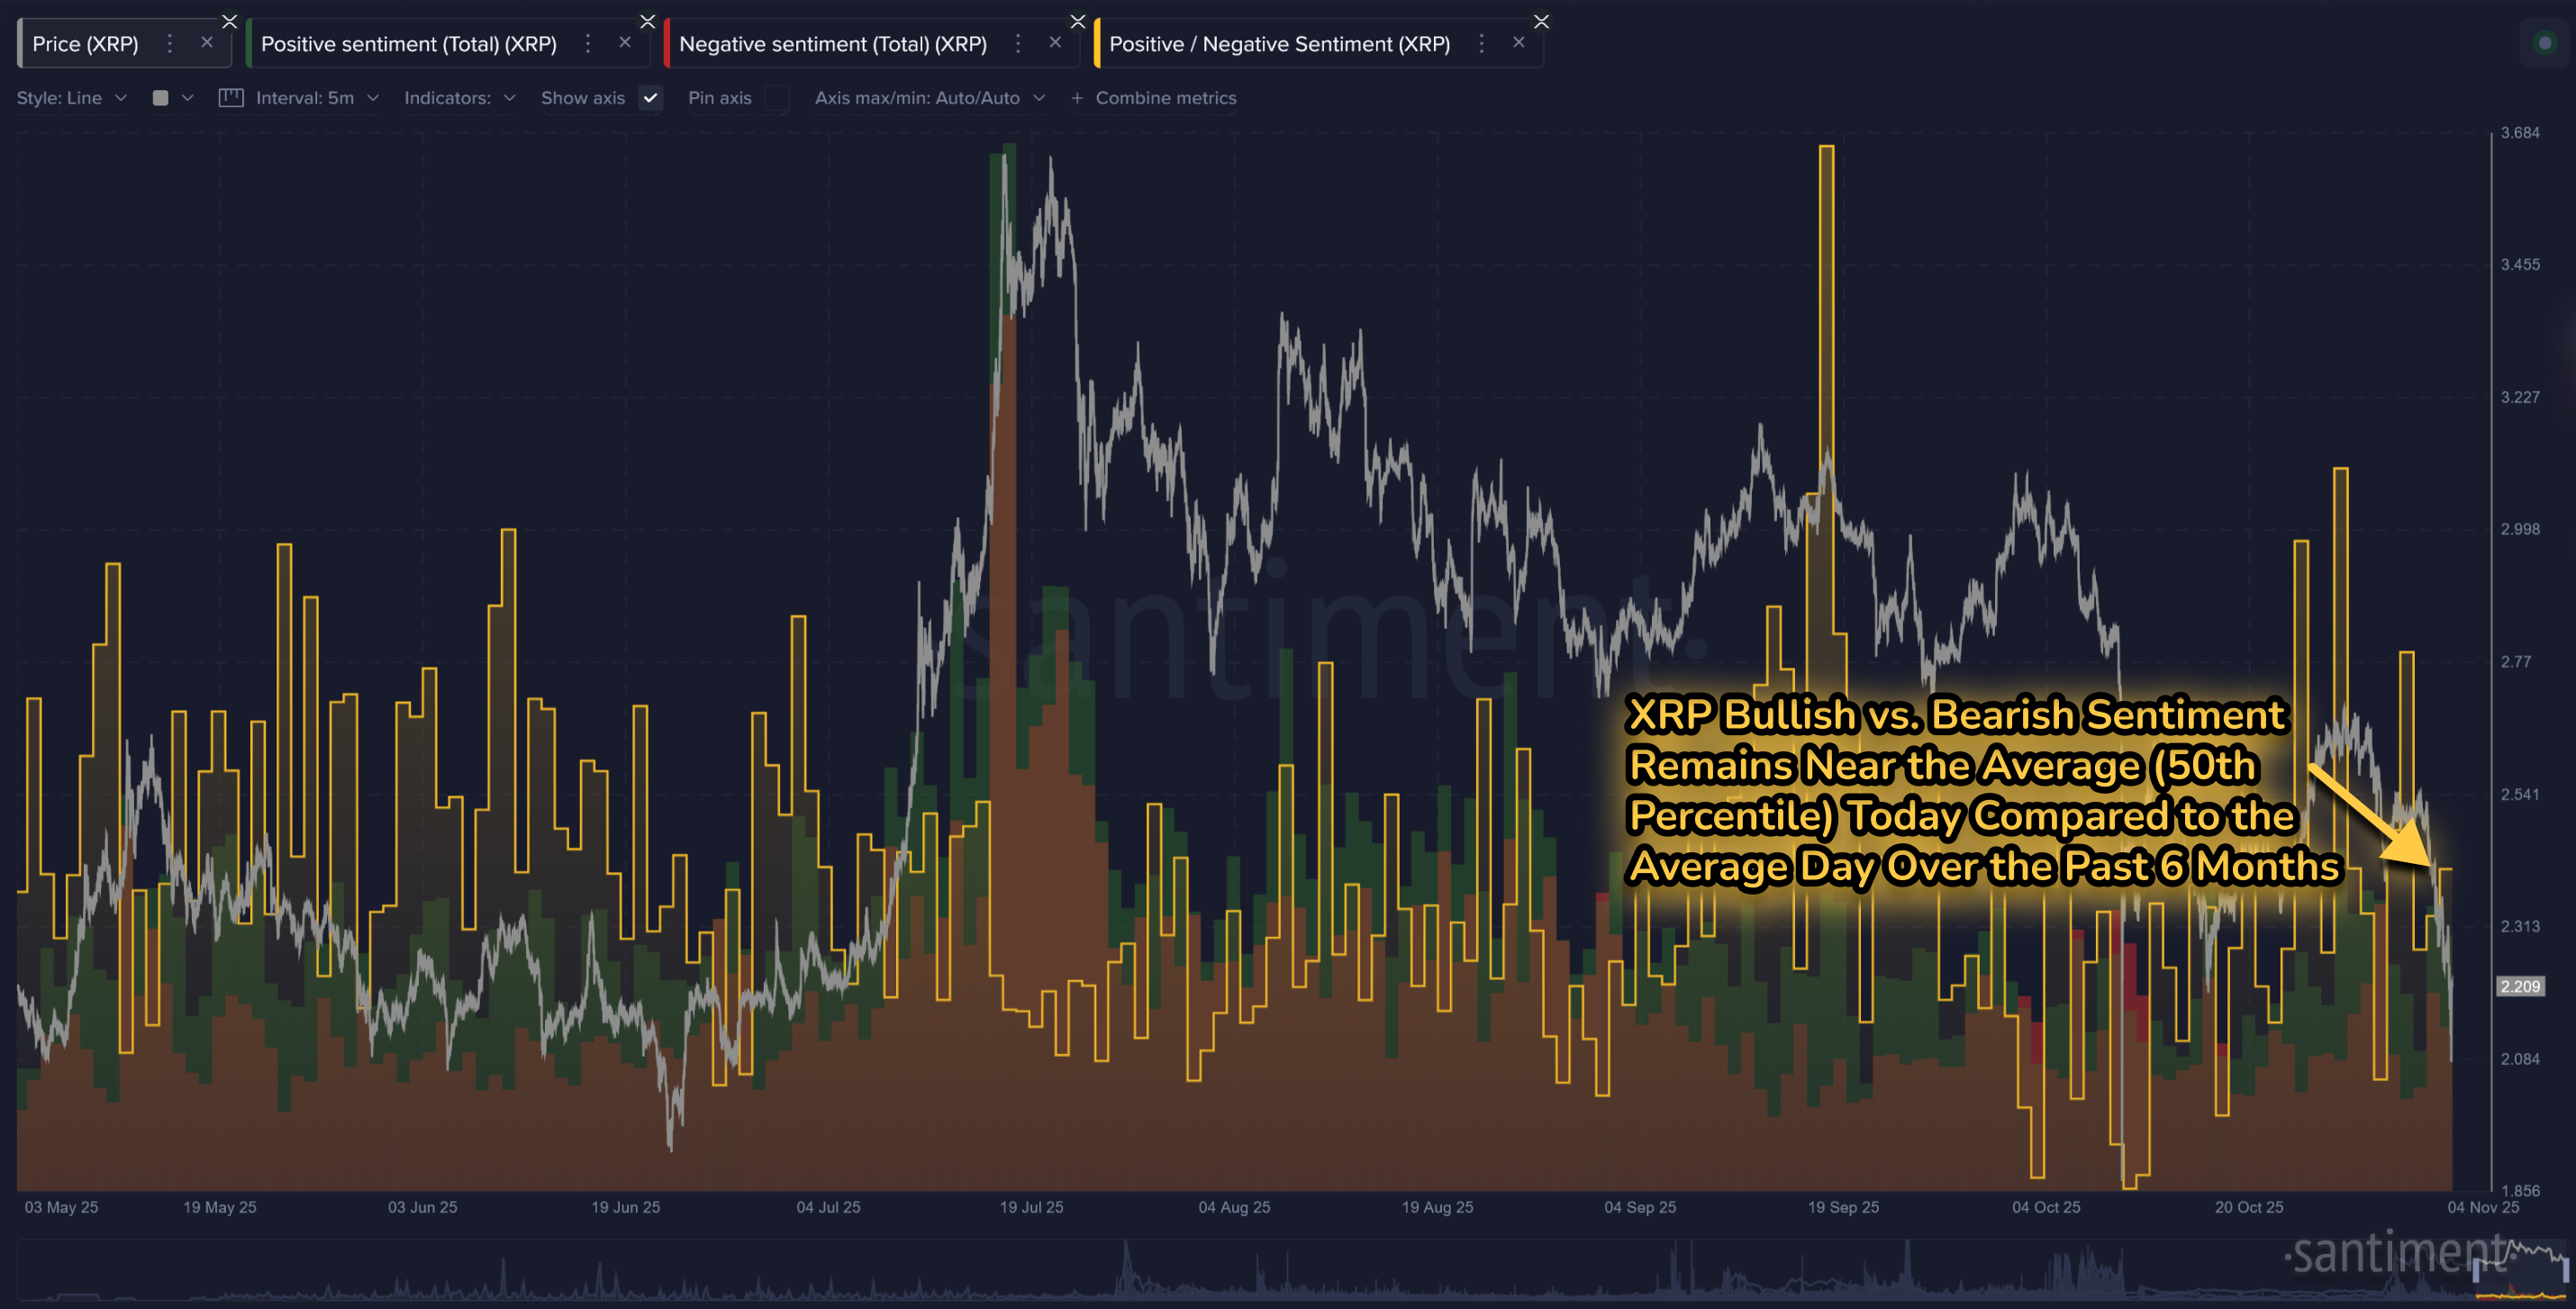
And as a bonus, we can take a look at XRP to see if it's seeing a similar milestone level of FUD. Unlike the top two marketcaps in crypto, XRP is showing what most other altcoins are showing... a surprising level of disinterest. The ratio of bullish vs. bearish comments is quite neutral for now, and many others look the same way. It's clear that most of retail has shifted their focus to just talking about BTC (and ETH, to a slightly lesser extent).
With all of this analysis about how retail is reacting to crypto's strong retrace, don't forget to keep an eye on how they are accumulating or dumping their coins. The red line below represents the total coins held by wallets with 0.01 or less BTC. Since the all-time high 4 weeks ago, retail has been aggressively accumulating with the expectation that any dip is an opportunity to buy more.
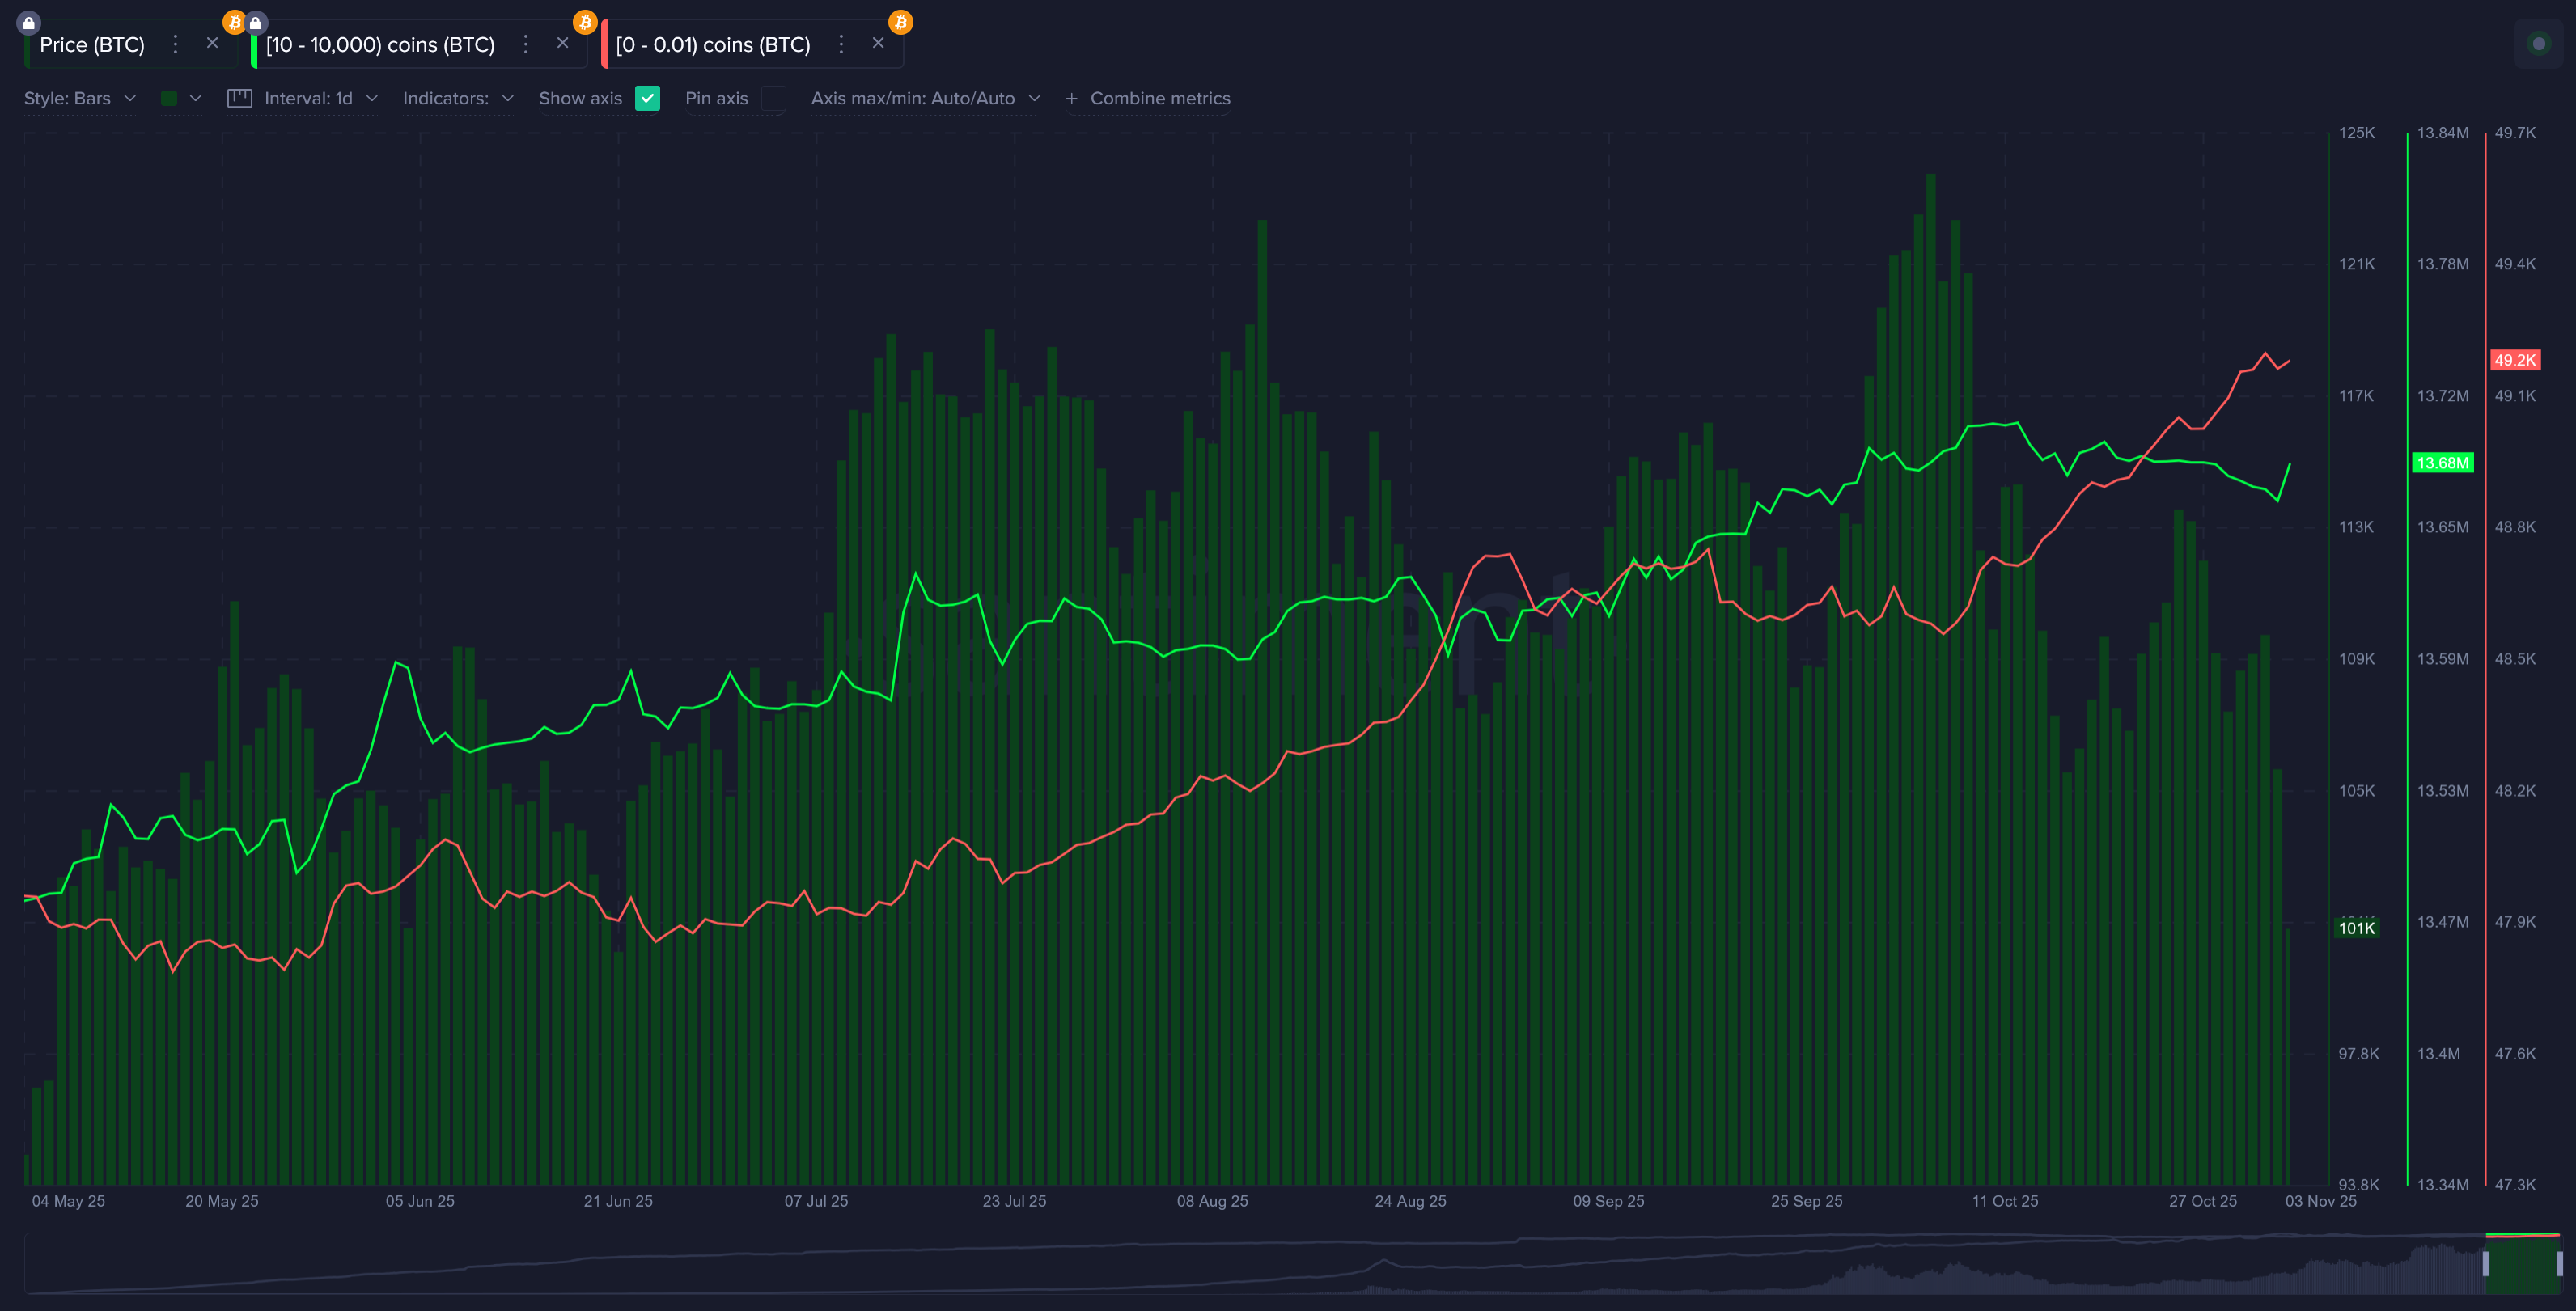
And while they have been accumulating as quickly as they can, the key stakeholders for Bitcoin (holding 10-10K BTC), in green, have been offloading their coins for over three weeks now. Not ideal. We do see signs that they have bought the dip a bit themselves, accumulating back ~17,789 in the past 24 hours. But we will need to see a more sustained period of time where they continue to accumulate, while retailers finally get worried and begin to dump themselves, in order to be convinced that the bloodbath has come to an end.
-----
Free two-week trials to Sanbase PRO (to access all mentioned Santiment data in this article, and plenty more) are AVAILABLE HERE!
-----
Disclaimer: The opinions expressed in the post are for general informational purposes only and are not intended to provide specific advice or recommendations for any individual or on any specific security or investment product.