Deep Dive: Finding Alpha From Key and Micro Stakeholders EASILY!

Santiment now has a brand new chart template that is arguably one of the most powerful to date. You can now analyze whale and shark (key stakeholder) AND micro trader behavior, for multiple key assets, all in one place. One of the primary main drivers for cryptocurrency markets to grow (or shrink) is the amount of accumulation being done by the largest players in crypto.
Whether you're looking to foreshadow price movements of Bitcoin, Ethereum, or even a small unknown altcoin that nobody else in your circle is paying attention to, all coins have key stakeholders (typically millionaire, or even billionaire, holders of a given asset) that have injected their own capital to greatly assist in allowing prices to get to where they are today. At the same time, there are particularly small wallets (typically wallets with under $100 worth of an asset) that act as a counter-signal due to consistent irrational trades that lag whatever the key stakeholders are doing.
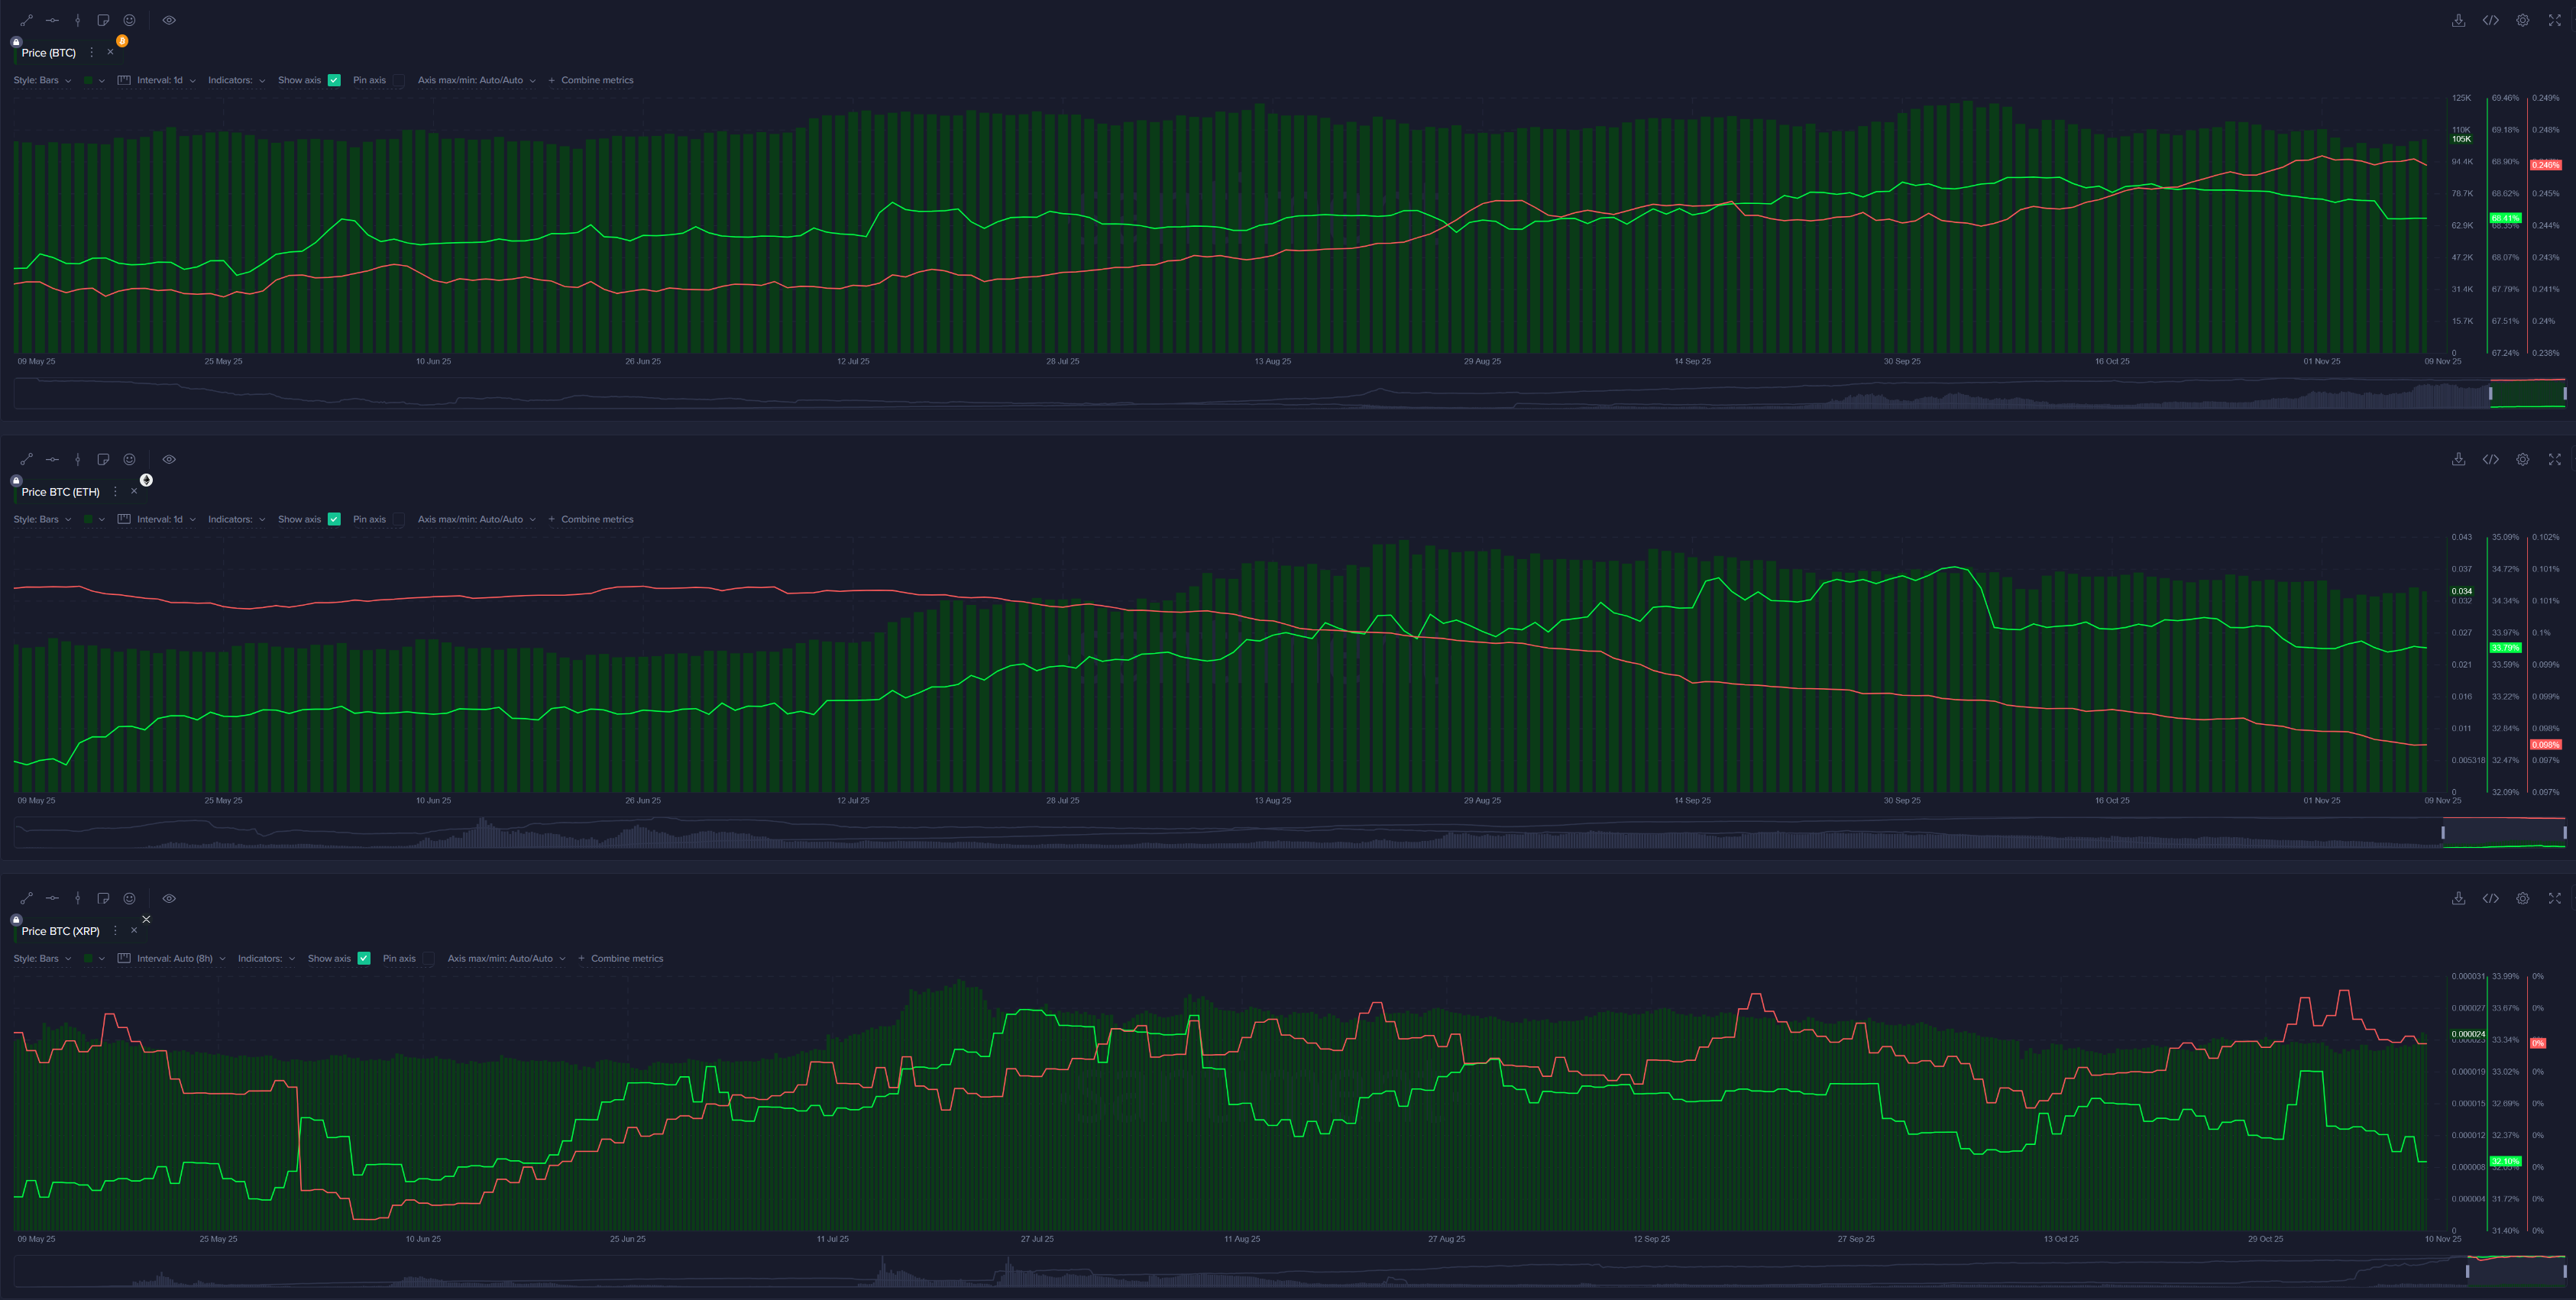
We have made a chart template that follows six key coins' respective key and micro stakehoders, with the green lines representing the amount of coins held by prominent large whale and shark tiers, and the red lines representing the coins held by the smallest wallets. See our chart below that represents the large and small holders for Bitcoin, Ethereum, XRP, Cardano, Wrapped Ethereum, and Lido Staked Ethereum:
What makes this such a big deal? Let's start with the basics of why large (and micro) wallets are key in understanding where prices are likely heading next for a given coin.
For most coins, over time, you'll see that a project's market value will often (but not always) follow the direction of the green line. When whales and sharks accumulate and the green line goes up, this is a sign that more large capital is pouring in, which provides some stability and a foundation for support. If they dump, that means that same foundation that helped prop up prices is now at risk of crumbling at any time.
And at the same time, when micro wallets are accumulating, it's typically because they are buying from dumping large wallets. While dumping means they are selling off their coins to whales that are adding to their bags. Prices move the opposite direction of the crowd's expectations, and the crowd is almost always part of the micro tier of holders... The small, minority who isn't rushing to social media are the big key stakeholders of an asset, who hold their cards close to their vests.
So how do we analyze key vs. micro stakeholders on a Santiment chart? Let's take a look at the past year of fluctuations of Bitcoin's 10-10K BTC wallets (green) line vs. the <0.01 BTC wallets (red line), with the dark green bars acting as the daily price close for Bitcoin's market value:
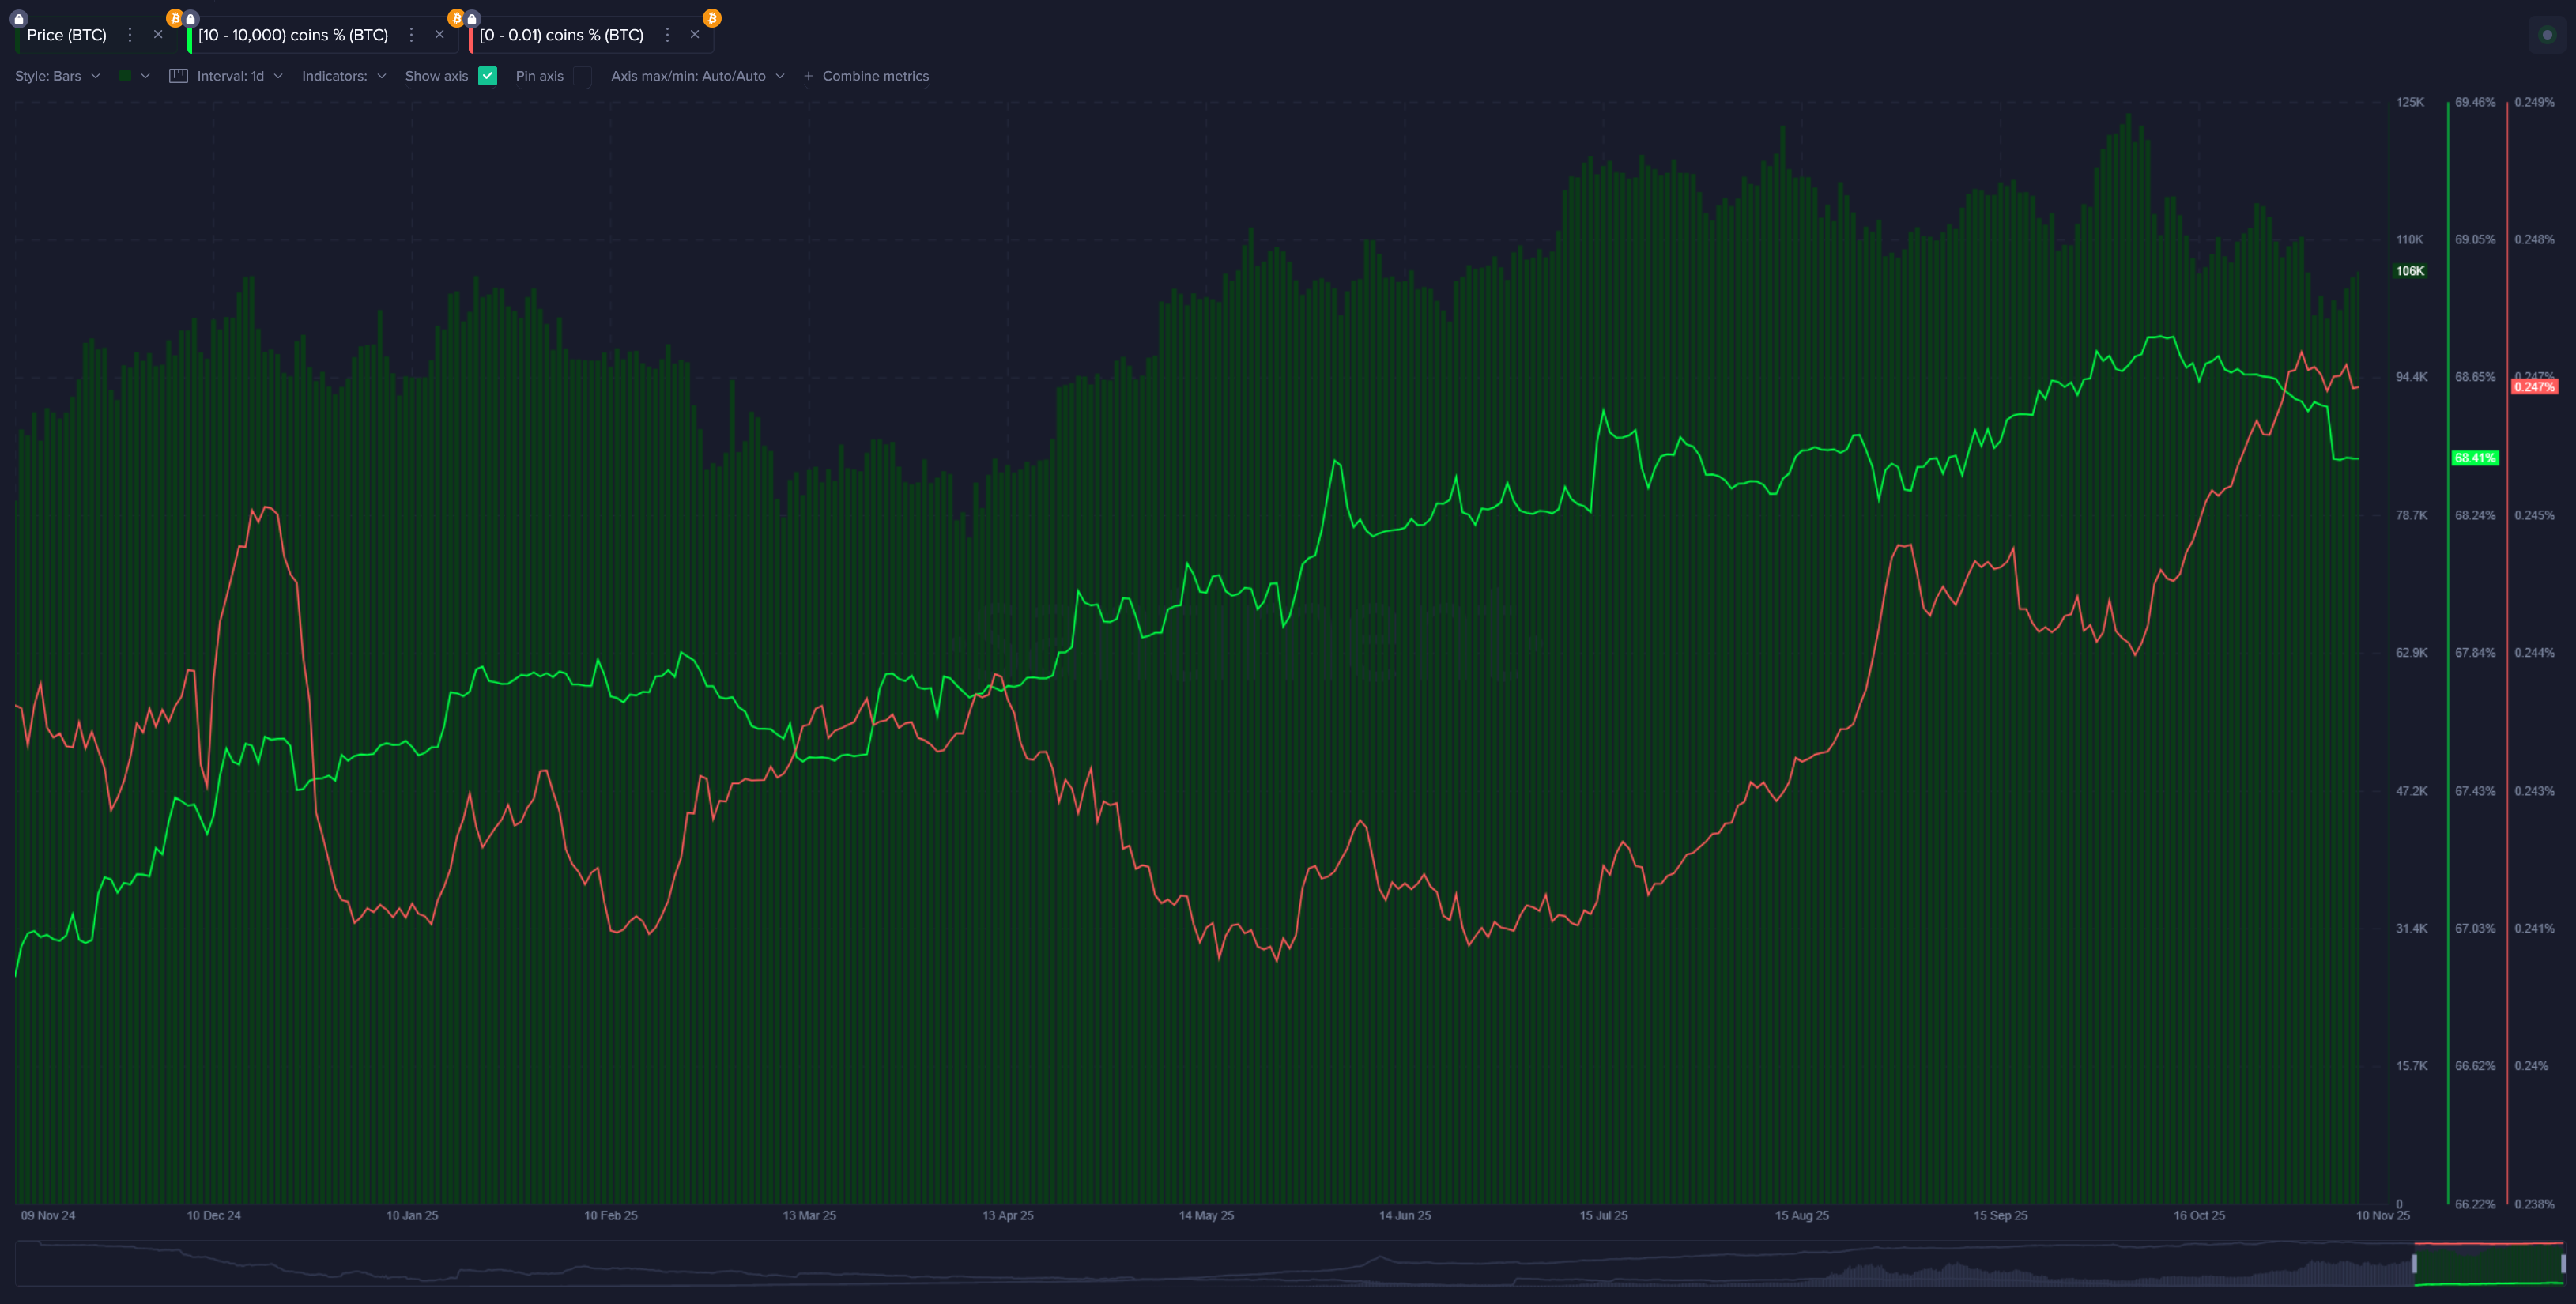
We can see several moments where the green (key stakeholder) line is going up, indicating they are accumulating. But when they are moving up, and the red (micro stakeholder) line is going down, that's when the fireworks start and price of Bitcoin typically surges.
To illustrate this, let's color-code the past year of Bitcoin wallet tier data as follows:
🟩: Key stakeholders accumulating, micro stakeholders dumping (perfect conditions)
🟦: Key stakeholders accumulating, micro stakeholders accumulating/flat (good conditions)
🟨: Key stakeholders flat, micro stakeholders flat (neutral conditions)
🟧: Key stakeholders dumping, micro stakeholders dumping/flat (concerning conditions)
🟥: Key stakeholders dumping, micro stakeholders accumulating (terrible conditions)
Bitcoin (BTC)
Try not to be intimidated by the variety of colors, but this is the result for Bitcoin when we apply this legend to every major (and only major) swing in the key and micro stakeholder lines on the same chart!
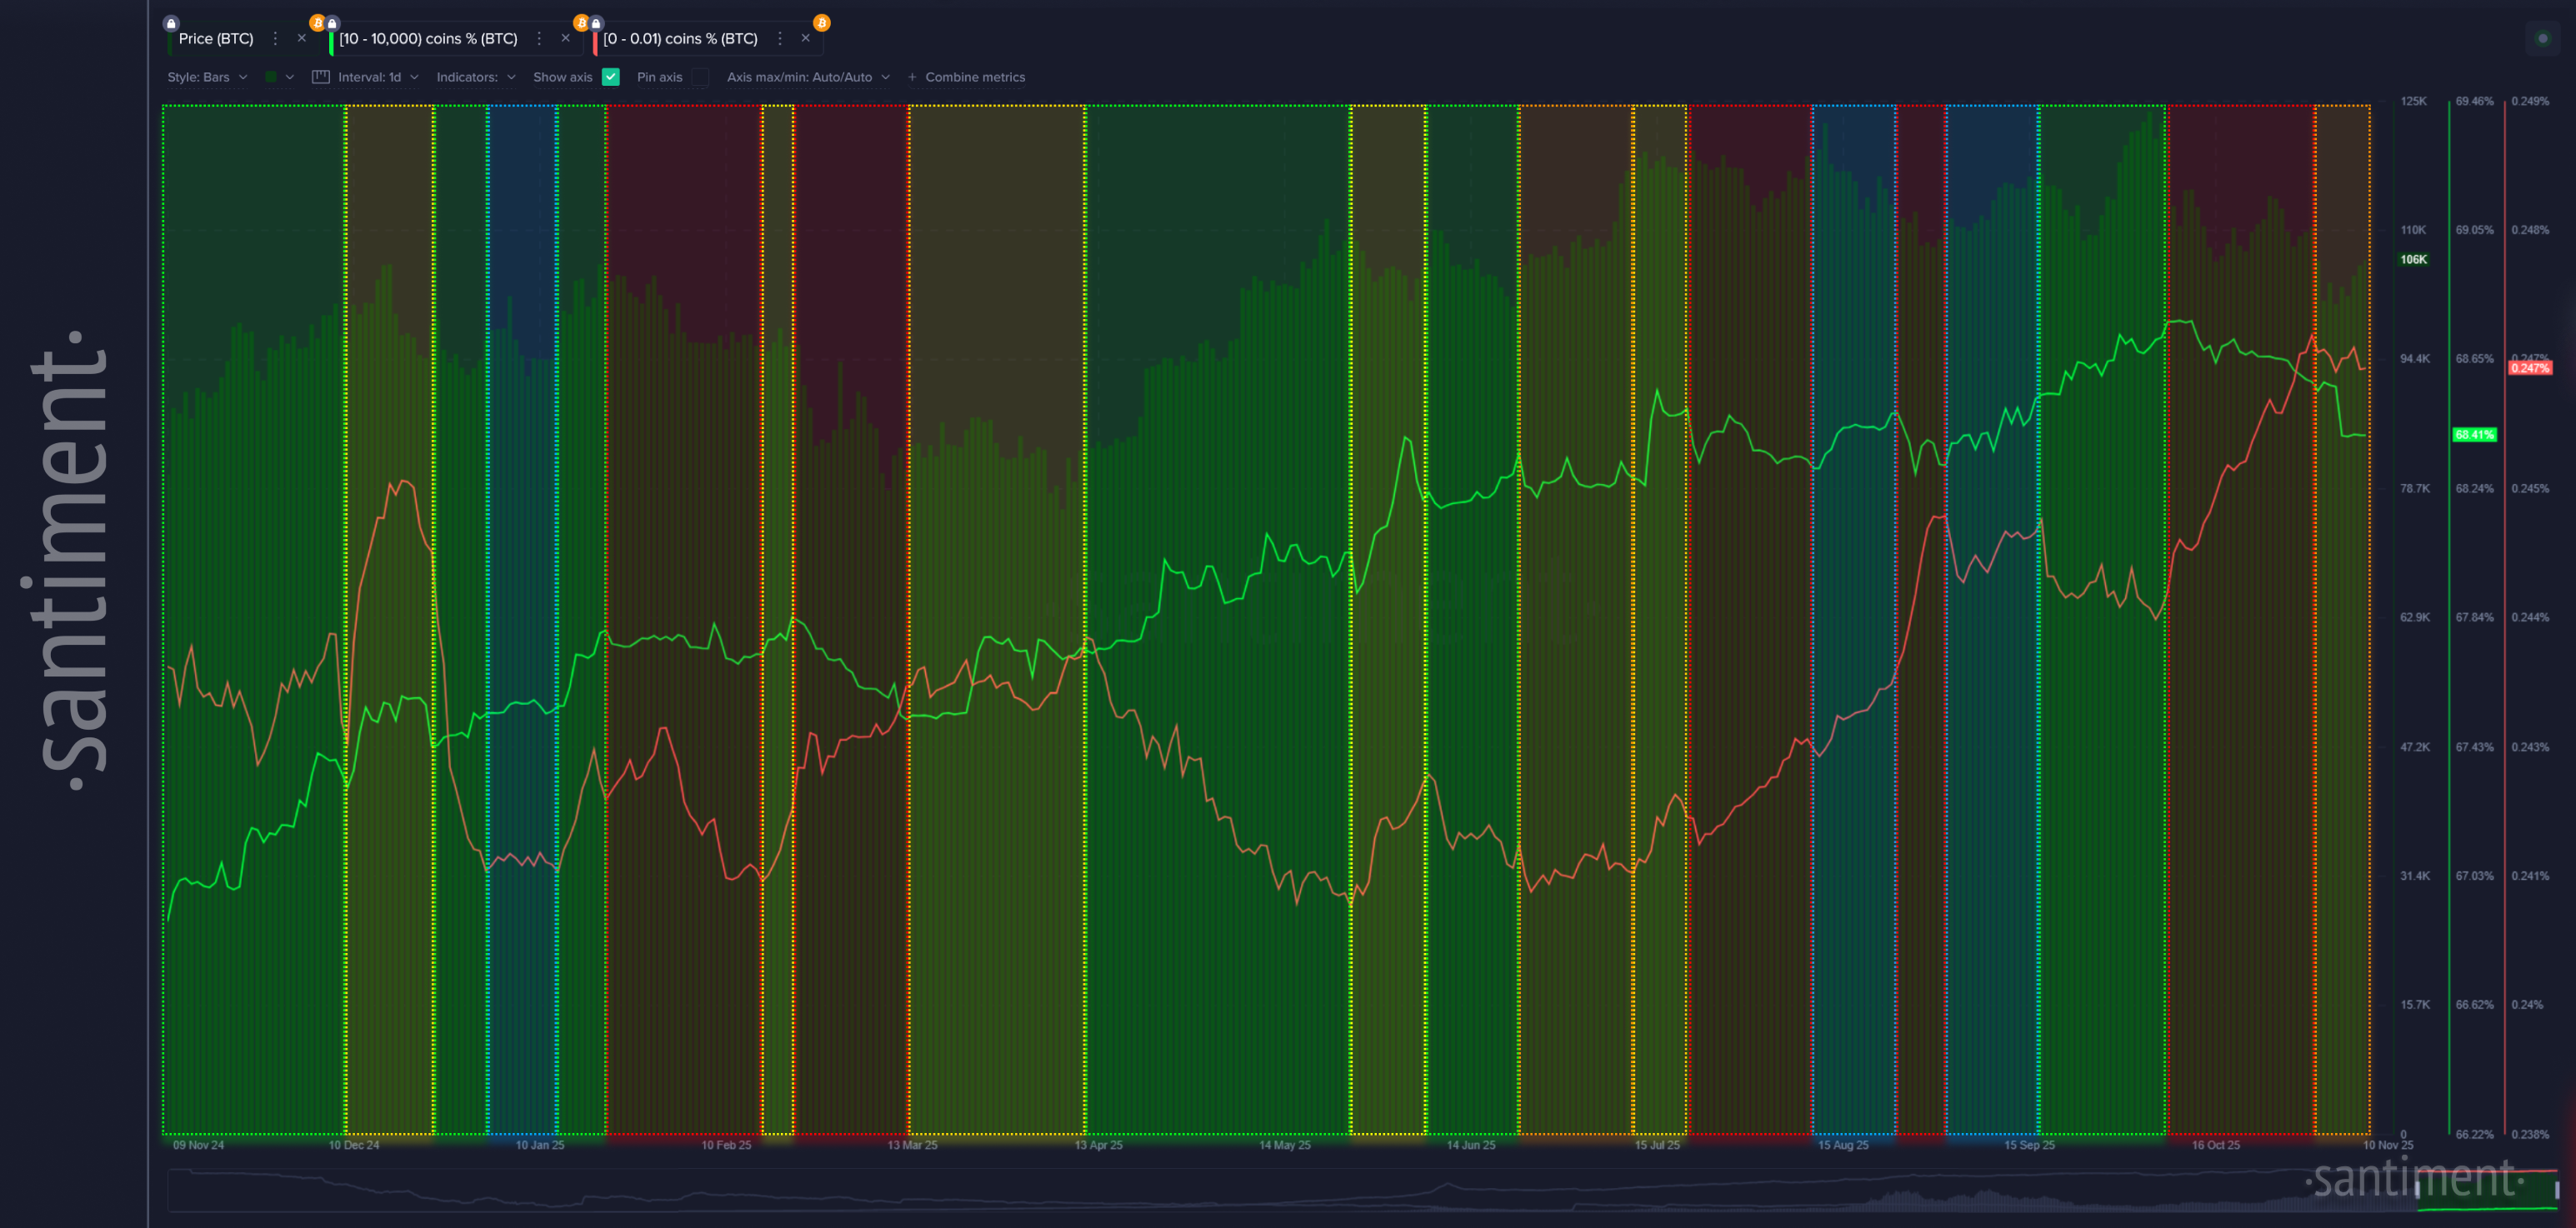
So what do we see here? Well, we've followed our above color-code rules somewhat imperfectly, but to the best of our abilities. For the most part, you should see that the biggest bull rallies are indeed when the green line is going up and the red line is moving down (with those periods being properly designated by a green shade. And vice versa, prices definitely go through downswings when key stakeholders dump and micro stakeholders are scooping up their coins, properly designated a red shade. It does get more tricky and less consistent in the blue, yellow, and orange zones... but that's to be expected, because they are defined as less confident signals.
Now moving on to other coins, we can analyze them the same way as Bitcoin but with a few caveats:
- Their key stakeholders may not always be as accurately correlated as Bitcoin, because prices of every other coin are consistently being dragged up and down by... well, Bitcoin.
- To find better correlations, instead of measuring prices by USD, we're measuring their prices vs. Bitcoin to better see how altcoins' key and micro stakeholders are able to move prices directly AGAINST Bitcoin's price to see their true impact.
Ethereum (ETH)
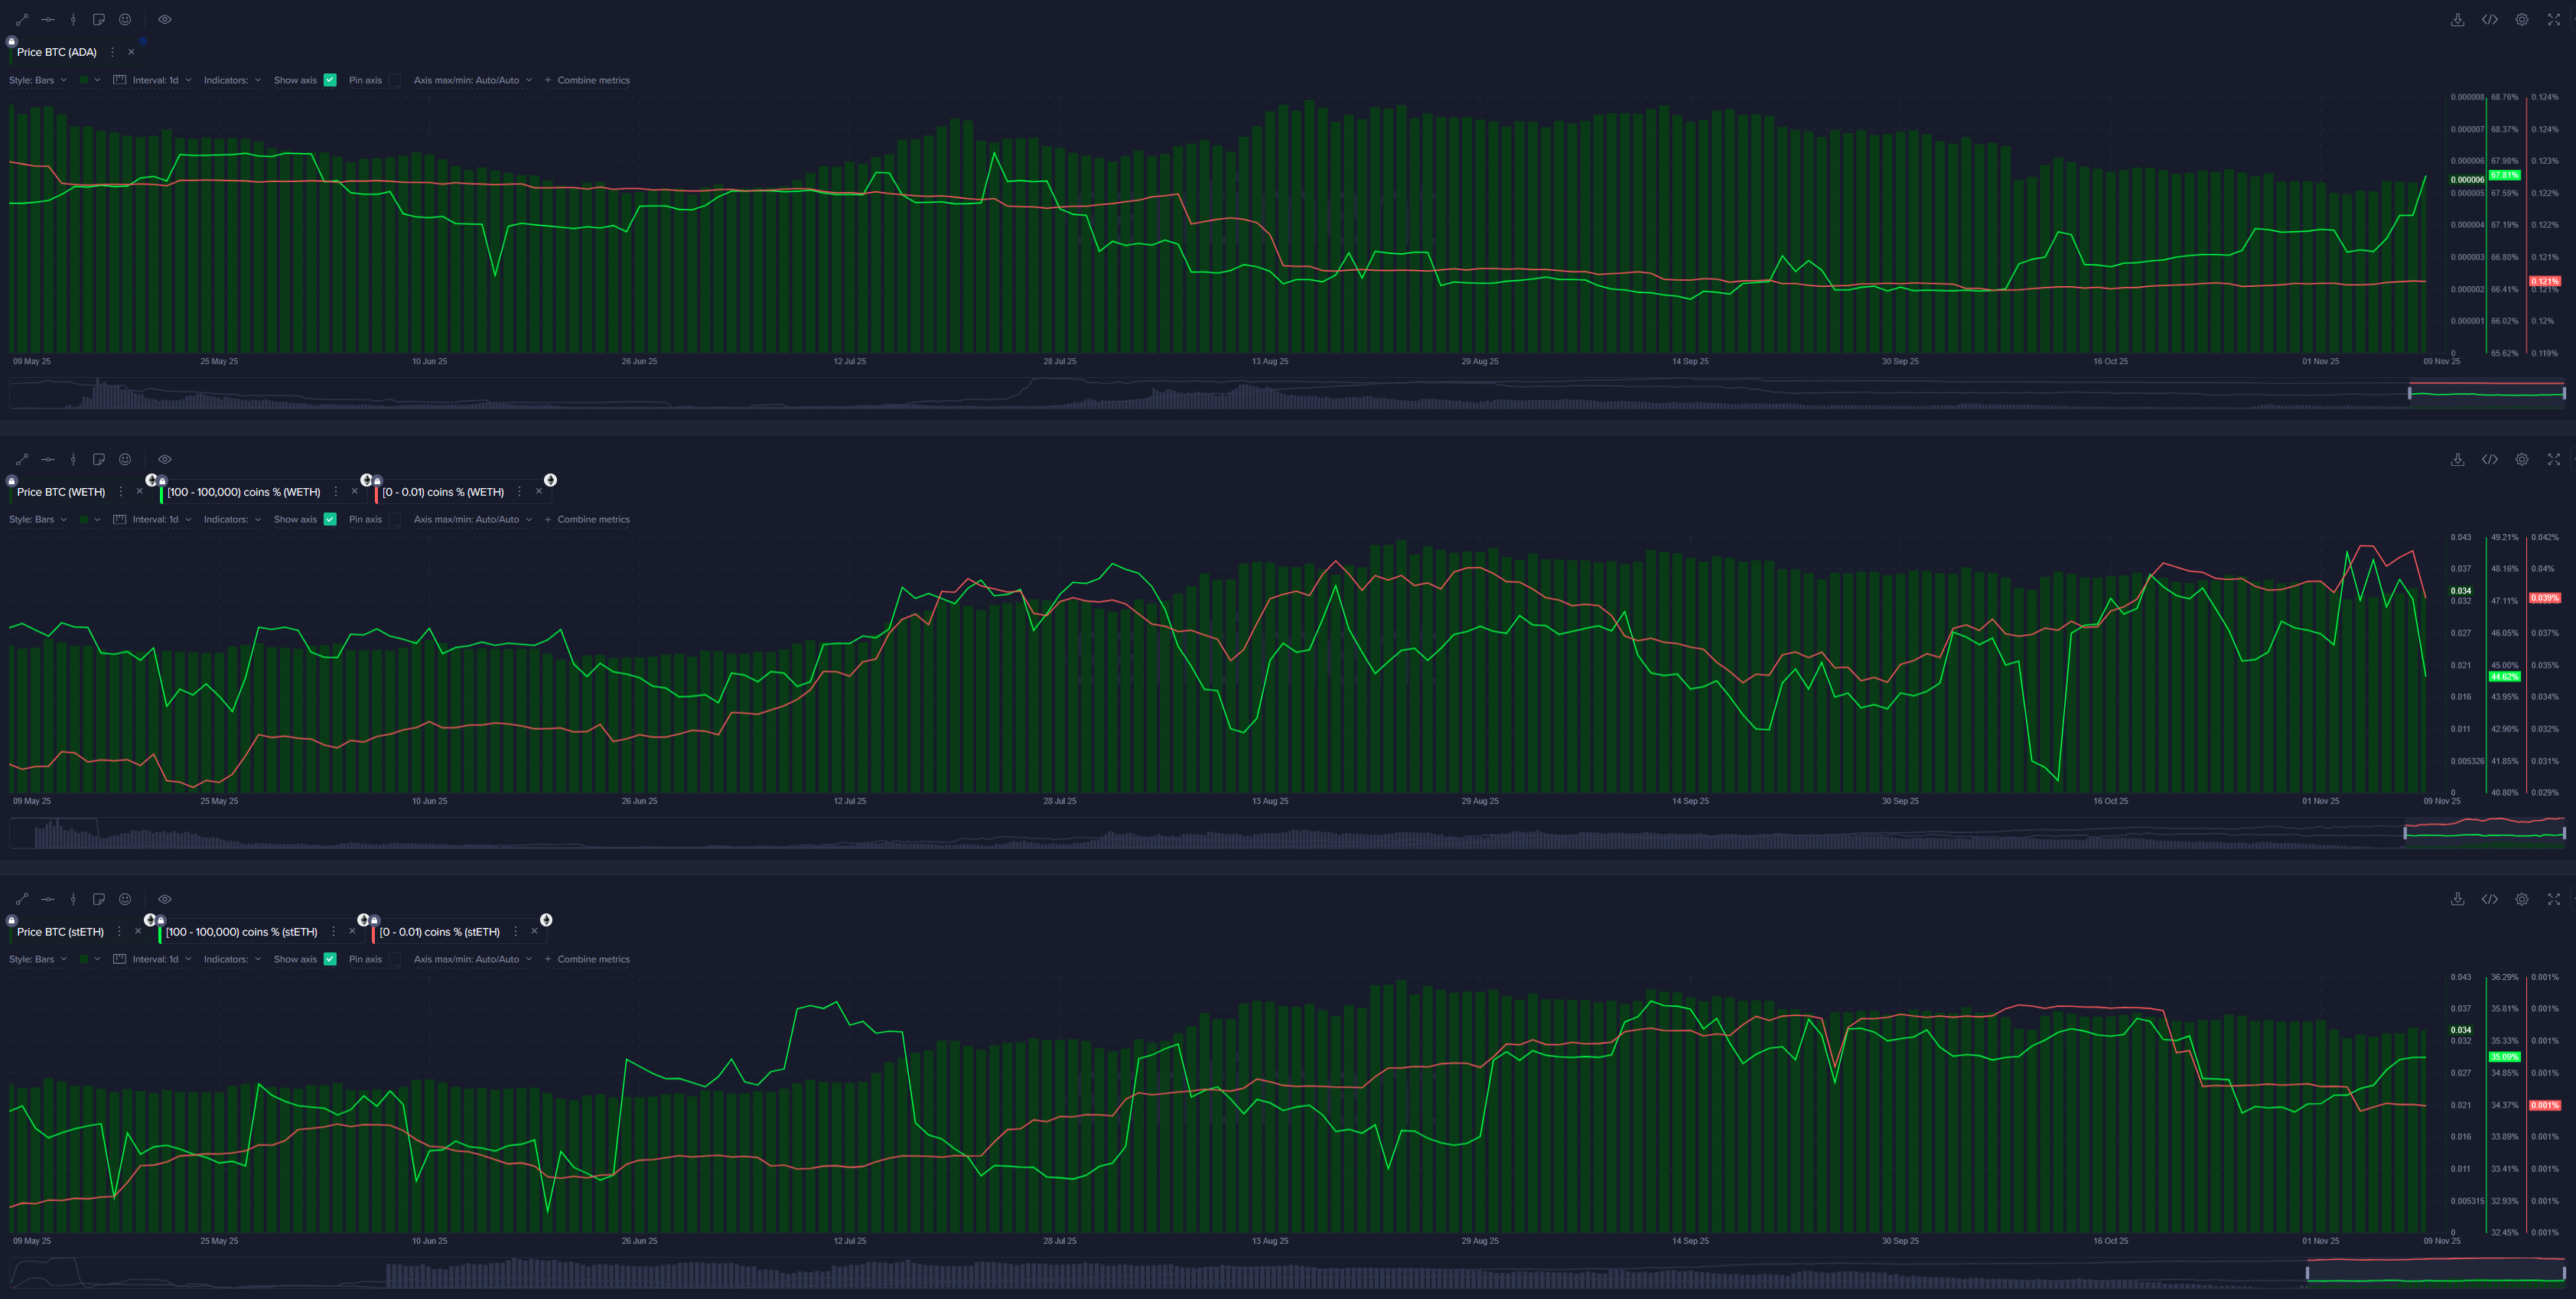
With all this said, here's how things have looked for Ethereum over the past year based on the same criteria that we've just used for Bitcoin:
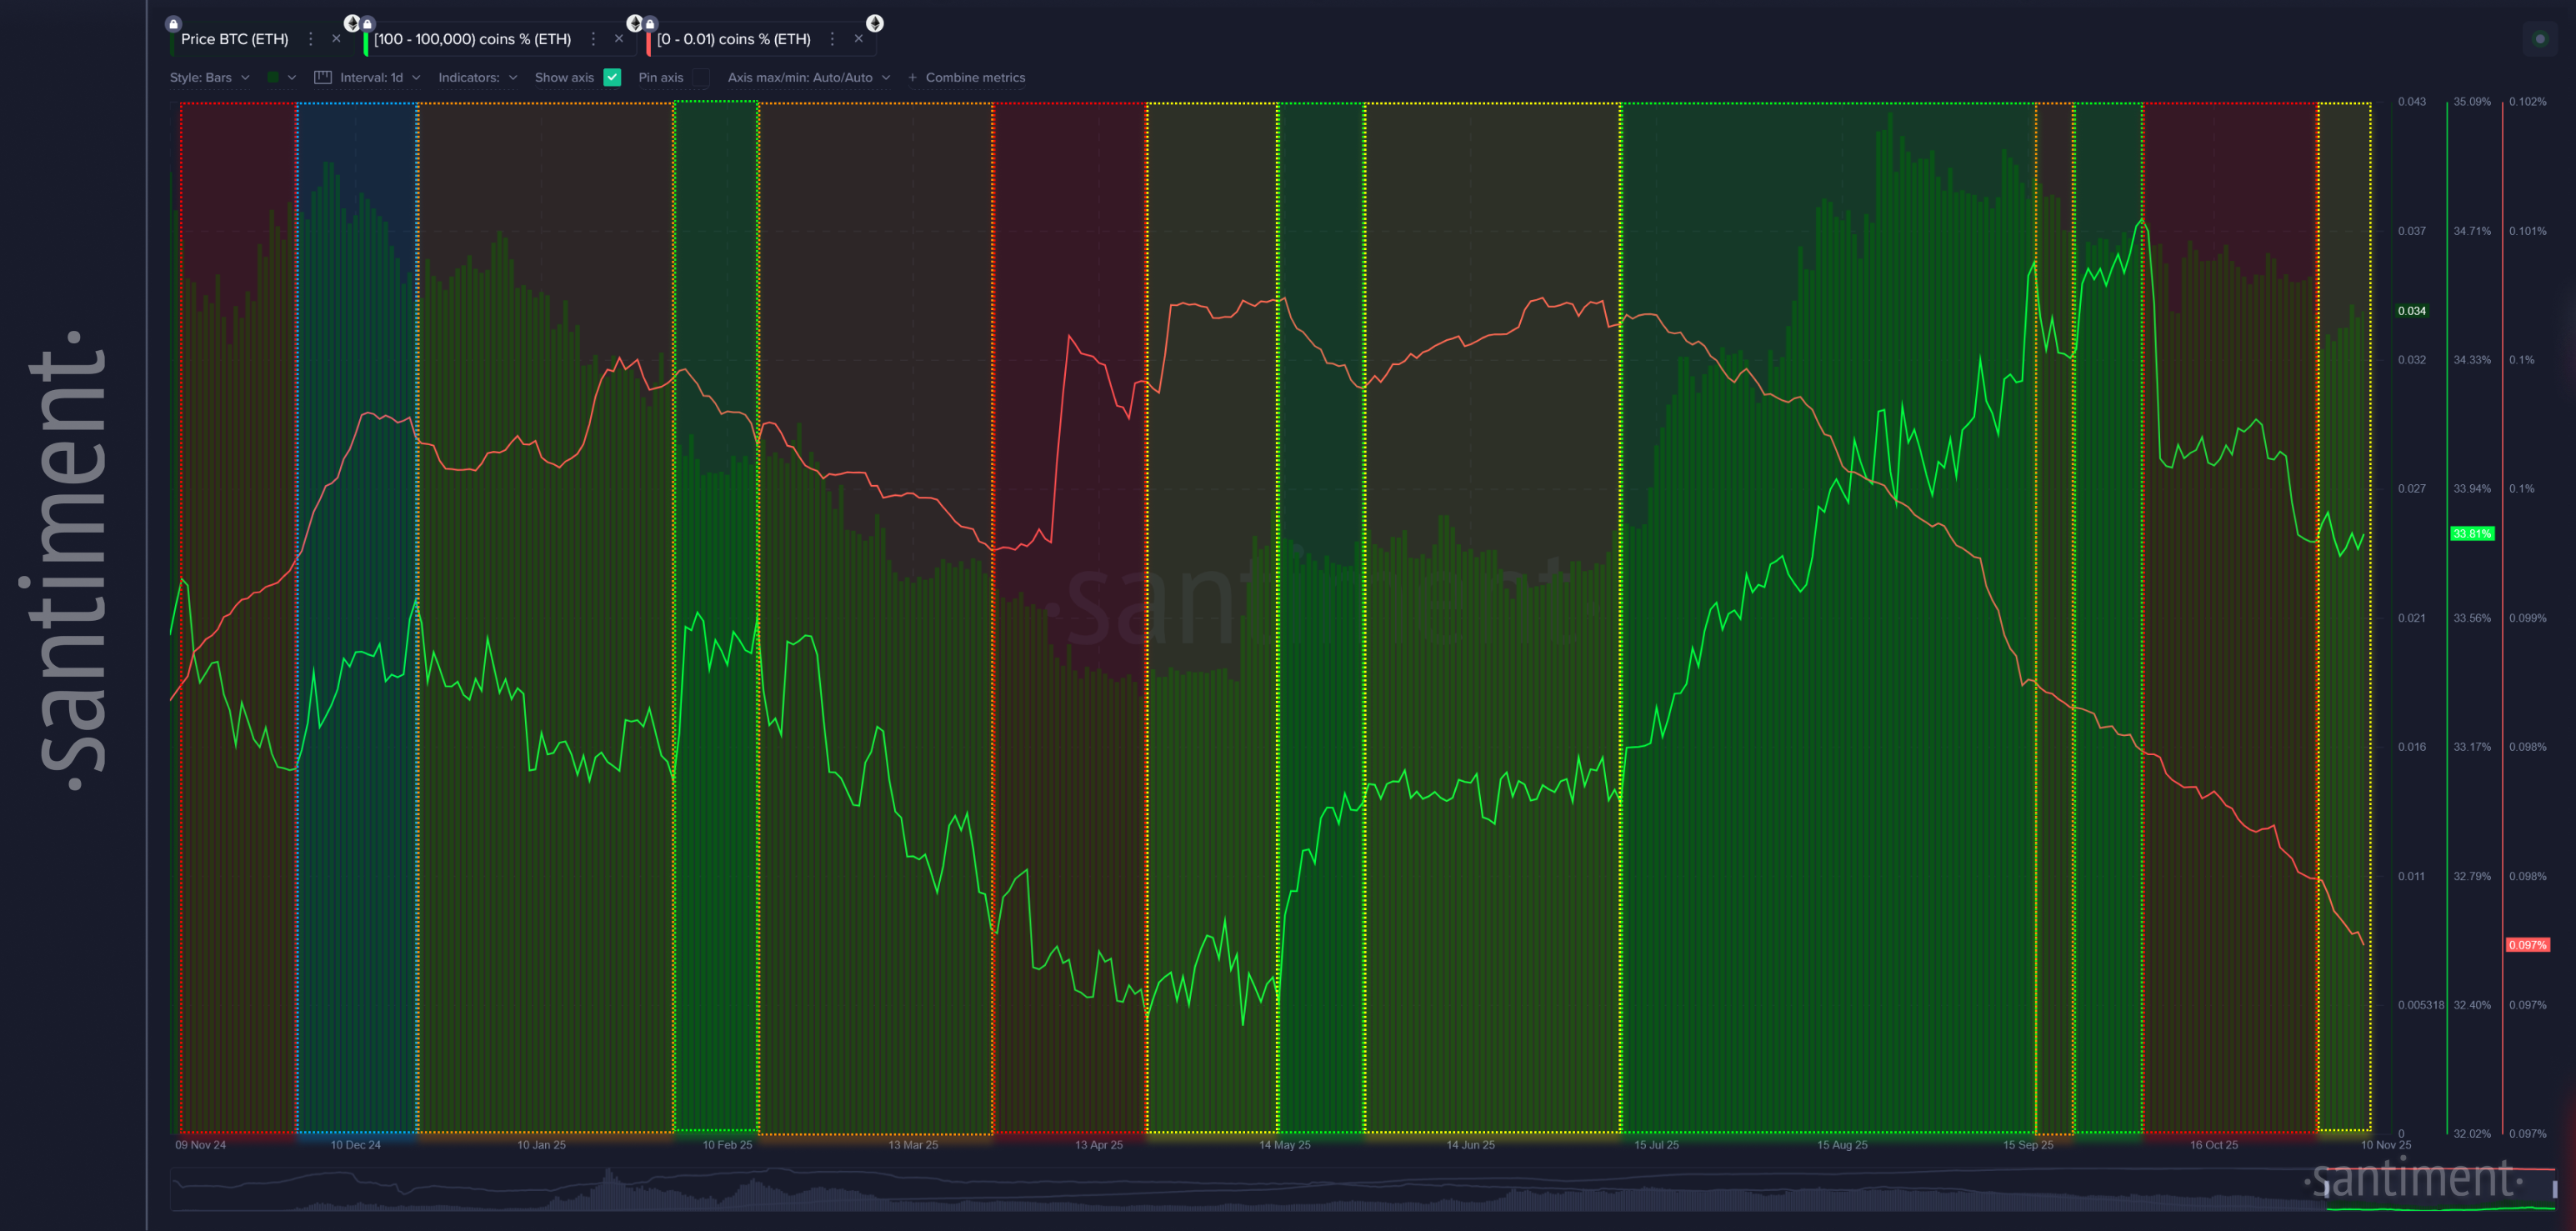
The first thing that pops out is the giant micro stakeholder (0.01 ETH or less) downswing that has been going on for about 4 months now. This isn't a fluke, though. Right when retail traders began to give up on Ethereum in late, and their bags began to freefall, that's when major key stakeholders (100-100K ETH) went on an incredible accumulation rally, and Ethereum's price jumped ~+87% between late June and late August.
For the most part, outside of the very beginning of this chart in November, 2024, the red zones do correlate with price dumps pretty consistently. The orange zones for Ethereum actually are very reliably correlated with downswings as well. The yellow and blue zones are a bit inconsistent, as expected. And the aforementioned major green zone tells you everything you need to know about how impactful the #2 market cap coin's key stakeholders can be on its price.
And though we aren't going to go through all six coins on this already lengthy deep dive, we will analyze XRP Ledger's key and micro stakeholders as well. Remember that Bitcoin, Ethereum, XRP, Cardano, Wrapped Ethereum, and Lido Staked Ethereum are all available on the chart template for you to keep tabs on and do your own analysis any time, though!
XRP Ledger (XRP)
XRP has had its struggles reaching new market cap heights in the second half of 2025. And what really stands out in its color-coded chart below is the relentlessness of retail traders. Wallets holding less than 0.1 XRP have continued to accumulate ever since its 7-year price high above $3.62 in July.
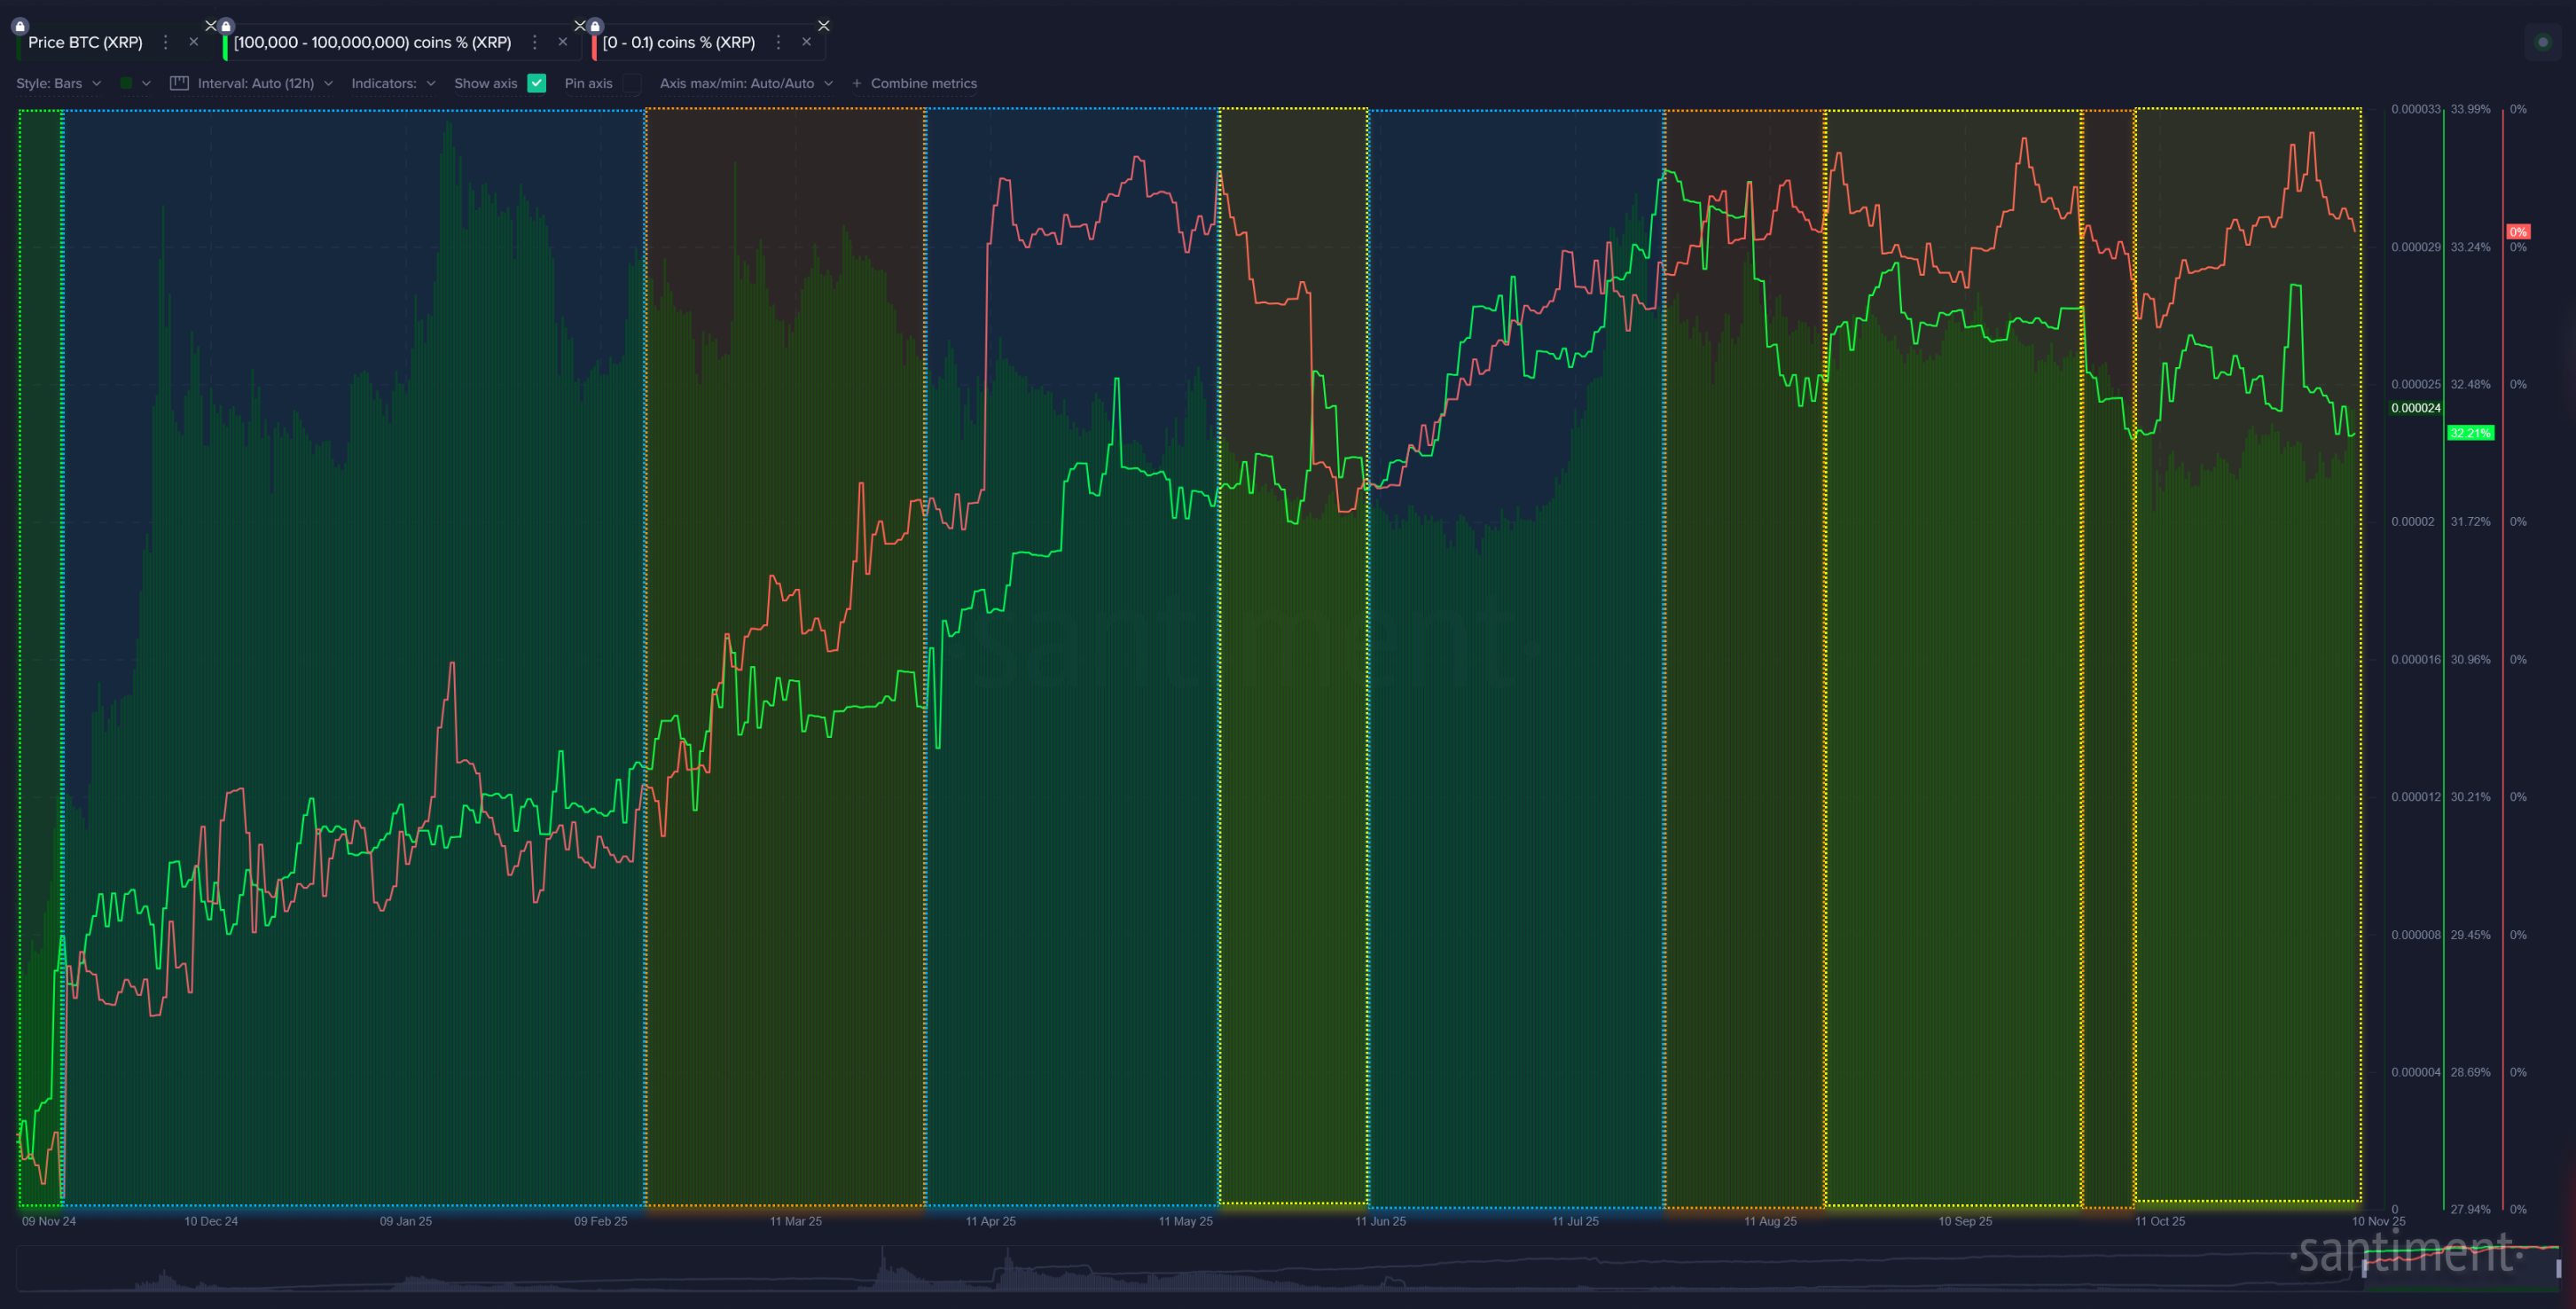
And arguably, the continued retail FOMO is part of the reason we really haven't seen a lot of green (ideal condition) zones, representing key stakeholder accumulation combined with retail FUD, since late November, 2024.
Nevertheless, we've seen plenty of long-standing blue zones, thanks to plenty of whale and shark accumulation throughout the past year. But against the price of Bitcoin, XRP was only able to capitalize on one of those three blue zones, interestingly. What will ultimately be telling is whether the micro stakeholders finally begin to capitulate and temporarily sell off their coins after a disappointing stretch of months for the #4 market cap.
Conclusion
This is definitely the kind of exercise we plan to explore further, and we can continue to post our findings as we study more altcoins and see how Bitcoin's all-important key and micro stakeholders make their next moves. The correlation of Bitcoin's key wallets seems to be most prominent by far, and this should be no surprise. We have long studied the wallets holding between 10-10K BTC to see how these whales and sharks cause fluctuations throughout all of crypto. But with the addition of measuring their ongoing relationship with micro wallets, the sky may be the limit... especially if we can begin to algorithmically automate some of these buy and sell zones. Let us know what findings you have!
-----
Free two-week trials to Sanbase PRO (to access all mentioned Santiment data in this article, and plenty more) are AVAILABLE HERE!
-----
Disclaimer: The opinions expressed in the post are for general informational purposes only and are not intended to provide specific advice or recommendations for any individual or on any specific security or investment product.