Deep Dive: Checking in On the RISING ETF Activity For BTC, ETH, and SOL!

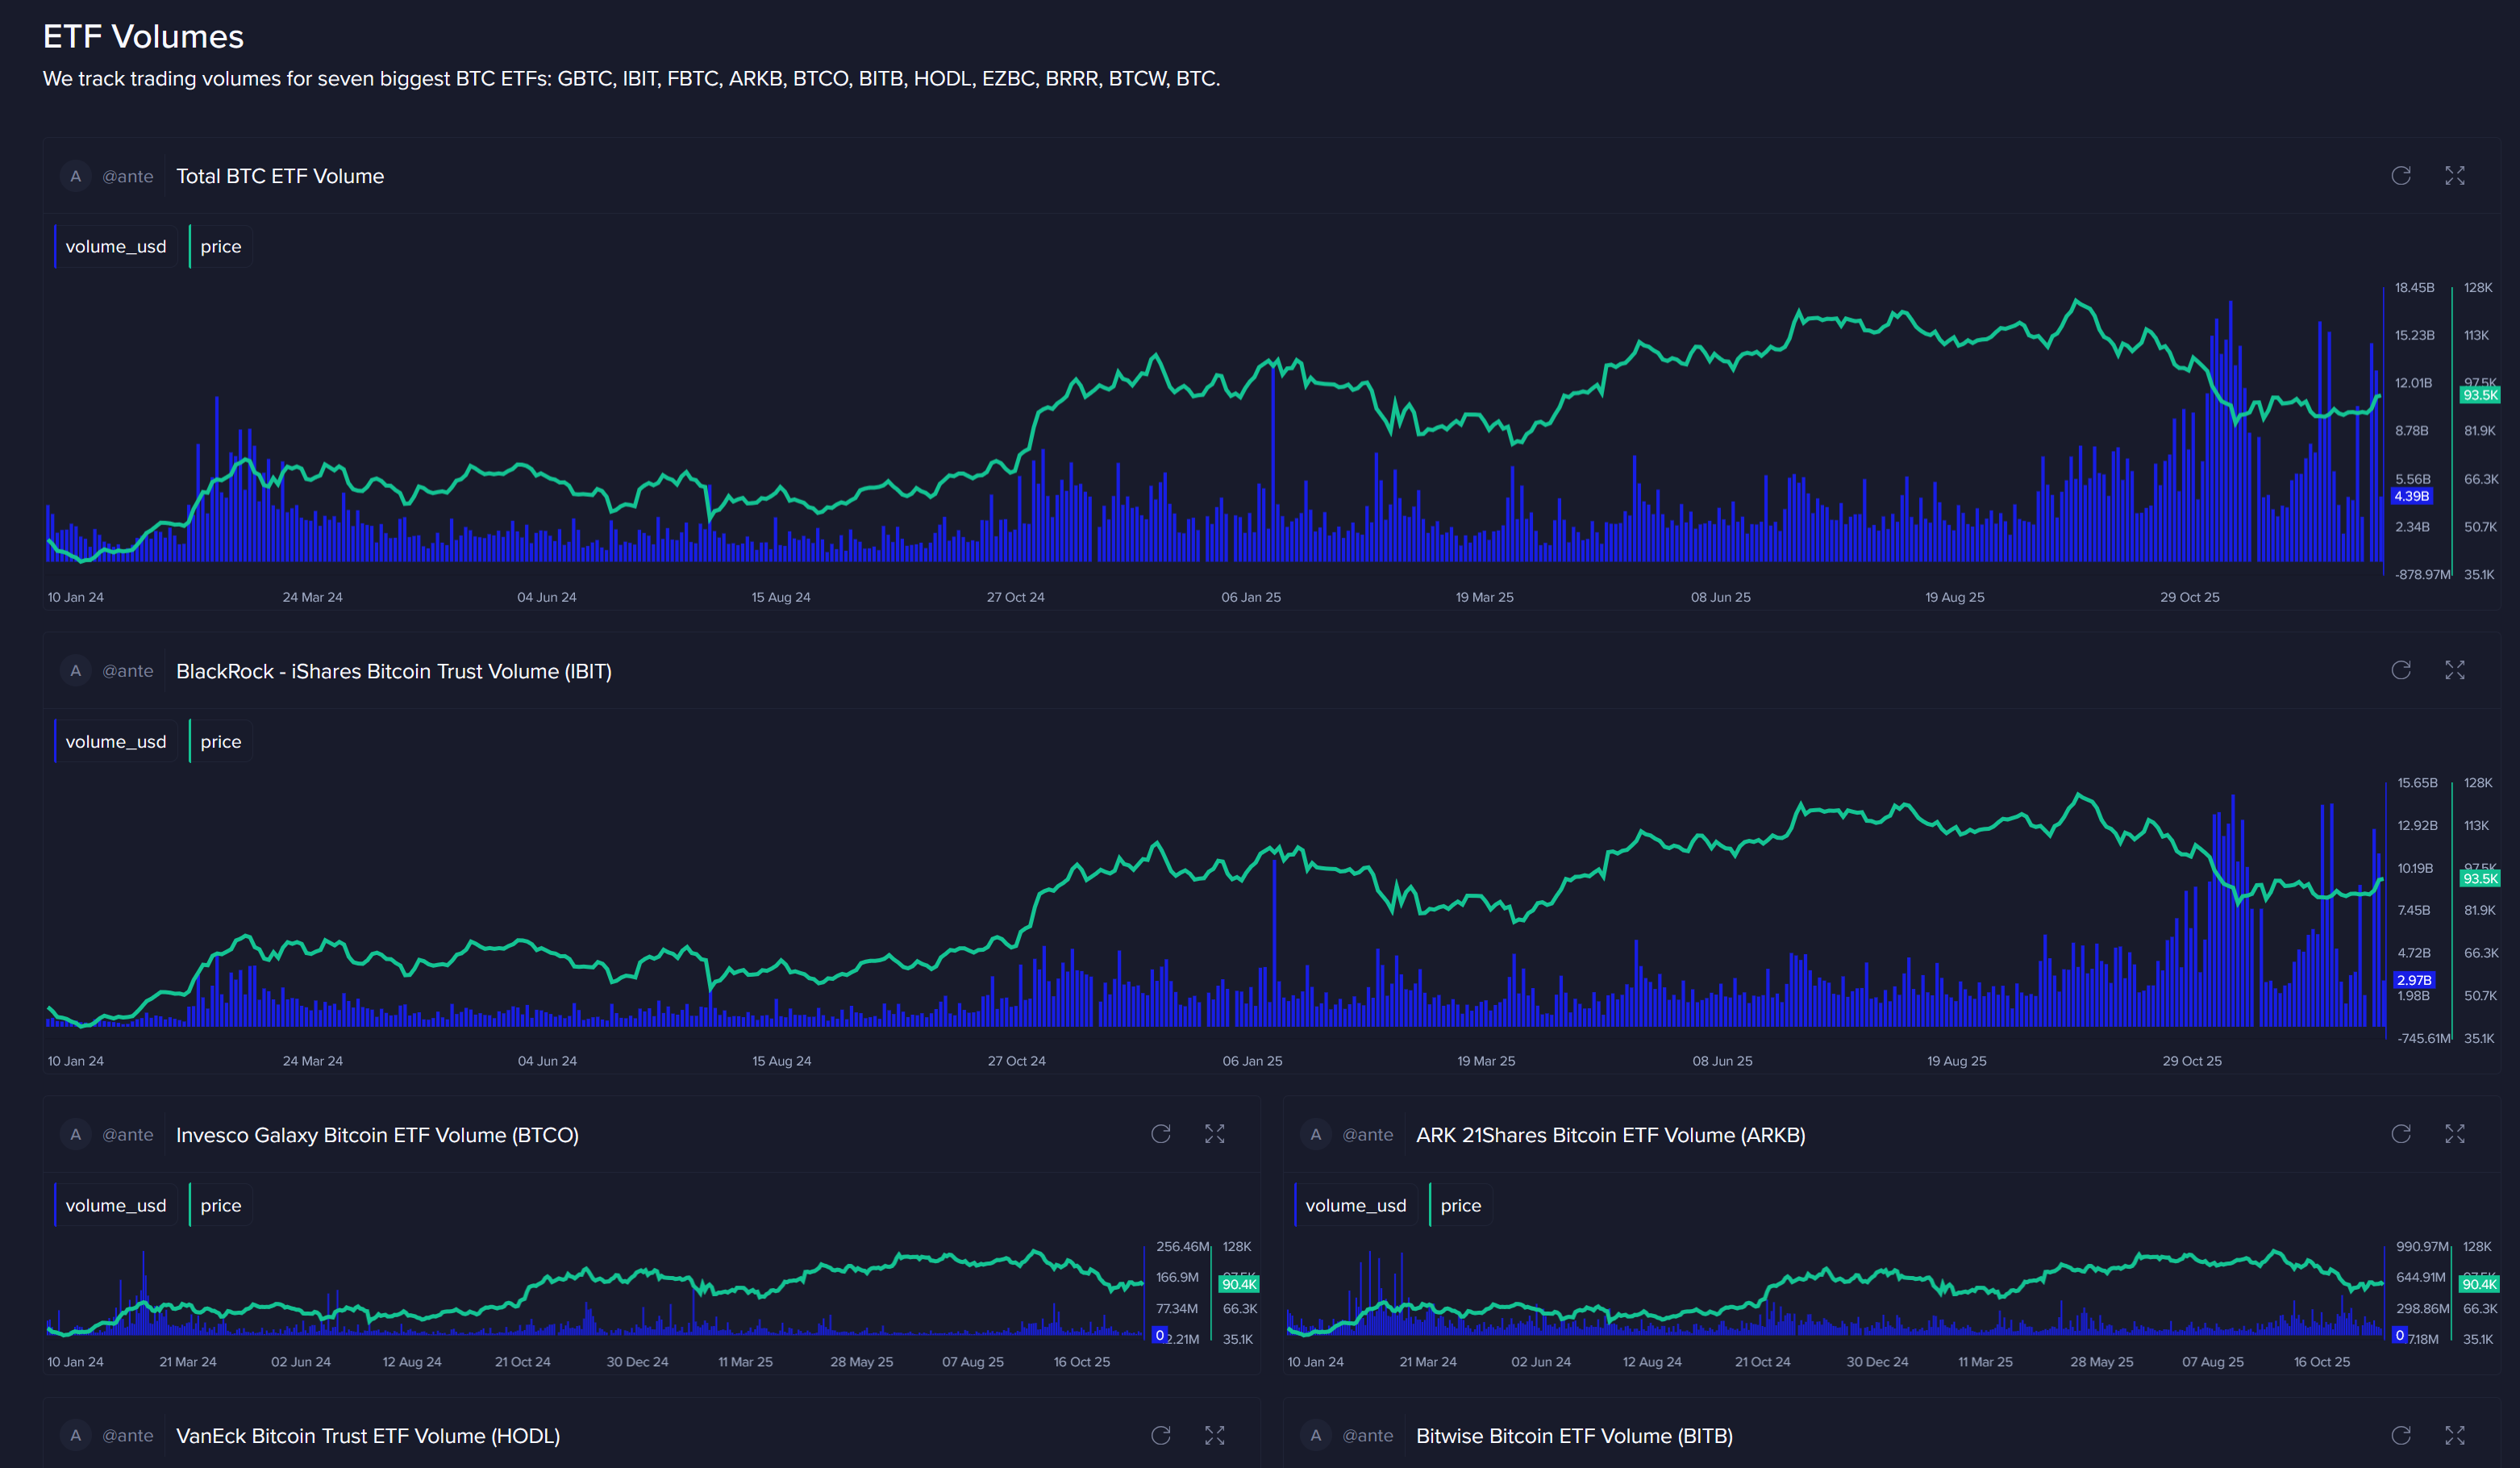
Have you checked out Santiment's Bitcoin, Ethereum, and Solana ETF dashboard yet? This fantastic daily updating tool provides you with the total ETF volume for BTC, ETH, and SOL, as well as for each individual ETF from them. We have data for each coin dating back to:
- Bitcoin: January 10, 2024
- Ethereum: August 18, 2024
- Solana: October 27, 2025
Spikes in ETF trading volume are important because they signal a sudden increase in investor interest or urgency. When volume jumps, it usually means new information has entered the market, such as geopolitical news, economic data, or a general shift in sentiment due a support or resistance level being breached. High volume shows that many buyers and sellers agree that prices at that moment are worth trading, which makes price moves more meaningful. A price move on low volume can be weak or misleading, but a price move on high volume suggests stronger conviction and a higher chance the move continues.
In theory, rising volume can push prices up or down depending on which side is more aggressive. If buyers dominate during a volume spike, prices tend to rise as demand outpaces supply. If sellers dominate, prices fall as supply overwhelms buyers. For ETFs specifically, heavy trading can also trigger the creation or redemption of shares by authorized participants, which helps keep the ETF price aligned with the value of its underlying assets. This process can amplify short-term price movement but usually improves long-term price stability by preventing large, lasting mis-pricings.
However, we have seen more than enough instances where sudden major spikes in ETF volume have marked clear price tops. And these have been incredibly valuable trading signals.
BITCOIN ($BTC)
Take, for instance, this notated chart of BTC's 2 years of ETF volume data:
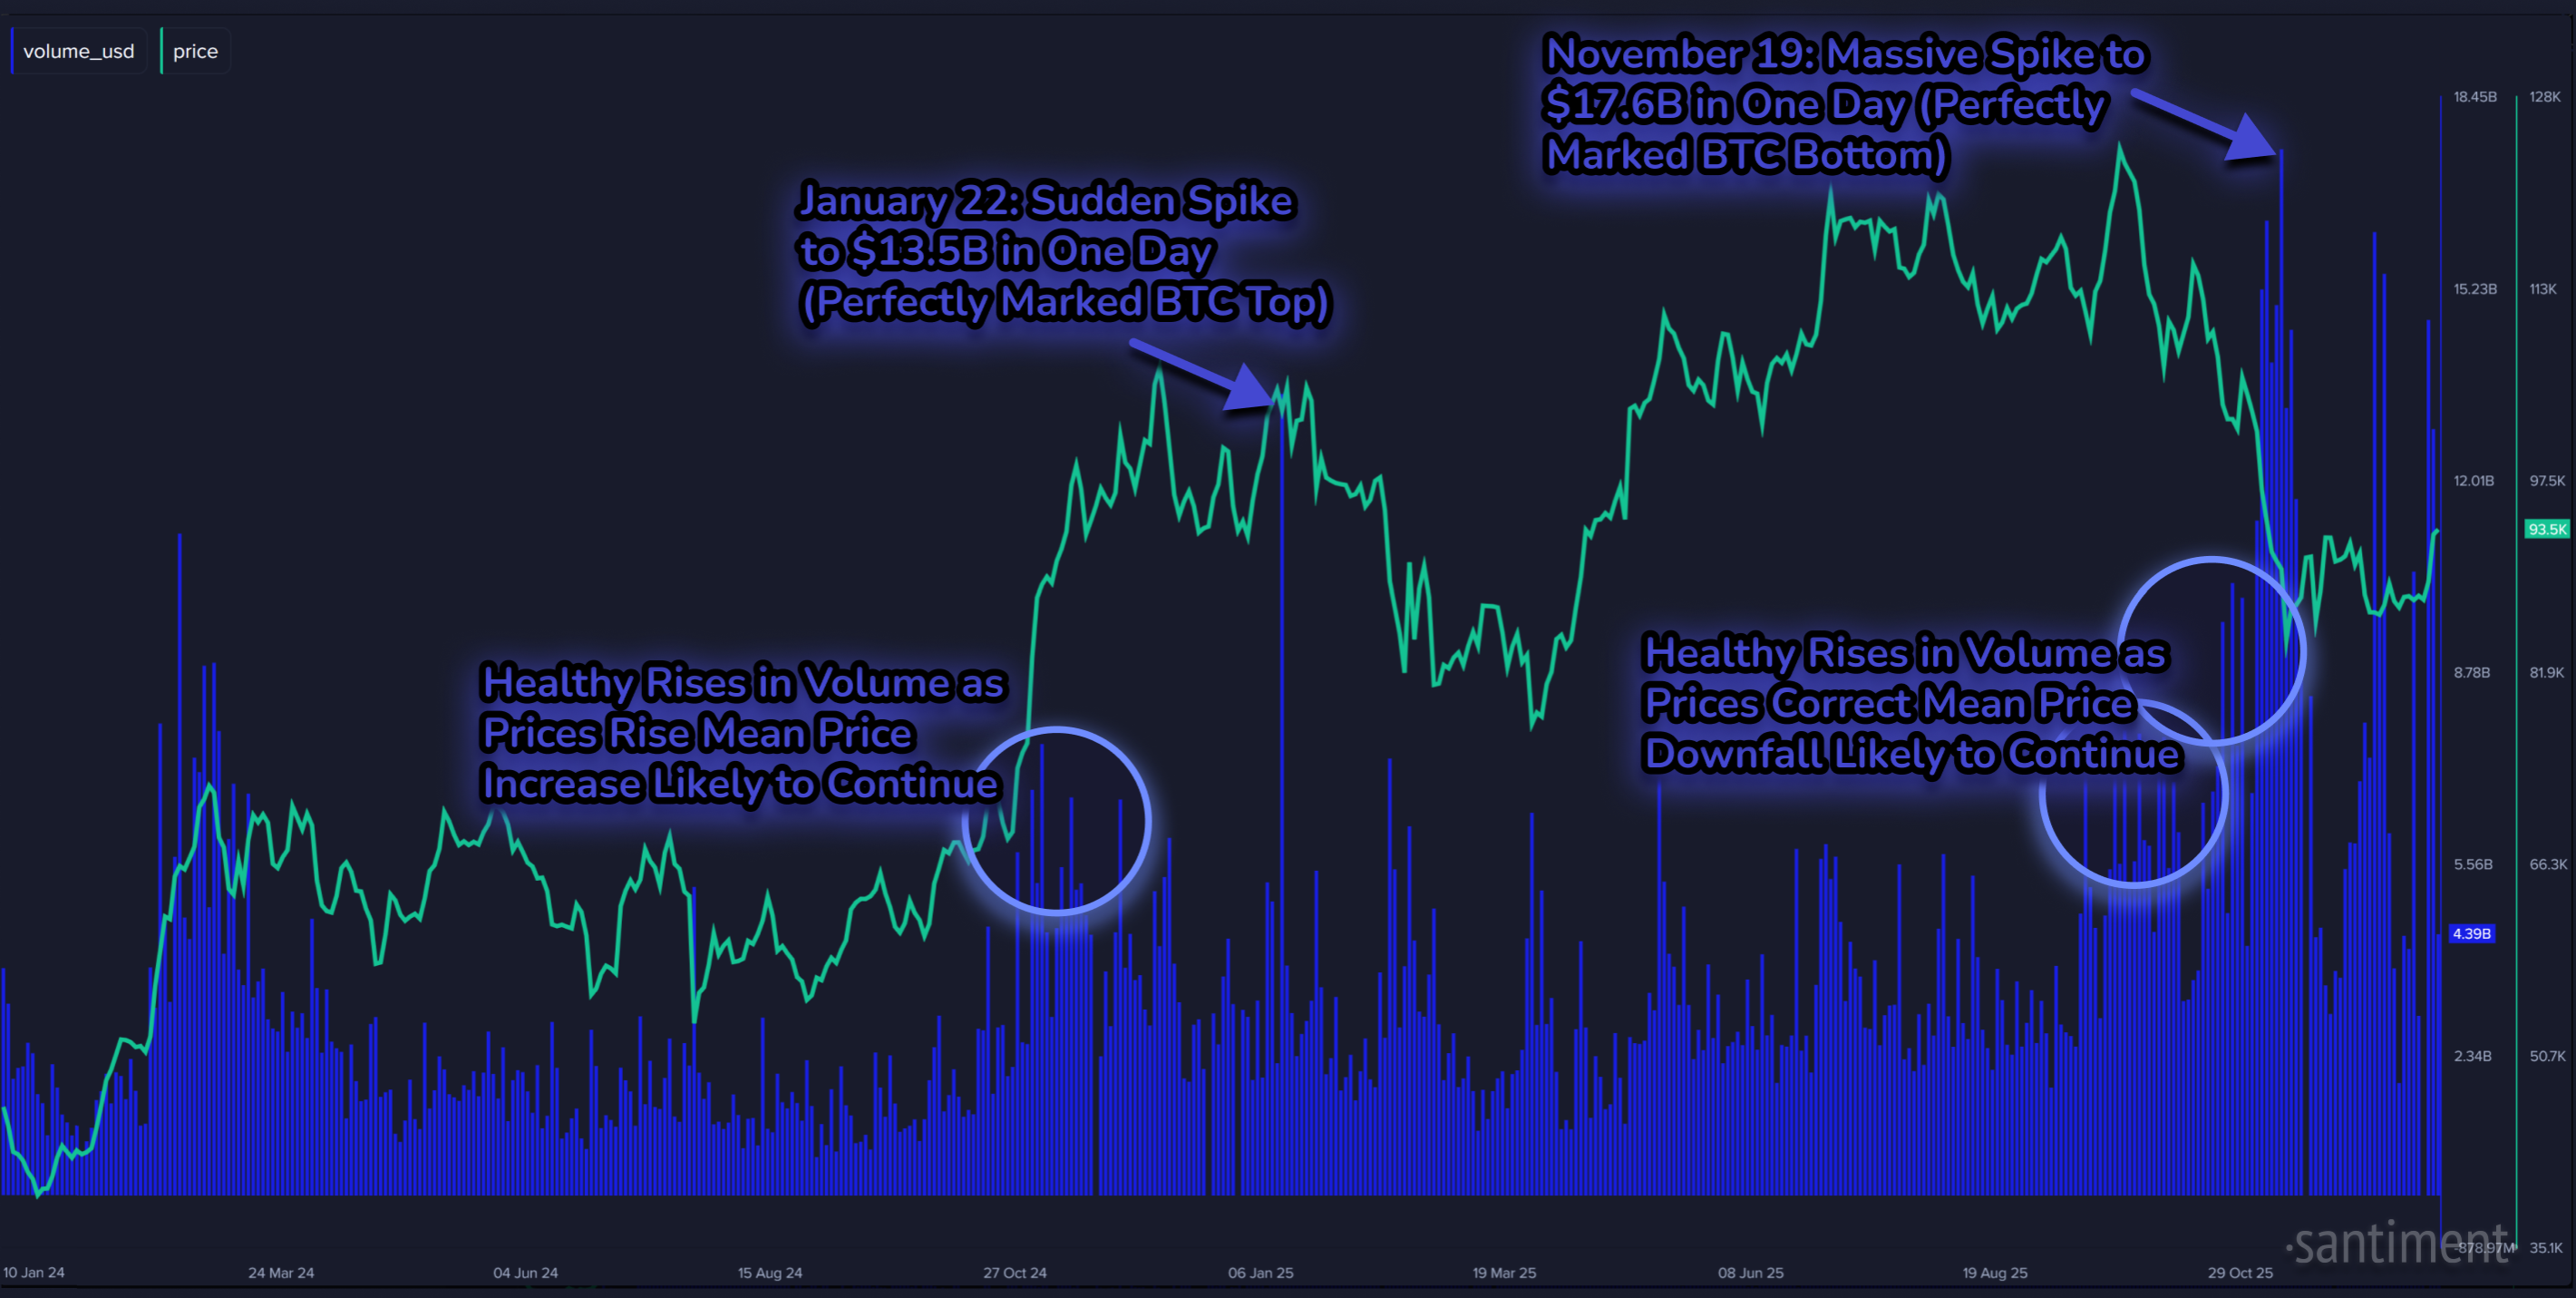
With Bitcoin, we now have two years worth of data to help us understand what a meaningful volume rise is vs. a major anomaly. And there are big differences between a:
- Healthy rise in volume (reflecting natural increased crowd interest, supporting a price move)
- Major sudden spike in volume (reflecting irrational moves or huge transfers of money, marking a potential reversal to the price move)
We can see that there was healthy volume rises leading up to the January 22, 2025 major spike of $13.5B in volume. This was an example of the healthy volume supporting the continuation of a price rise, followed by the big spike ending the cycle (and starting a price drop).
And similarly, we saw healthy volume rises leading up to the November 19, 2025 major spike of $17.6B in volume. This was an example of the healthy volume supporting the continuation of a price drop, followed by the big spike ending the cycle (and starting a price rise).
ETHEREUM ($ETH)
In the case of Ethereum (and any other altcoins, for that matter), price correlation with volume needs to be taken with a grain of salt. Bitcoin's own price performance has always dictated the direction of every other cryptocurrency to an extent, and this likely isn't changing any time soon. But we can still see some patterns over time.

Similar healthy volume rises support rallies, while the anomaly spikes appear to crush all the momentum. Also, notice on the right side of the above graph just how much Ethereum's ETF volume has picked up over the past month. It's even more extreme than the proportionate rise in Bitcoin's volume in the same time period.
It is still somewhat unexplored territory when we see a sustained period of massively heightened volume. Outside of the August 21st anomaly, January 2nd and 5th of this year have been the highest days of Ethereum ETF volume of all time.
A sustained rise in Ethereum ETF trading volume over several weeks likely points to growing, steady interest rather than a short-term emotional reaction. Unlike single-day volume spikes that often show panic selling or late buying near a top, consistent high volume suggests institutions and long-term investors are actively positioning themselves. This kind of activity can mean the market is going through a transition phase, where ownership is shifting and price is finding a stronger base. While it does not guarantee higher prices on its own, it theoretically signals that Ethereum is becoming more liquid, more widely held, and more sensitive to future catalysts, which can lead to larger and more decisive price moves later on.
SOLANA ($SOL)
Last but not least, we take a look at Solana. With only about 10 weeks of data thus far, it's a bit short-sighted to look for anomalies in such a short sample size. But it's pretty hard to deny what we're seeing on the SOL ETF volume chart just today:
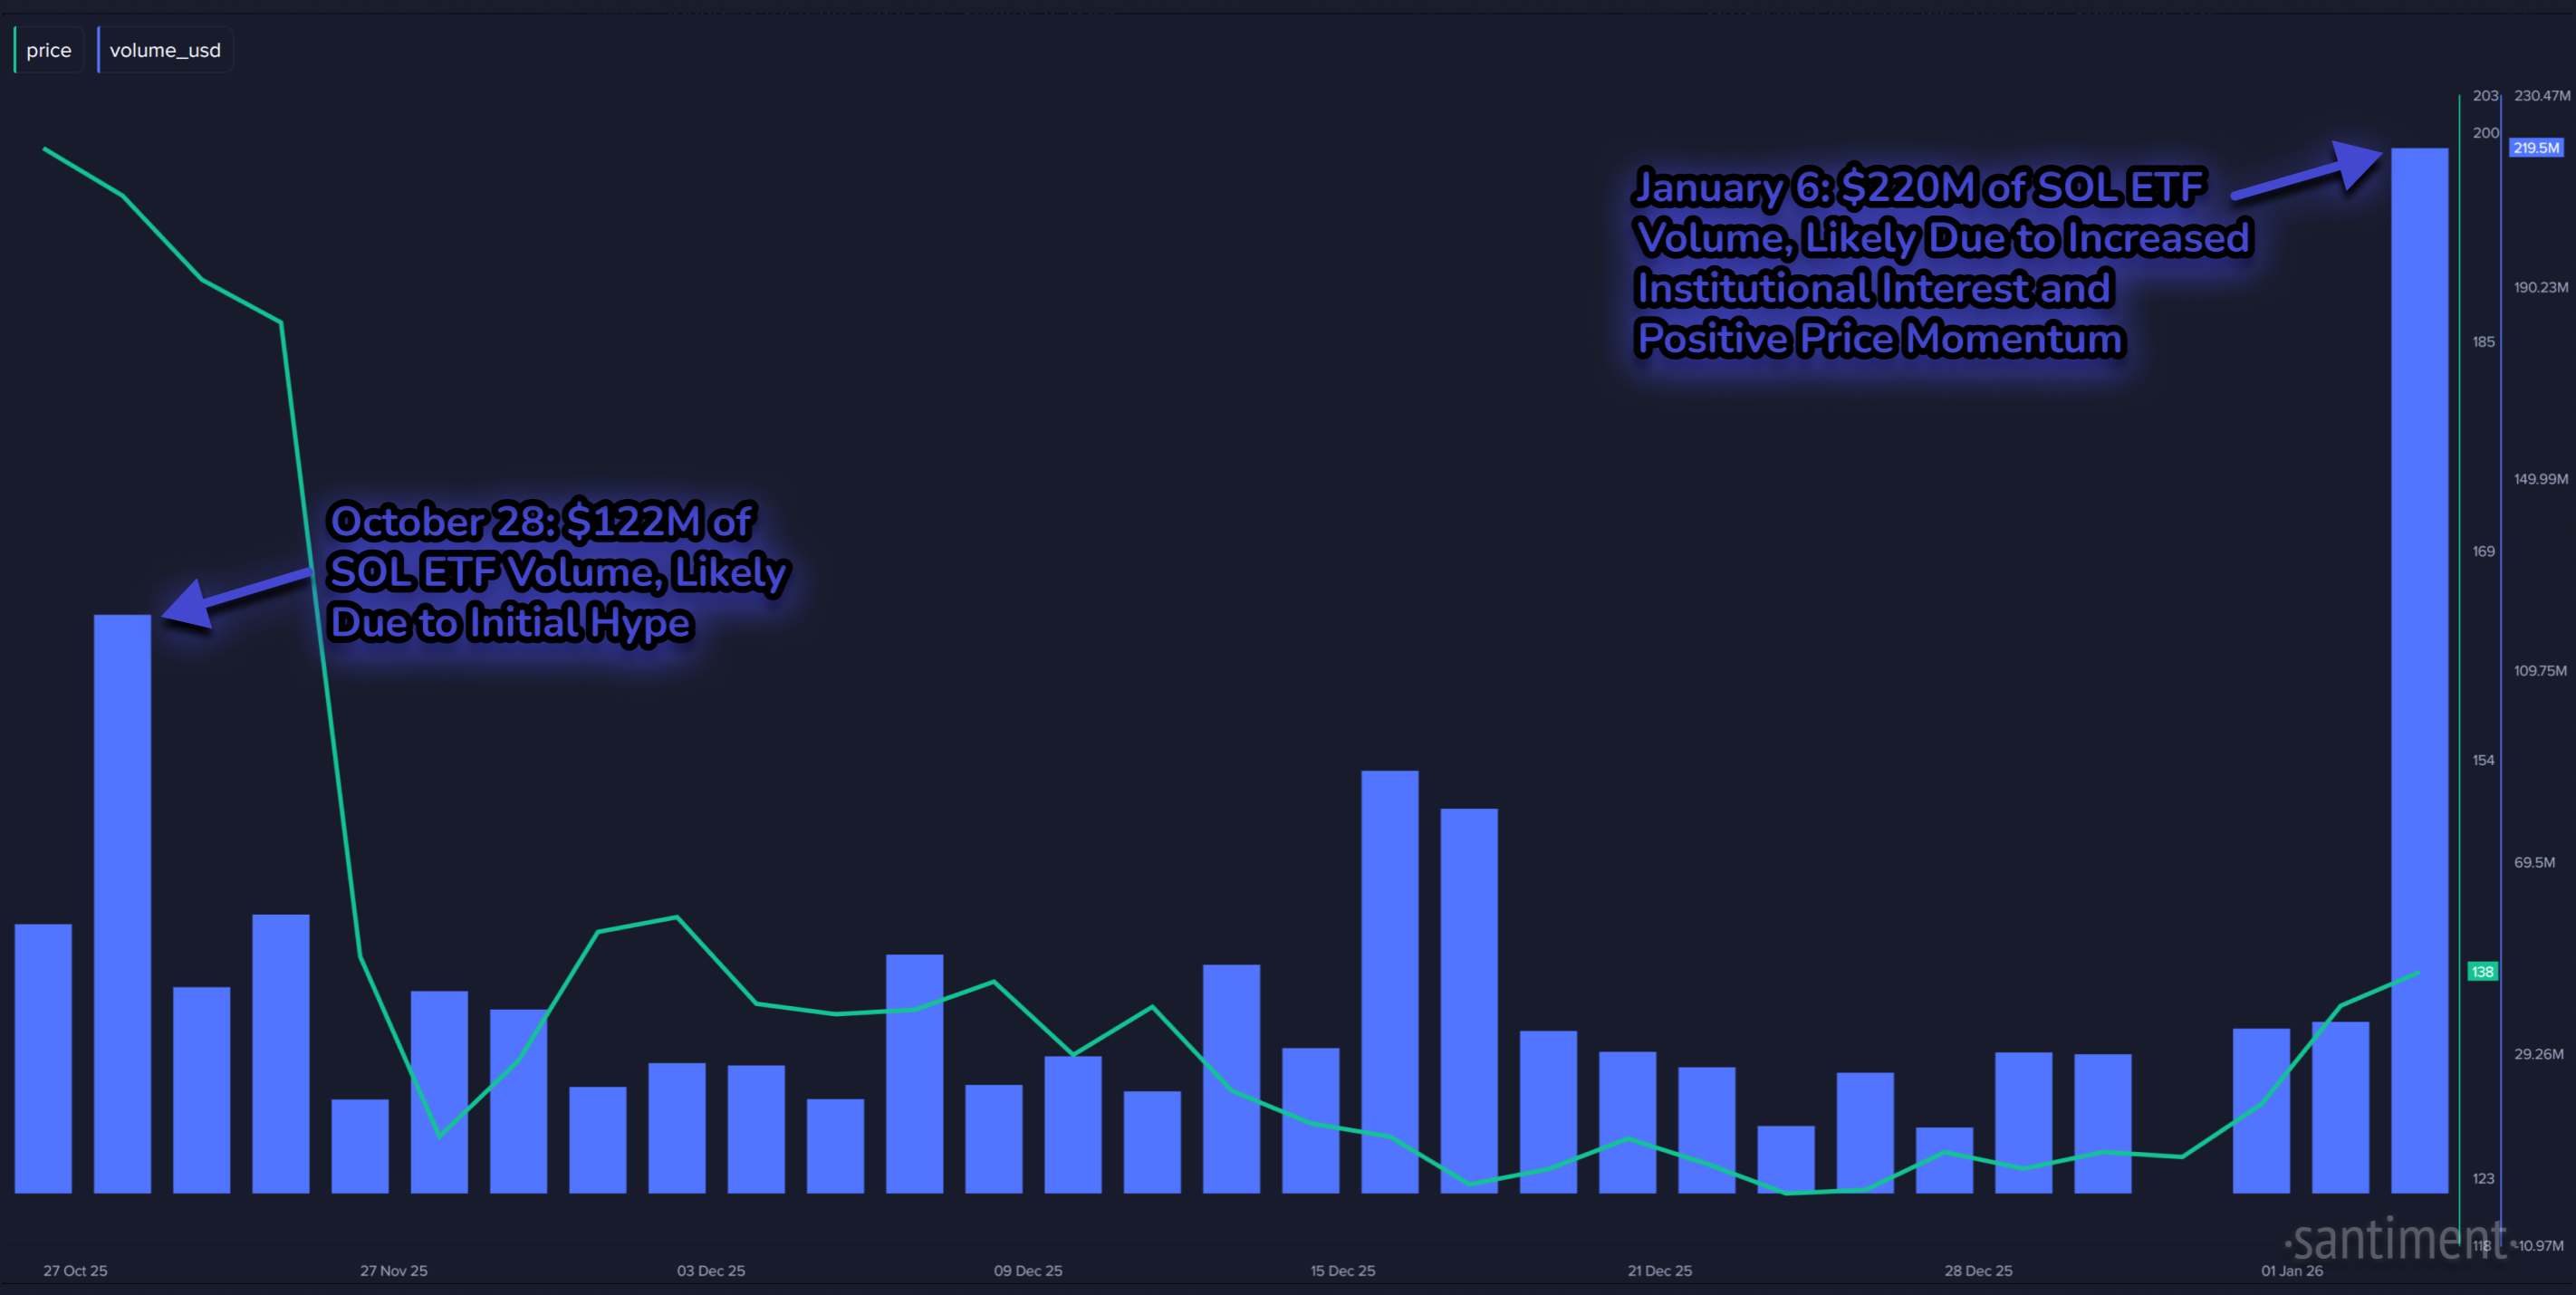
$220M of trading volume has poured in to Solana ETF's, when the previous record was a mere $122M on the second day of the ETF's being publicly available. It's quite the contrast, and clearly shows that some major money is suddenly showing major interest in the SOL rally as it crossed back above $140 today for the first time in four weeks.
For brand-new ETF's like Solana’s, large volume swings can carry more meaning than they would for older, more established products. With only a short trading history, each surge in volume helps shape how the market values and uses them. Early spikes often come from launch excitement (just like we saw for Bitcoin & Ethereum), but later record-breaking days suggest something more deliberate. When volume expands as price moves higher, it points to stronger participation rather than thin trading, which can help reduce volatility over time. In this early stage, rising volume may be a sign that the ETF is gaining credibility, liquidity, and repeat buyers instead of being driven purely by short-term speculation. As mentioned, however, this small sample means it's difficult to decipher whether today's $220M spike IS the anomaly... or if it's just the start of rising volume that could be the new normal for crypto's #6 ranked market cap.
Solana’s rally at the start of 2026 also appears to line up with growing institutional attention and shifting narratives in the broader crypto market. As capital rotates beyond Bitcoin and Ethereum, institutions often look for networks with strong usage, fast transaction speeds, and active ecosystems, all of which have been key parts of Solana’s story. Positive headlines, renewed developer activity, and improving risk appetite across markets can reinforce this interest at the same time. When institutional flows and favorable news move together, price gains tend to look more controlled and sustainable, rather than driven by hype alone.
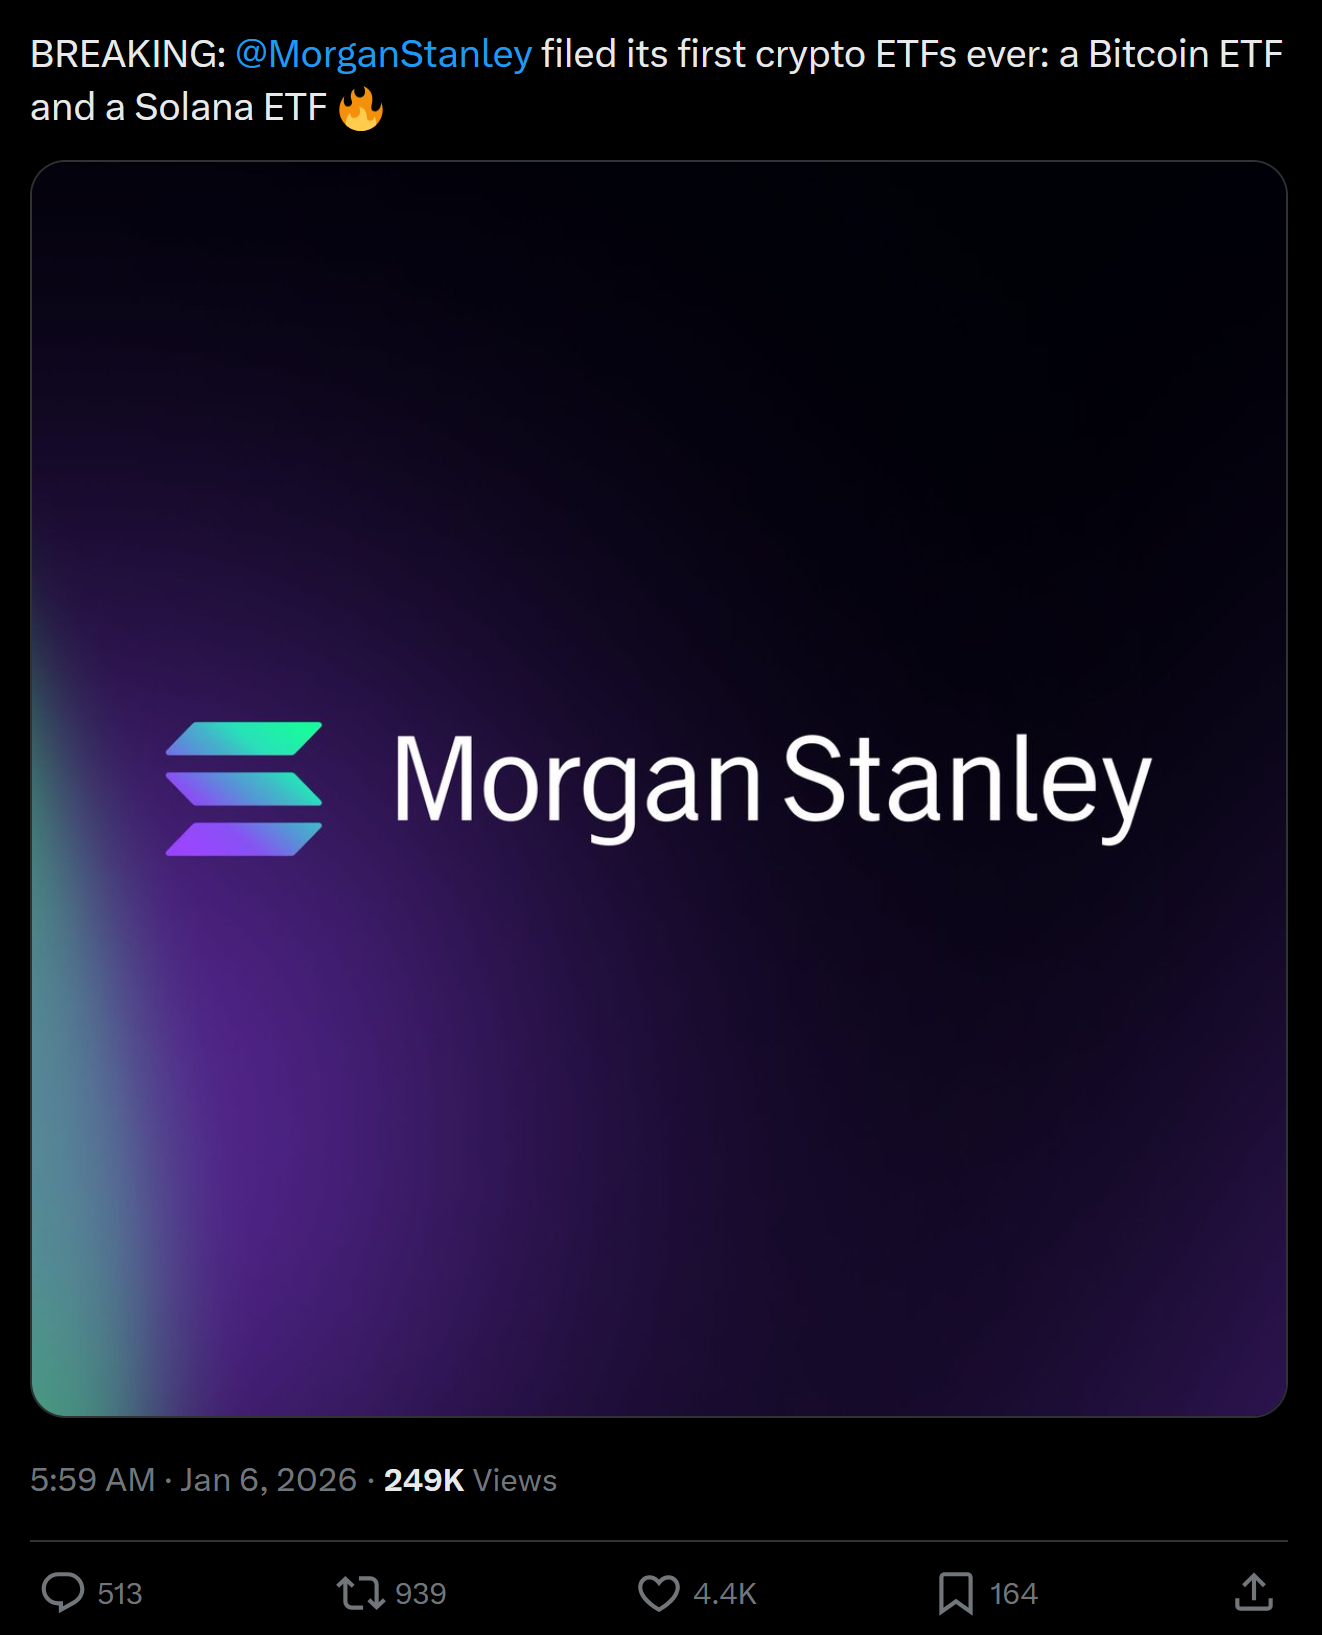
Solana’s strength in early 2026 has come alongside several concrete signals that larger players are paying closer attention. Institutional interest has been boosted by the launch and growing volume of Solana-linked ETFs, which give funds and advisors a regulated way to gain exposure without holding the token directly. More than likely, the big needle mover that caused money to pour in to the currently existing SOL ETF's was the announcement that Morgan Stanley filed for its first Solana (and first Bitcoin) ETF.
And there are still reports of other major asset managers expanding crypto product offerings beyond Bitcoin and Ethereum, which have helped bring Solana into more serious allocation discussions. Solana has benefited from headlines around rising on-chain activity, strong NFT and DeFi usage returning to the network, and continued improvements to network stability after past outages.
---
So by all means, explore Santiment's groundbreaking dashboard and tell us what findings you've spotted. Do you see trends within individual ETF's for any of the three assets? Are there hints that ETF's will become more and more of a "signal" for market prices as time marches on? Let us know your thoughts!
-----
Free two-week trials to Sanbase PRO (to access all mentioned Santiment data in this article, and plenty more) are AVAILABLE HERE!
-----
Disclaimer: The opinions expressed in the post are for general informational purposes only and are not intended to provide specific advice or recommendations for any individual or on any specific security or investment product.