The Weekly Anomaly Report: September 9th – 16th


A token suddenly dominating crypto Twitter, whales dumping ETH, price spiking while network usage flatlines — you get the gist. We call these anomalies, and they often lead to trading opportunities.
This week we lead with the setups worth acting on, give you the market backdrop they sit against, and grade how last week’s calls actually played out. Let’s dig in!
This Week in Brief
- Raydium, RAY: doubled in nine days while the people actually using it grew 2%.
- Telcoin, TEL: 5.4% of supply woke up on the exact day price peaked, and it has fallen 21% since.
- Ethereum Classic, ETC: down 17% off its high with no news, and the small crowd barely reacted.
Market Backdrop
Risk came off. Bitcoin slipped from $78.3K on September 9 to $75.6K by September 16, about -3.4%, with the low on September 15. Ether did much the same, easing from $2,467 to $2,388, roughly -3.2%. Nothing dramatic, but the first clearly negative week since the August run-up.
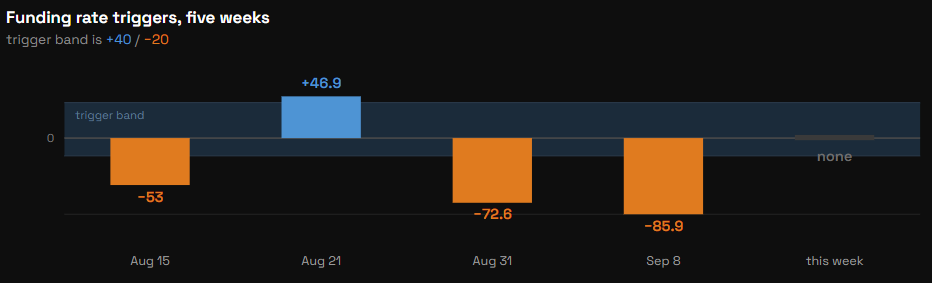
'hyperliquid_avg_funding_rate' went silent. After four consecutive weeks of triggers — -53, +46.91, -72.58, and -85.91 — it produced nothing at all this window. That last reading was the most extreme short positioning we had recorded, and this time there was no squeeze. The crowd shorting alt-coins was simply right, and the positioning unwound into a falling market rather than against it.
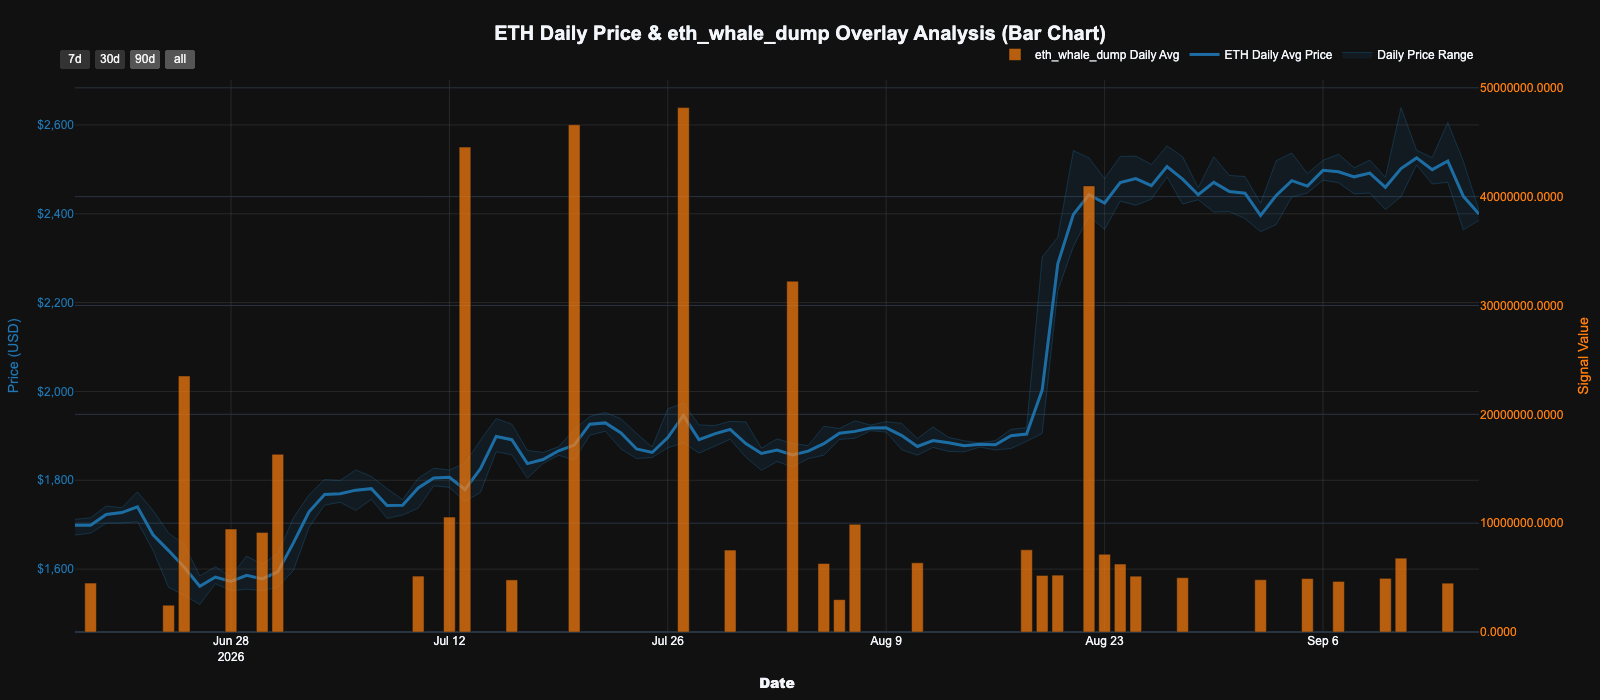
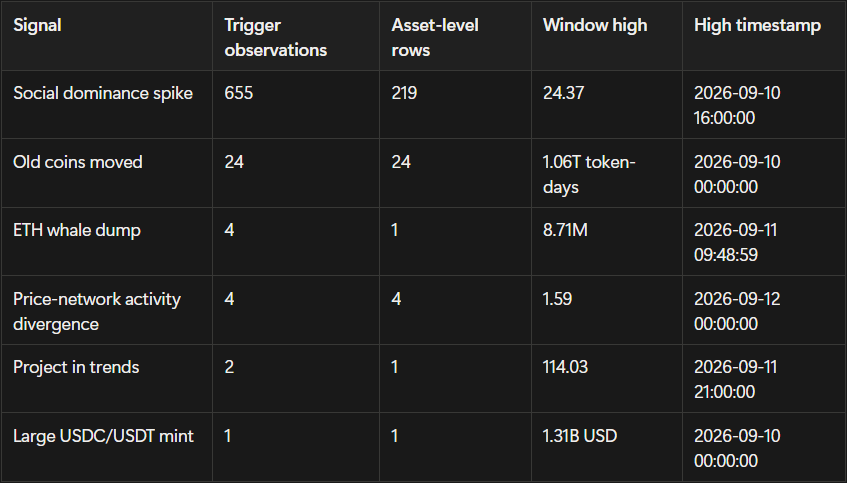
Large ETH holders picked up slightly. 'eth_whale_dump' fired four times between September 10 and 14, peaking at $8.71M on September 11 — still small by the standards of late August, when a single week produced ten events topping $40.99M.
One number stands out in the raw counts. 'social_dominance_spike' produced 655 observations across 219 assets, against 151 across 77 assets last week. Attention scattered across four times as many names in a down week, which is what a market with no clear leader looks like.
Test your trading skills, build a track record, win capital allocation from Santiment on our new platform, Score Arena — Apply for early access!
This Week’s Trading Setups
1. Raydium (RAY)
Signal: price_network_activity_divergence · Lean: Mean-reversion
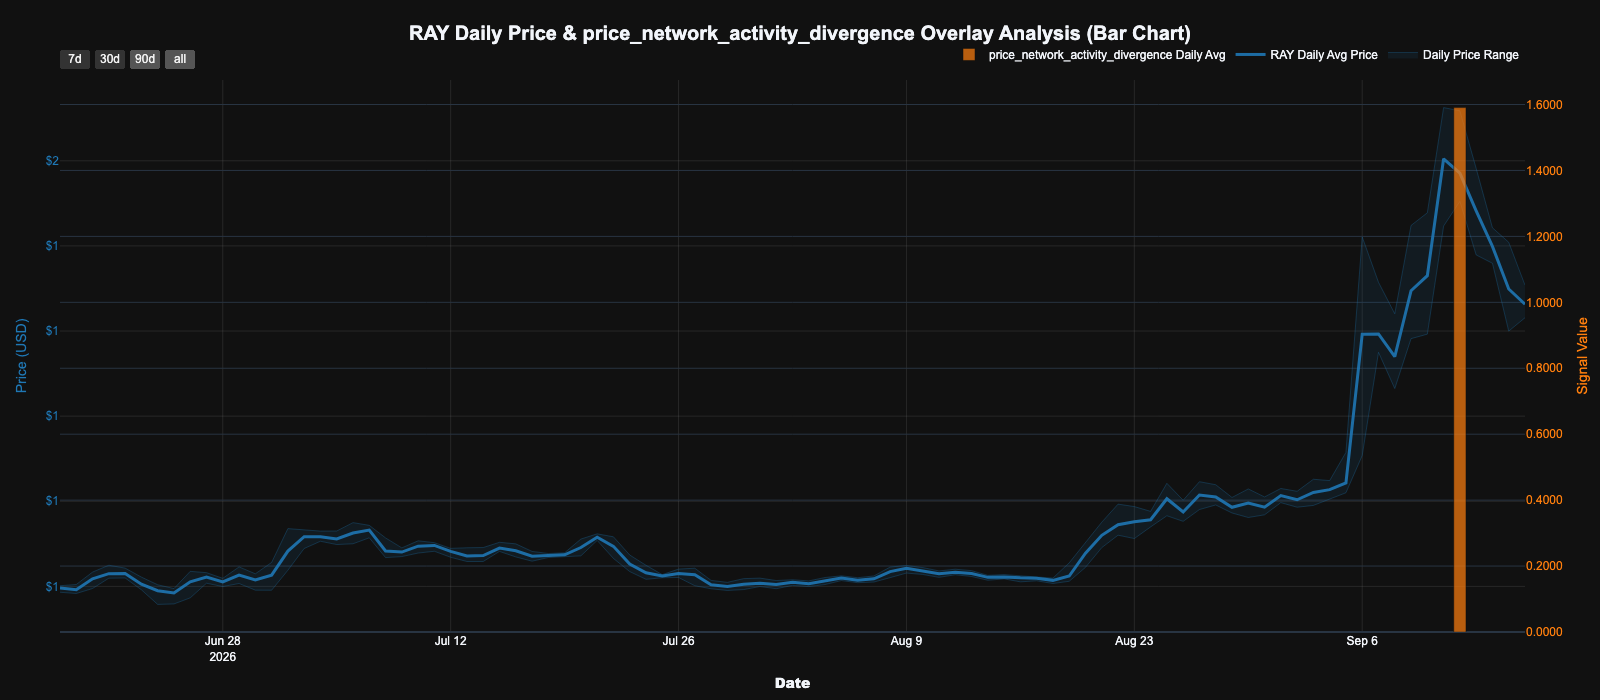
What’s anomalous. 'price_network_activity_divergence' recorded 1.59 for Raydium on September 12, the only meaningful reading of the four that fired. Market cap is about $366M.
Take a look at the two numbers behind that reading, then at the same two over the whole move. On the trigger day price rose 7.01% while daily active addresses rose 1.98% — a ratio of 3.54. Zoom out to the nine days from September 2, before the start of the major move, and it inverts: price gained 110%, from $0.798 to $1.671, while active addresses went from 4,621 to 18,318, up 296%. Users arrived nearly three times faster than price did, peaking on September 11th. What has happened since is a loss of momentum — addresses have fallen 41% from that September 11 peak to 10,727, while price has given back only 19% to $1.358.
Why. Real catalysts, which is what makes the divergence interesting rather than dismissible. Raydium listed more than 15 tokenized US stocks on Solana, including Boeing, Costco, Reddit and Roblox, tradeable around the clock through Backpack Securities. StonkFun moved all its new launches to Raydium LaunchLab, and Pump.fun added Custom Pairs so memecoins can trade against tokenized equities. On September 9 the protocol ran its largest single-day buyback, $640,788 funded from 12% of fees, taking cumulative buybacks past $2.1M.
The usage did grow. Total SOL locked on Raydium reached an all-time high near 470,817 tokens. It simply did not grow at anything close to the rate the price did, and also now it’s all cooling down from the initial hype.
What to watch. Daily volume and daily active users are the key metrics, without their growth RAY is likely to give back some gains. The buyback is also good to observe, and it scales with volume.
The takeaway: The big move cooled off and the metrics did too, but in larger fashion. We expect RAY to give back more before this settles.
Trader tip: In most cases, avoid entering long positions directly after a local price high, especially when the news that triggered it is fading.
2. Telcoin (TEL)
Signal: old_coins_moved · Lean: Short bias
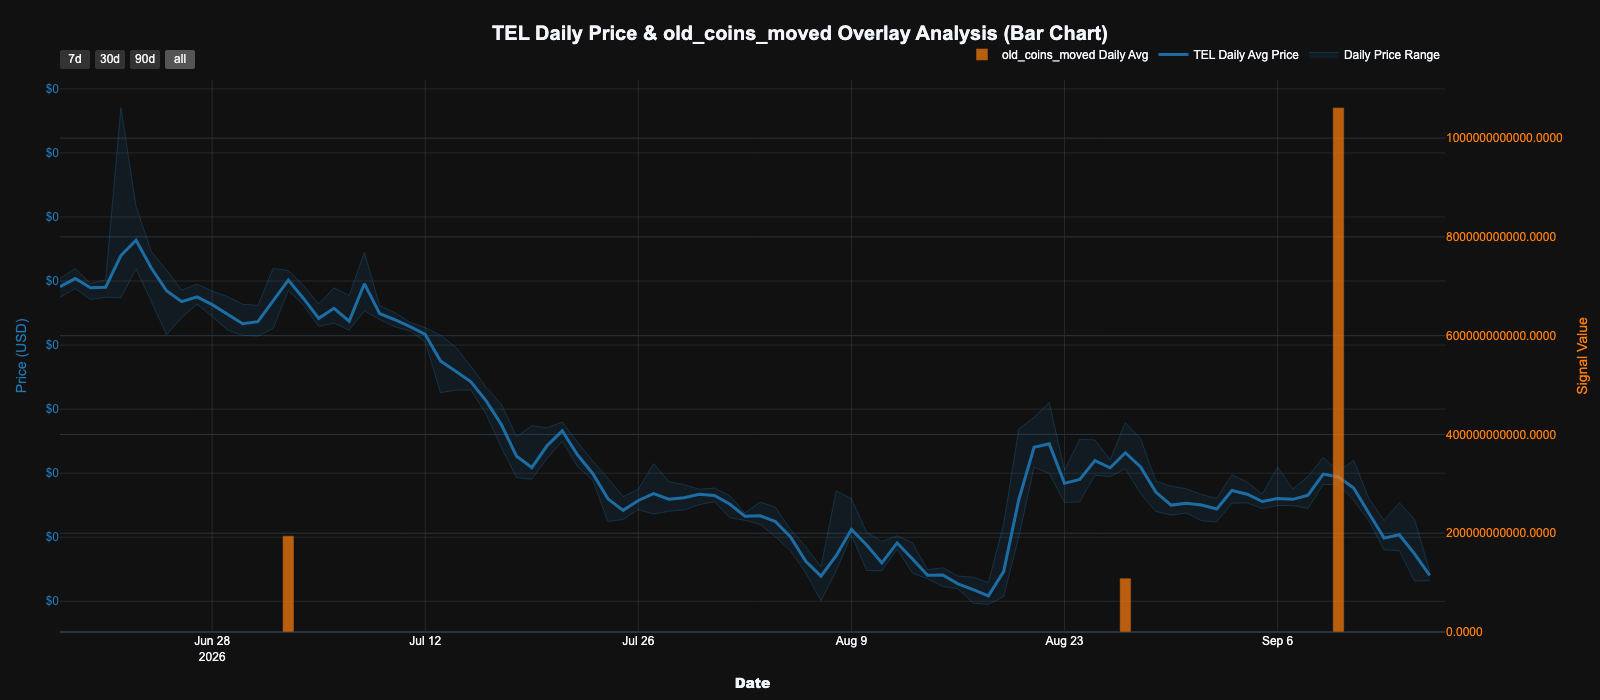
What’s anomalous. 'old_coins_moved' recorded 17.41 times its trigger level for Telcoin, and the largest raw reading of the week: about 5.4% of circulating supply moved, untouched for an average of 204 days. On-chain volume that day ran roughly 60 times the previous three days. Market cap is about $136M.
The date is the whole setup. The metric day was September 9 — the exact day TEL peaked at $0.001795. It has fallen to $0.001413 since, about -21.3%, the worst performance of any asset in this week’s tables.
Why. No clear catalyst — flagging on data alone, so treat this as lower conviction on the cause even though the price outcome is unambiguous. Nothing specific to Telcoin landed on September 9. What the data shows is holders who had been sitting for roughly seven months choosing that day, and that day being the high.
What to watch. Whether a second trigger follows. One dormant-supply event at a top is a data point; a repeat on the same asset means a position is still being worked through. Telcoin was also the largest raw reading of the week, so if those holders are not finished, there is more supply behind. ready to be sold. Also, zoom out and notice that the entire history of this token is bearish with a few hopeful price pumps in between. This should signal to you that the best bet is probably down.
The takeaway: Old holders moved 5.4% of supply on the exact day of the high, and price has lost a fifth of its value since. We expect the selling to continue.
Trader tip: treat old coins moving into a rally as old holders likely preparing to sell.
3. Ethereum Classic (ETC)
Signal: social_dominance_spike · Lean: Short bias
What’s anomalous. 'social_dominance_spike' fired four times for Ethereum Classic, peaking at 7.43 on September 13. Market cap is about $1.13B.
Price did the opposite of what the attention suggests. ETC fell from $8.02 on September 9 to $7.15 on September 16, about -10.8%, and from the $8.60 high on September 8 the decline is closer to 17%.
Take a look at what the crowd did while that happened. Sentiment balance, which nets positive mentions against negative ones, stayed negative all week but got steadily less negative: an average of -1.36 across September 9 to 11, improving to -0.56 across September 14 to 16, with the most recent four-hour reading at +4.52. The share of four-hour periods reading positive sits at about a quarter at both ends of the window. So the crowd is not turning bullish, it is just small and refusing to panic into a 17% decline with no news behind it, and capitulation is what usually marks a floor.
Why. No clear catalyst — flagging on data alone. Nothing specific to Ethereum Classic arrived this week, and the broader market fell about 3%. ETC fell three times harder than that with no news to explain it.
What to watch. Whether sentiment finally breaks down. A sharp drop into consistent and deep negative territory would mean the majority of the remaining public crowd has given up, and that would be indicative of a floor, potentially. These blockchain competitors from the past as fading away, so even after capitulation there may just be a slow bleed after that. Rebounds usually accompany assets that have something going for them, ETC doesn’t seem to have much going on.
The takeaway: A 17% fall with no catalyst and a crowd that mildly noticed is likely an unfinished decline. We expect ETC to fall further.
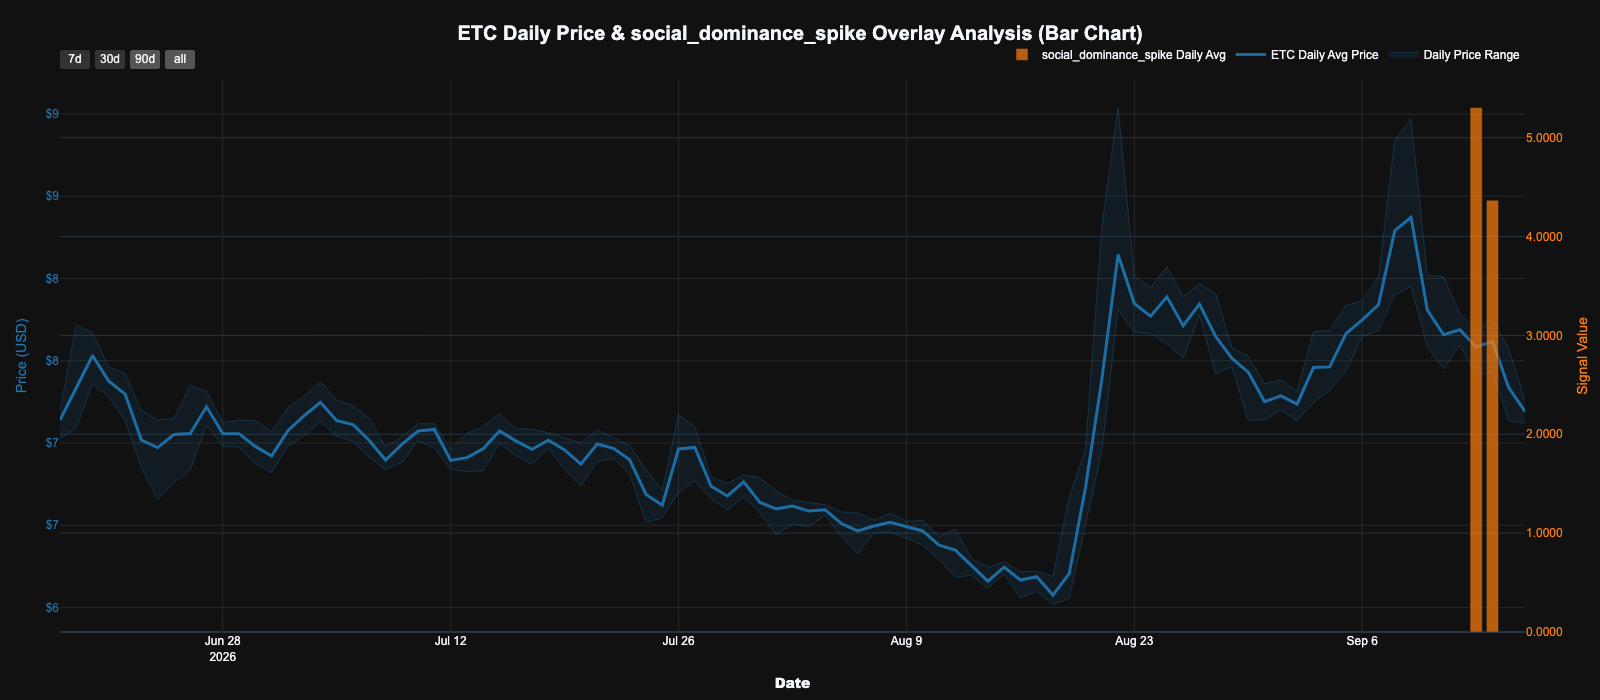
Trader tip: Use these signals in combination with fundamental analysis. Is the ETC community hopeful about the future? Is it an asset that is continuing to lose relevance? If so, then maybe countertrading strong social signals is the wrong move. Trade with them instead.
Last Week’s Scorecard
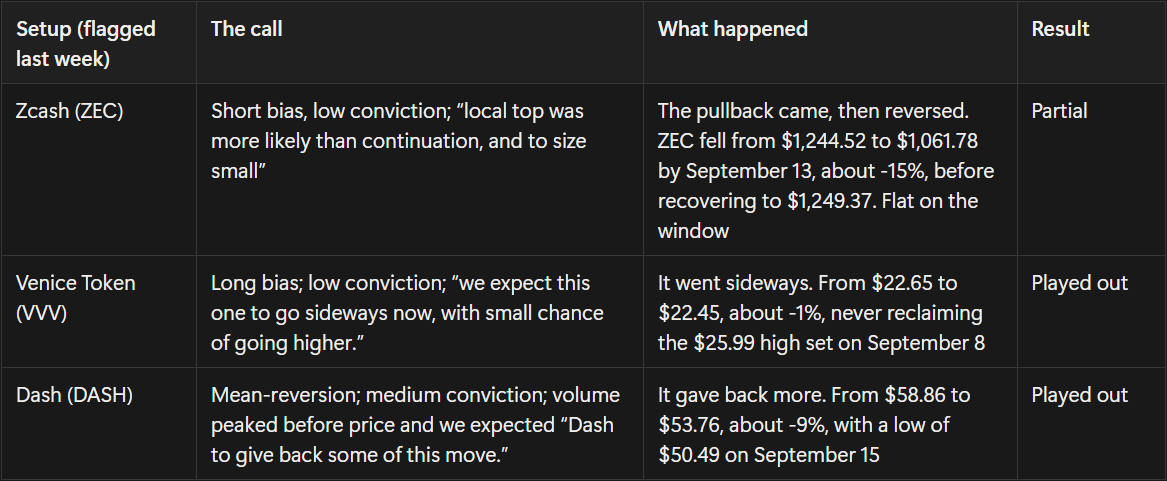
Scorecard read: Two played out and one partial, one of our best weeks. Every call this week shipped with a conviction level attached, none of them high, and the language was deliberately modest. Venice is the clearest case: we said sideways with a small chance of going higher, and it moved 1% in eight days. That is a win because it is exactly what we said would happen. Compare it with the confident extension calls we were making in late August, which read better on the page and lost money.
Zcash is the one still open. The pullback arrived on schedule, 15% in four days, then the whole thing came back, which is what a low-conviction call is supposed to look like when it is half right. The setup rested on a crowded trade with souring sentiment, and neither condition has resolved. With the CLARITY Act failing, the regulatory question sitting over the assets that carry the most of that risk is unresolved rather than settled, and privacy coins carry more risk than other types of tokens. That argues for another week rather than a verdict.
What Else Triggered
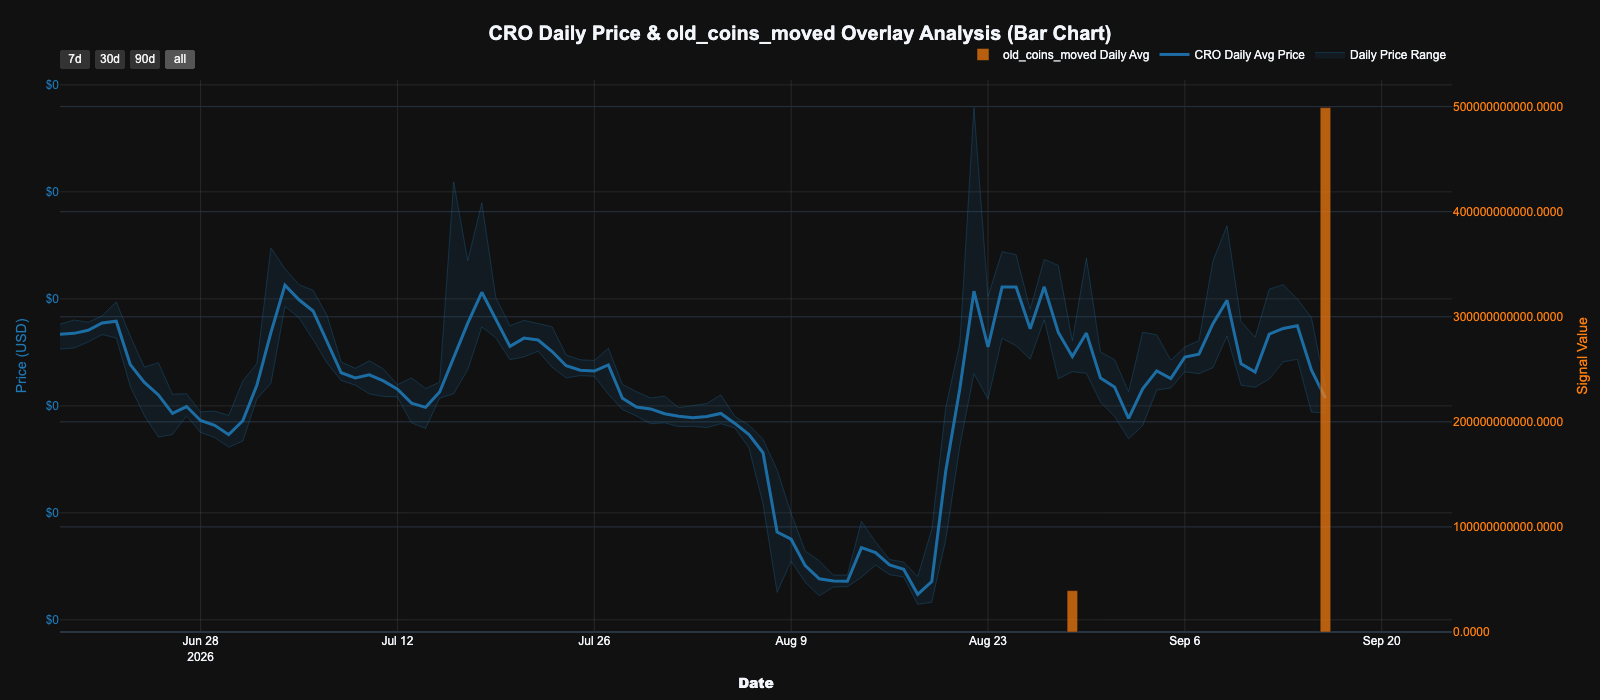
Cronos, CRO posted the largest threshold break of the week and the oldest coins.** 'old_coins_moved' recorded 79.15 times its trigger level: about 1.1% of circulating supply moved, untouched for an average of 979 days. Nearly three-year-old coins, on-chain volume roughly 23 times normal, metric day September 15. Price has dropped 6.3% since. This is also CRO’s second trigger in three weeks, after the August 28 event. Honestly, also not a bad short trade setup. I’ll track it in next week’s scorecard.
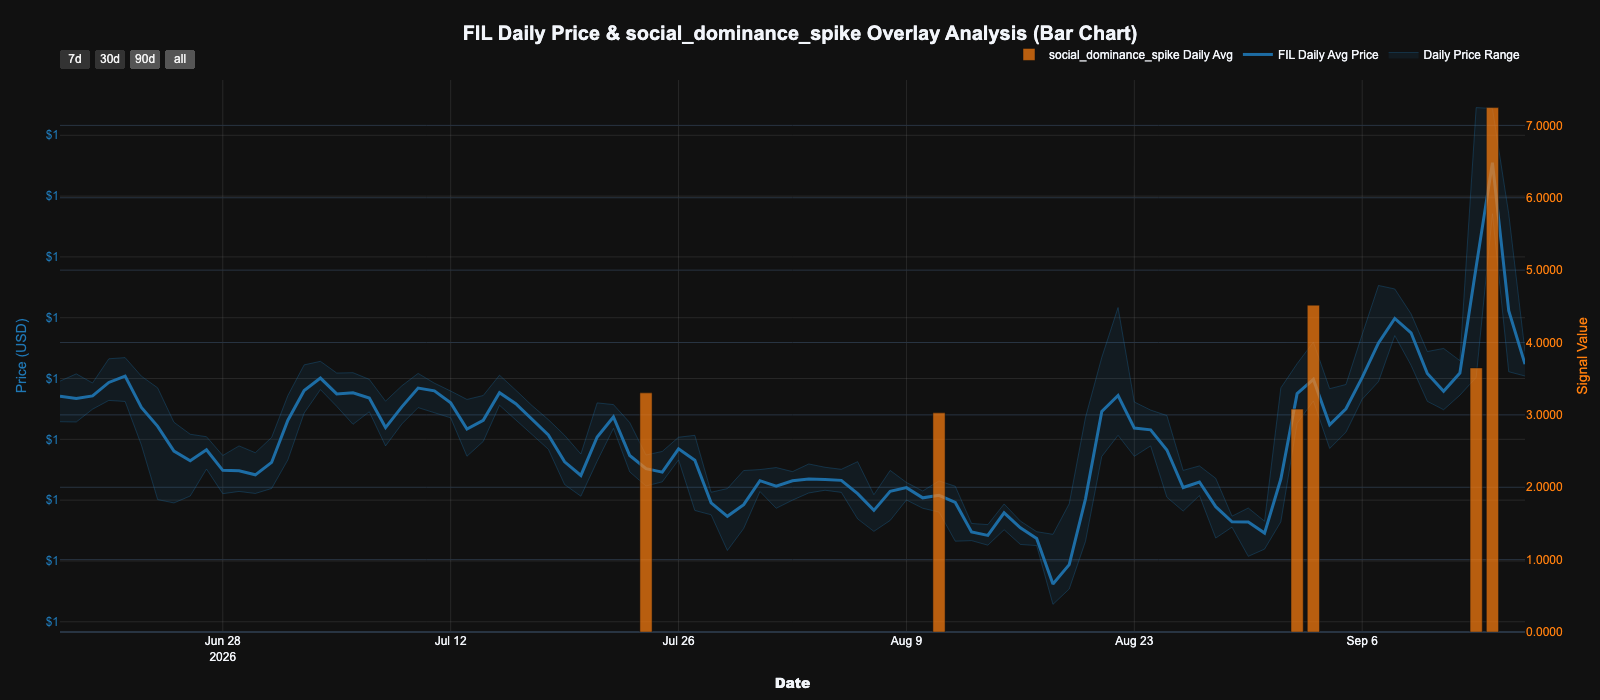
Filecoin, FIL drew three attention triggers, peaking at 8.40 on September 14 — the same day it topped CoinGecko's trending list.** CoinGecko said it had not expected to see Filecoin there in 2026. There was no news behind it: no Filecoin-specific announcement, listing or protocol upgrade in the preceding 24 hours, and the most notable exchange item was negative and predated the move. What did move was flow. Derivatives volume on FILUSDT ran more than 20 times its baseline, total volume rose over 1,100% in a day, and price broke above a descending trendline in late August.
'project_in_trends' caught nothing but Ethereum. Two triggers, a high of 114.03 on September 11, and no non-BTC or non-ETH projects appeared. In a week when social dominance scattered across 219 assets, none of them reached the ten most-discussed words in crypto.
No-shows this week: 'social_price_correlation', 'social_dev_score', and 'hyperliquid_avg_funding_rate' produced no eligible events.
Worth Watching
- Raydium, RAY: whether the loss of momentum continues.
- Telcoin, TEL: whether volume picks up and also whether a second dormant-supply trigger occurs.
- Ethereum Classic, ETC: whether sentiment finally breaks down into hopeless doom.
- Cronos, CRO: whether volume picks up, if it does it’s likely more selling than buying.
Full Trigger Table
Between 2026-09-09 10:00 and 2026-09-16 08:00 UTC, 690 trigger observations fired across six active signals.
Market-cap filter: latest_marketcap_usd > $50M.
Anomalies We Track
- Network Activity & Price Divergence Anomaly — detects price surges that are not accompanied by a corresponding rise in network activity (real growth). Triggered only if price growth exceeds 3% on the same day, ensuring the alert is relevant for significant bullish moves.
- Project in Trends Anomaly — detects when a specific crypto token gains significant traction in online discussions, placing it among the top 10 most-mentioned words in crypto-related conversations.
- Old Coins Moved Anomaly — detects unusually large amount of long-dormant supply moving, measured against each asset’s own recent history. Triggers above 1.5 times that baseline. A trigger shows old coins moved, not that anyone sold them.
- Large USDC-USDT Mint Anomaly — detects daily combined $1 billion or larger minting events of USDC and USDT stablecoins on the Ethereum blockchain.
- Social Price Correlation Anomaly — detects whether social sentiment and price are behaving in an unusually aligned or unusually decoupled way. Currently runs on 1h X.com social data for BTC, ETH, SOL, DOGE, XRP, TRX, and ADA.
- Social Dominance Spike Anomaly — detects abnormal spikes in social dominance. Alerts when values exceed a statistical significance threshold of 3 standard deviations over 30 days.
- Social-Dev Score Anomaly — detects unusual activity compared to the recent 30-day history of social media metrics and development activity. The score is weighted 60/40 for social and dev activity.
- Hyperliquid Average Funding Rates Anomaly — detects when rates exceed predefined high/low thresholds of +40% and -20%, measured hourly.
- ETH Whale Dump Anomaly — detects potential large-scale ETH dumps by monitoring whale wallet behaviors. Uses a 500 ETH threshold and a 30-day holding period to distinguish normal trading from potential dump scenarios.
Thanks for reading this week’s Santiment Anomaly Report. For real-time anomaly alerts and the underlying data, head to Sanbase — and since the report is becoming its own newsletter soon, join the mailing list to get it straight to your inbox.
See you next week.
Anomalously yours,
Santiment
Disclaimer: Parts of this report were generated with AI and then quality checked and copy-edited by humans. It is for reference purposes only and is not intended as financial or investment advice. Always DYOR.