The Weekly Anomaly Report: September 16th – 23rd

A token suddenly dominating crypto Twitter, whales dumping ETH, price spiking while network usage flatlines — you get the gist. We call these anomalies, and they often lead to trading opportunities.
This week we lead with the setups worth acting on, give you the market backdrop they sit against, and grade how last week’s calls actually played out. Let’s dig in!
This Week in Brief
- Zcash, ZEC: a new all-time high on less enthusiasm than the peak before it.
- Artificial Superintelligence Alliance, FET: up 42% in a week, but 5.2% of supply woke up on the day attention peaked, and usage is declining.
- Telcoin, TEL: dormant holders moved coins on the exact day of its high, for the second time in two weeks.
Market Backdrop
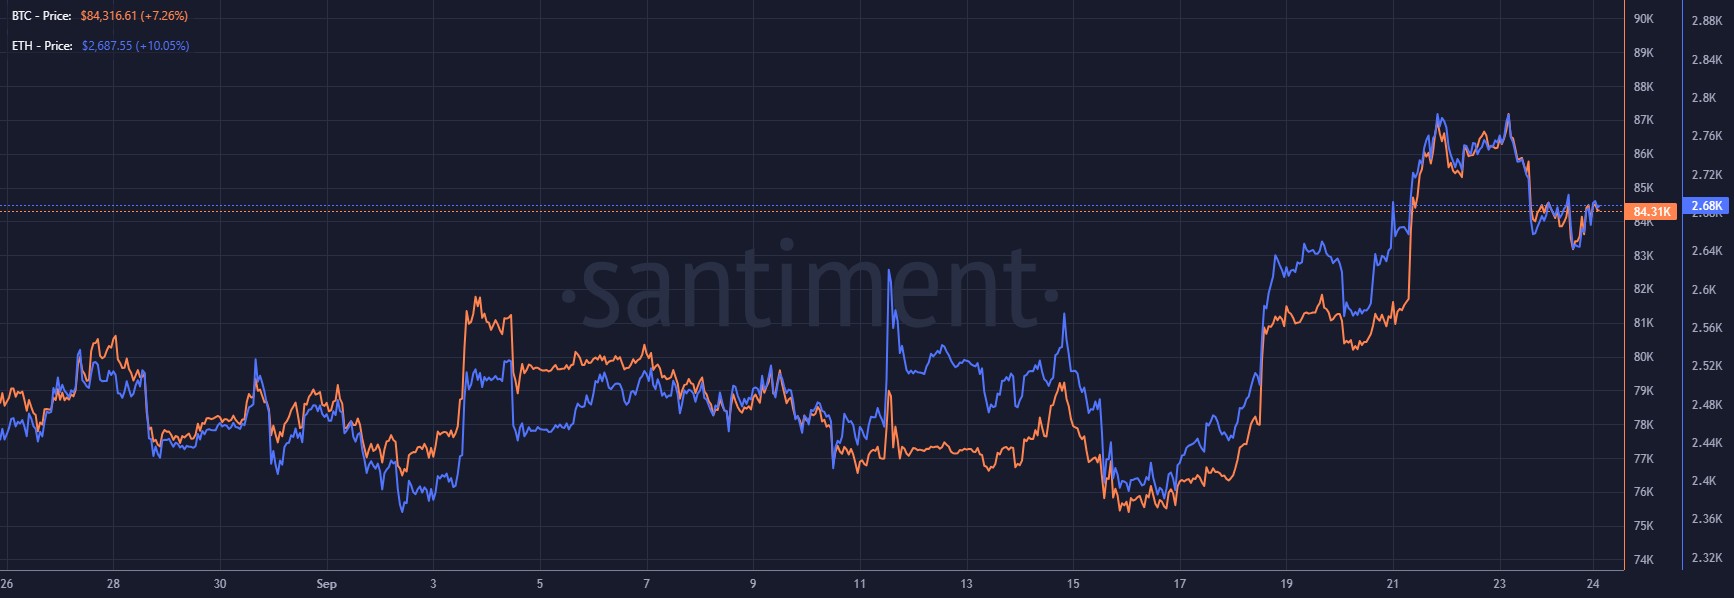
The market experienced a strong rally! Bitcoin climbed from $76.2K on September 16 to $86.6K on September 21, its highest level since late January, before easing to $84.4K by September 23 — up about 10.8% across the window. Ether went from $2,416 to $2,775 at the peak and finished near $2,684, roughly +11.1%. Every asset in last week’s setups rose with it.
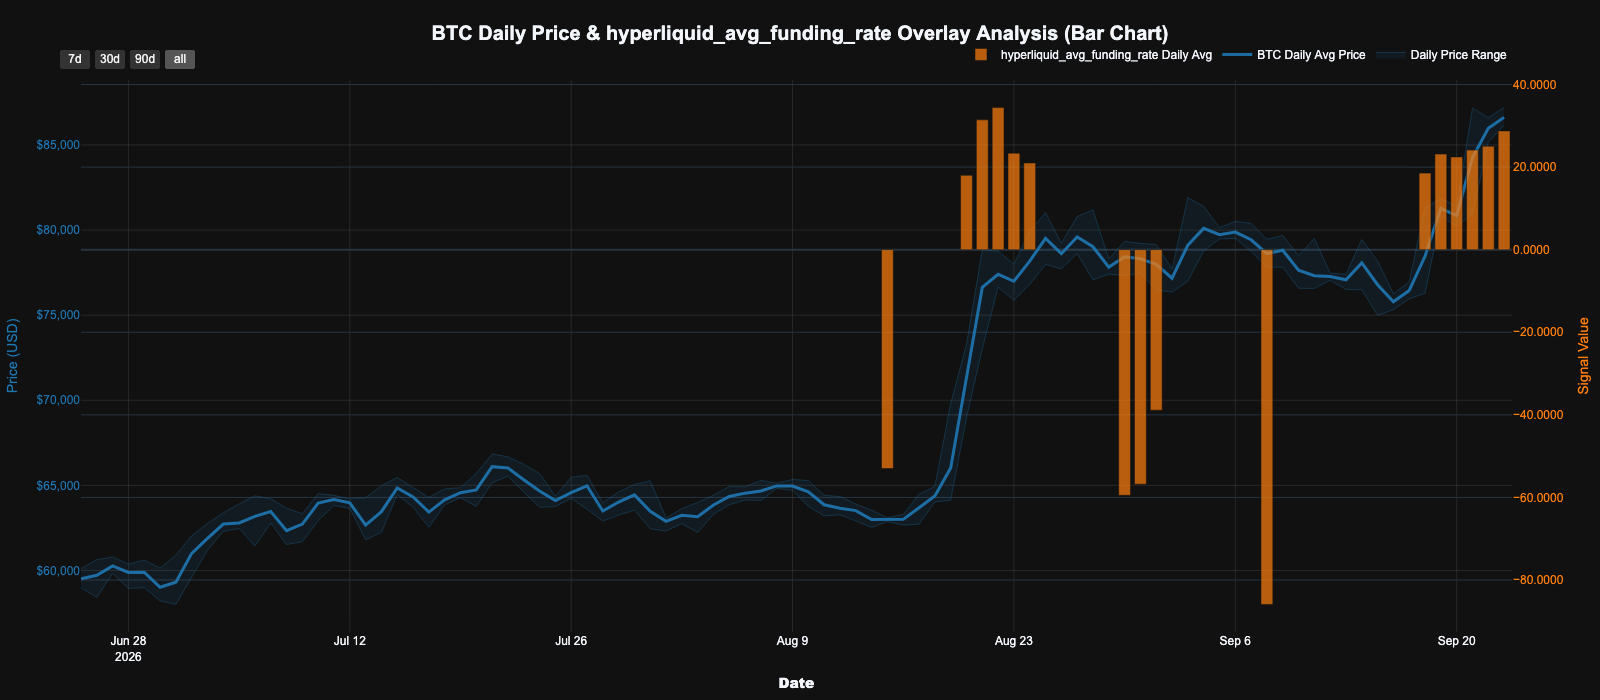
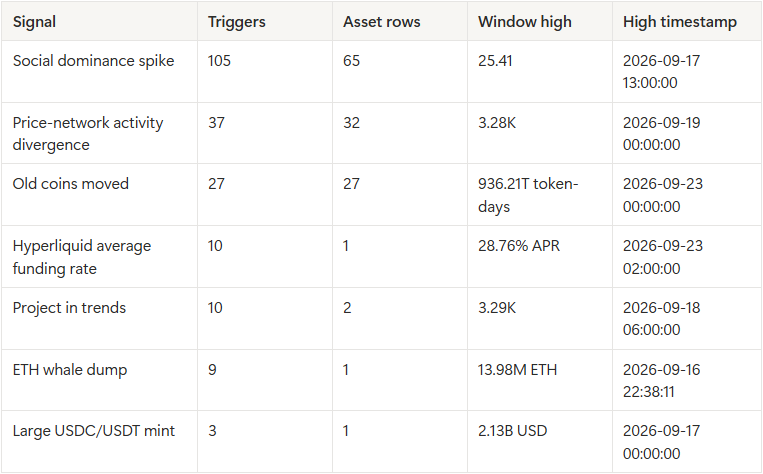
The crowd swung long. 'hyperliquid_avg_funding_rate' fired ten times, all of them on the high side, reaching 28.76% annualized on September 23 — above the 22.54% threshold that marks the top 2% of readings. Positive funding means traders betting on the price are paying the ones betting against it, so the positioning that was crowded short two weeks ago is now crowded long. As before, this is an average across Hyperliquid’s markets rather than a read on Bitcoin itself.
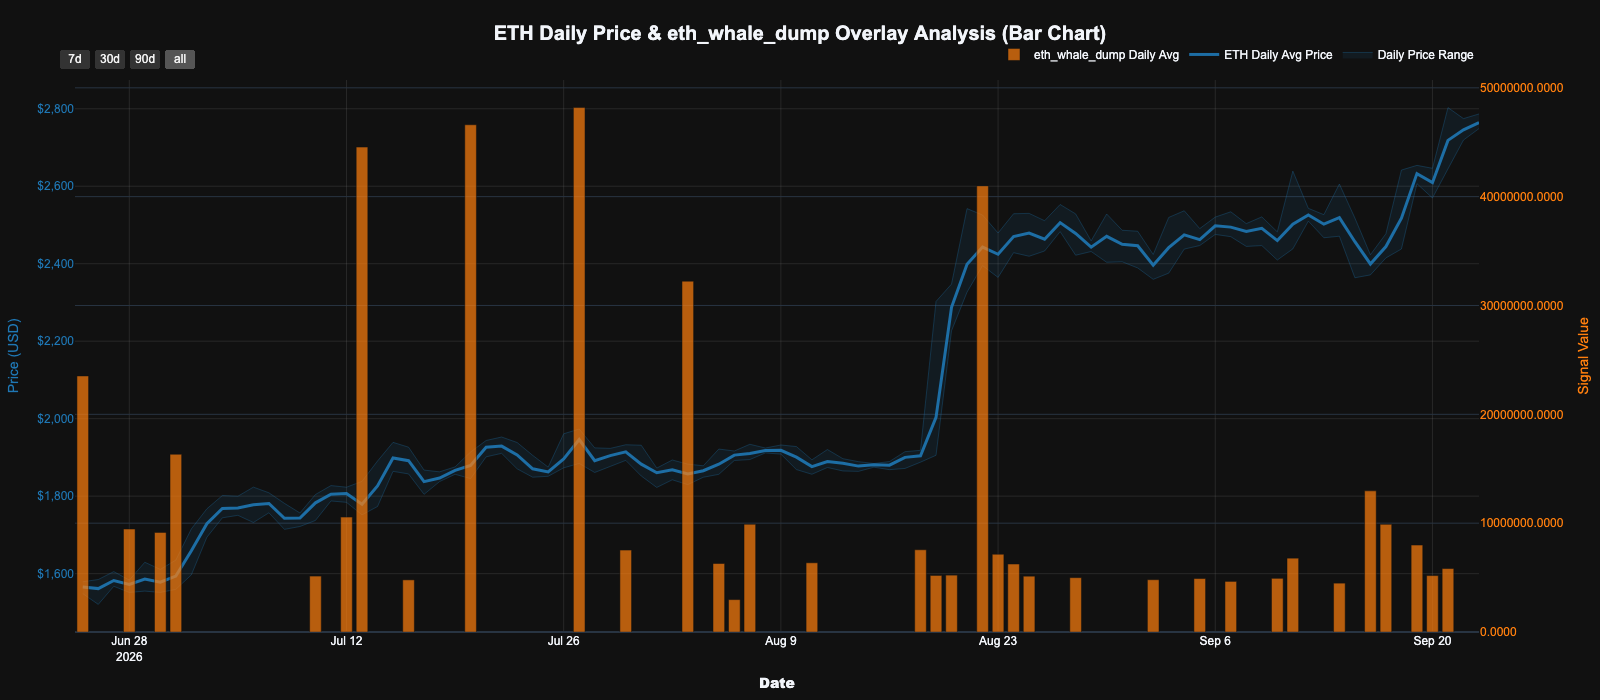
Large ETH holders sold into the move. 'eth_whale_dump' fired nine times between September 16 and 21, peaking at $13.98M on September 16, up from four events and an $8.71M high the week before.
Test your trading skills, build a track record, win capital allocation from Santiment on our new platform, Score Arena — Apply for early access!
This Week’s Trading Setups
1. Zcash (ZEC)
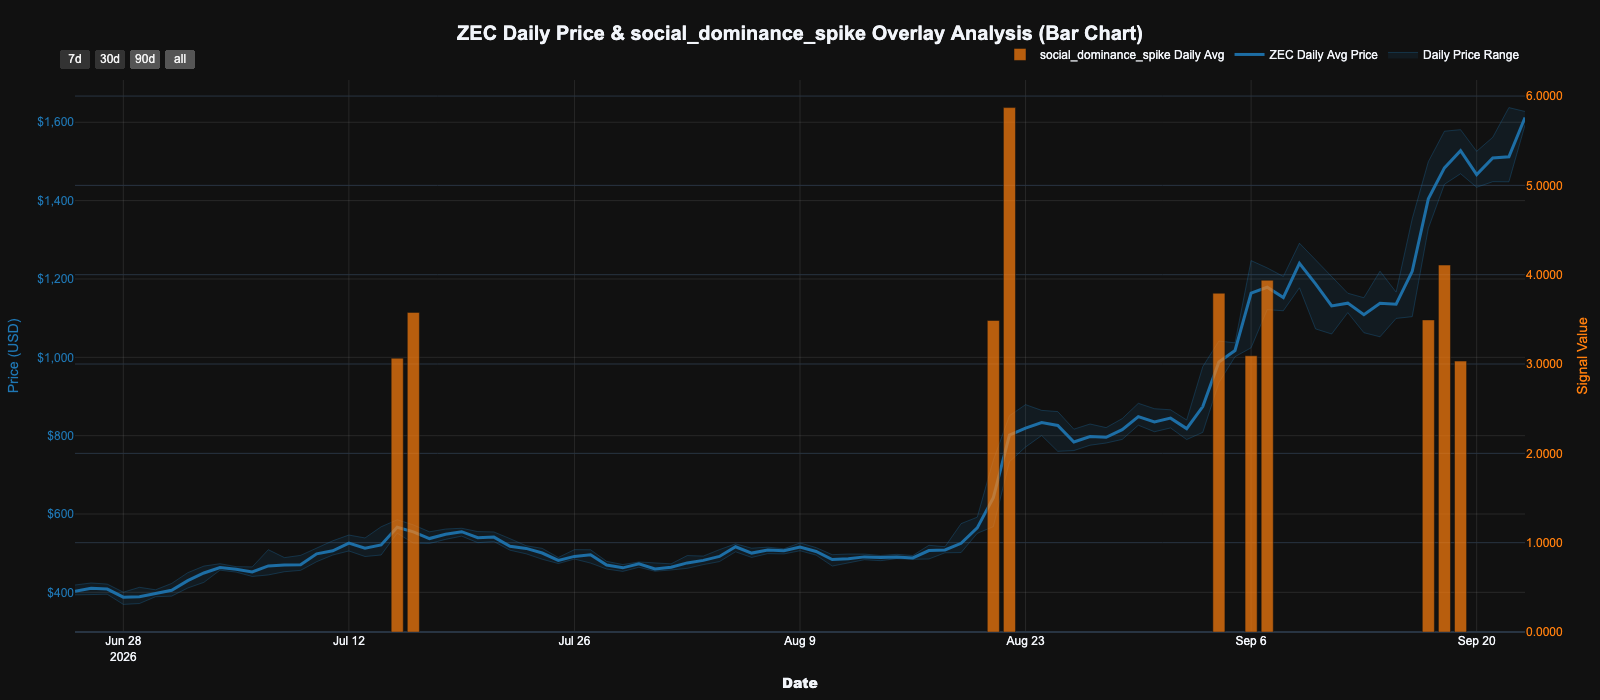
Signal: social_dominance_spike · Lean: Short bias, low conviction
What’s anomalous: 'social_dominance_spike' fired four times for Zcash, peaking at 4.11 on September 18. Market cap is about $26.0B. These signals were pretty much expected — ZEC set a new all-time high again, and attention usually reflects that.
Take a look at both the size of the crowd and its mood, because they moved together. Mentions and sentiment balance, which nets positive mentions against negative ones, both peaked on September 18 — at 666 mentions and a sentiment reading of 69.52, well above the 391 mentions and 31.2 reading from the September 6 peak that came before a 7% drop. By the time price made its new high of $1,628 on September 22, mentions had already fallen by two-thirds and sentiment by 42%. Both have kept falling since: mentions are down 70% from the peak and sentiment 85%, while price has slipped 5.4% to $1,540.
Why: The price action and the market, mostly. Bitcoin rose 11% to its highest level since late January, lifting nearly everything with it, and Zcash is the largest name in privacy coins, the sector that has performed best since Bitcoin’s October 2025 peak.
What to watch: Whether sentiment keeps falling while price holds. A higher price on a lower sentiment peak is the usual sign that a crowd is running out of new buyers. Sentiment climbing back above 40 would mean a fresh wave of enthusiasm, and our thesis could be early or outright wrong.
The takeaway: We have predicted a top on Zcash twice and been wrong both times, so treat this call with caution. The size of the euphoria has increased and price made a new high. We still lean toward a pullback at some point in the short to medium term.
Trader tip: size in proportion to your conviction.
2. Artificial Superintelligence Alliance (FET)
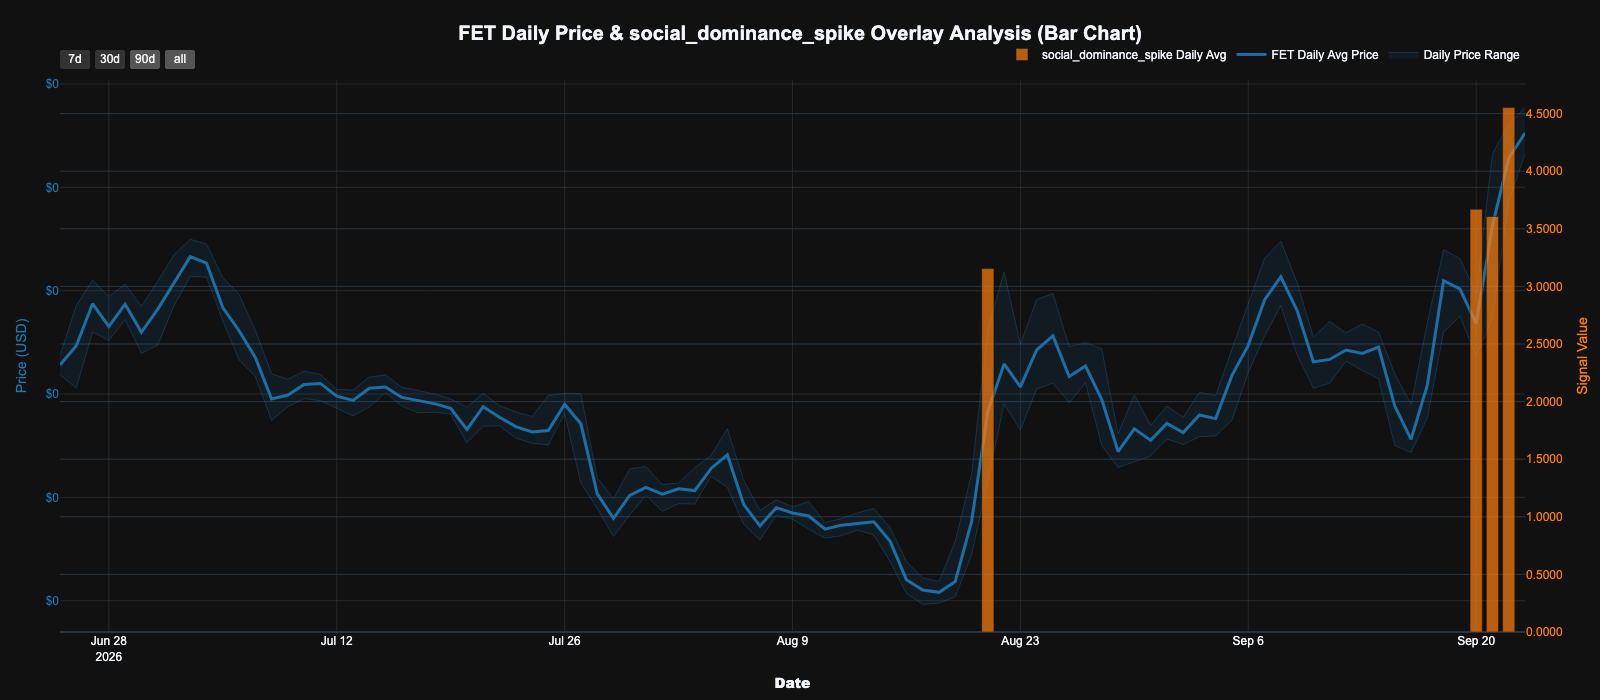
Signal: social_dominance_spike + old_coins_moved · Lean: Short bias, low conviction
What’s anomalous: FET hit two signals on the same day, September 22. 'social_dominance_spike' fired four times, peaking at 4.55. 'old_coins_moved' recorded 4.95 times its trigger level for FET: about 5.2% of circulating supply moved, untouched for an average of 316 days. Market cap is about $517M.
Price went from $0.158 on September 16 to $0.209 on September 22, up 32.6%, and daily active addresses rose by exactly the same amount over those days, from 680 to 902. Addresses jumped to 1,121 on September 18, then dropped to 640 on September 20, the day of the exploit and the only day they fell below where they started. Since the window closed, price has pulled ahead — up 45% from September 16 by September 24, against a 26% rise in active addresses. Only a small, insignificant divergence.
Why: We suspect it's the overall AI-sector token boom plus a technical breakout. FET broke above resistance near $0.19 and its 200-day moving average as Bitcoin rallied.
The only notable recent news is actually bearish. On September 20 an attacker drained roughly 8.7M FET, about $1.56M, from the project’s Ethereum token converter, pausing conversions. Sentiment balance fell to -4.29 that day, then recovered to +2.41 by September 22.
What to watch: Whether those old coins reach exchanges. Holders who had sat for most of a year moving 5.2% of supply into a breakout is the formula for likely sell pressure.
The takeaway: Long-dormant holders moved 5% of supply on the day attention peaked, user numbers and price are both trending upward. We lean toward a pullback, but price was still climbing at the close, so size small.
Trader tip: size altcoin trades to Bitcoin's trend, not just the token's own signals — a bearish setup during a Bitcoin rally is fighting the whole market.
3. Telcoin (TEL)
Signal: old_coins_moved · Lean: Short bias, medium conviction
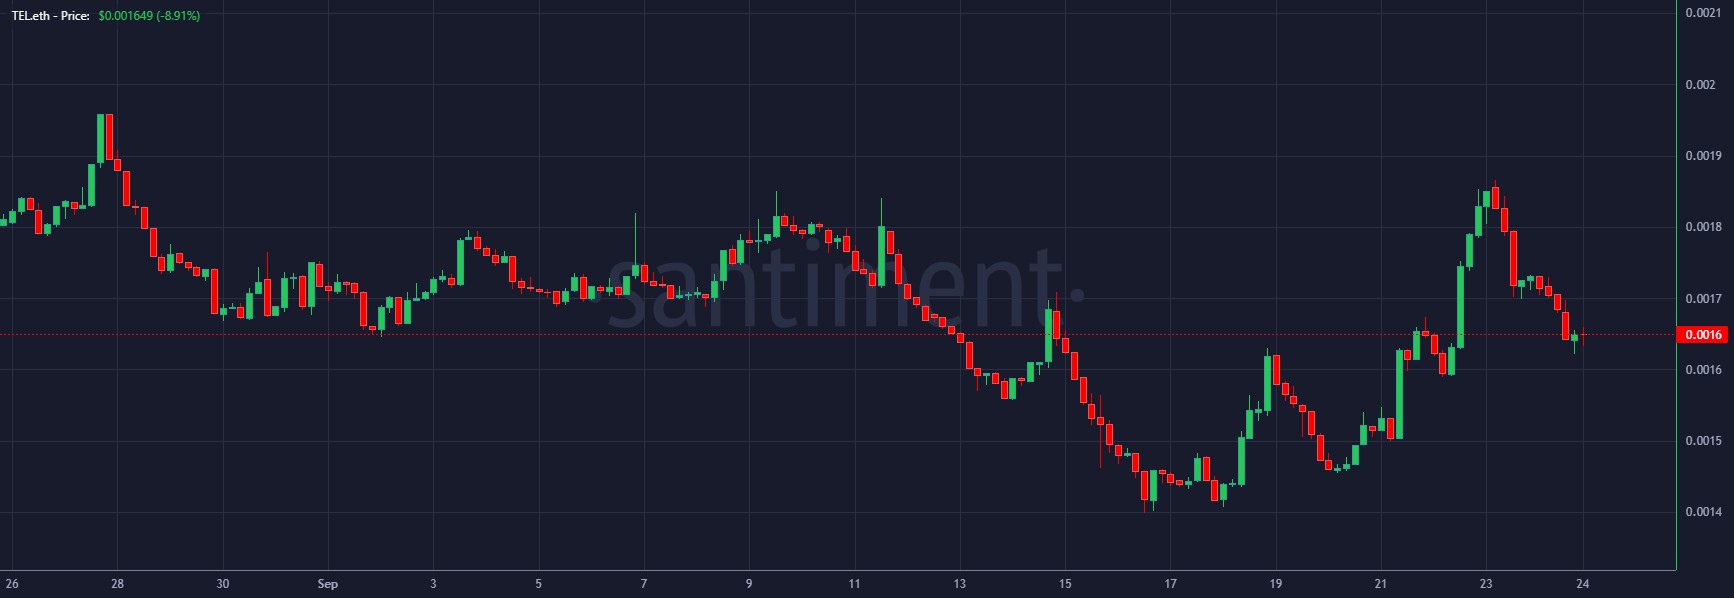
What’s anomalous: 'old_coins_moved' recorded 2.34 times its trigger level for Telcoin: about 0.43% of circulating supply moved, untouched for an average of 347 days. Market cap is about $158M. A smaller event than last week’s, but the timing is identical.
Take a look at the dates. The first trigger landed on September 9, the exact day TEL peaked at $0.001795. This one landed on September 22, the exact day TEL made its next high at $0.001830. Two dormant-supply events, two local tops, the same day both times. Price has fallen 10.3% since the second.
Why: No clear catalyst — flagging on data alone. Nothing specific to Telcoin landed on either date, and the rally between them came with the broader market.
What to watch: Whether a third trigger lands on the next rally. Last week we asked readers to watch for this second one, and it arrived on schedule. A third could indicate another local top with fairly high confidence.
The takeaway: Dormant Telcoin holders have now sold into two consecutive highs, on the exact day each time. We expect them to do it again, and for price to struggle each time it rallies.
Trader tip: mark the day dormant coins move on the chart before acting — Telcoin’s two events landed on its two highest days of the month.
Last Week’s Scorecard
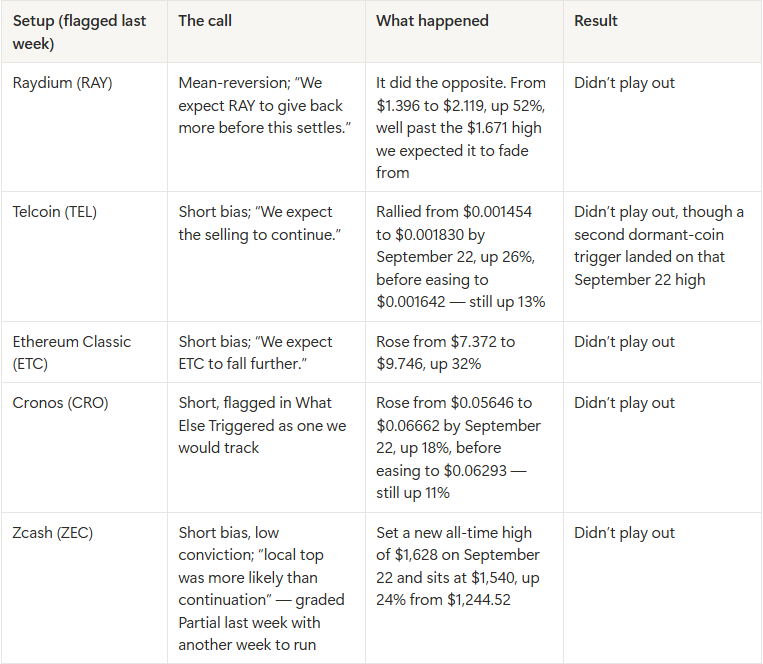
Scorecard read: Zero for five. Every call leaned bearish, and Bitcoin rose 11% to its highest level since late January. When BTC pumps, it carries almost every asset with it, and single-asset shorts get run over however good the individual setups looked.
The painful part is that we had the warning and read it backwards. Funding had just printed the most extreme short positioning we had recorded, and when it went quiet we called the crowd shorting alt-coins “simply right.” Crowded shorts are exactly what a squeeze needs. This week the same signal points the other way — the crowd is now crowded long — which is why the three setups above lean short.
What Else Triggered
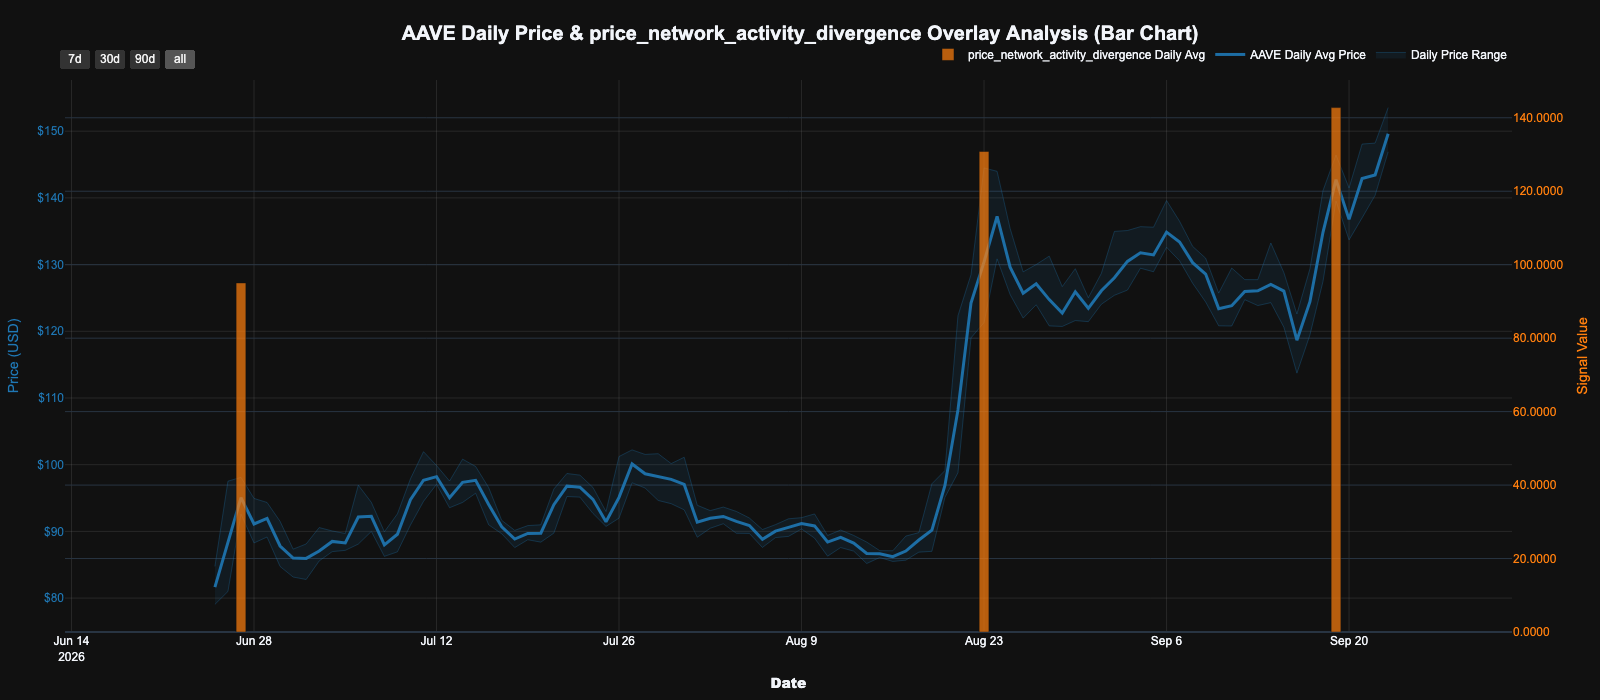
Aave, AAVE posted the most extreme divergence ratio of the week, and it does not survive zooming out.** 'price_network_activity_divergence' flagged Aave on September 19, when price rose 6.37% while active addresses rose 0.26% — a ratio of 24.75. Across the whole move from September 16 to 22, price gained 23% and active addresses gained 31%. Users grew faster than price. One day’s ratio is a snapshot, not a trend.
'old_coins_moved' fired for 27 assets this week. Beyond Telcoin, among the strongest readings:
- WhiteBIT Token, WBT: 36.67 times its trigger level, the standout reading of the week and three times the next-highest, on September 18 — the same day it set an all-time high of $83.64. It has since pushed higher to $87.91. On an exchange token, dormant supply moving at a record is likely the issuer’s own reserves rather than holders selling so treat this with caution.
- Vision, VSN: 11.79 times its trigger level, about 1.1% of supply, dormant 357 days, on September 21. Price has edged up 2.4% since.
- Polygon Ecosystem Token, POL: 5.34 times, about 1.6% of supply, dormant 294 days, on September 22. Price is roughly flat since, down 0.9%.
- AIOZ Network, AIOZ: 4.46 times, about 5.9% of supply, but dormant only 20 days, on September 21 — the day price jumped 56%. It has fallen 11.9% since.
- XRP: 3.10 times, about 1.8% of supply, dormant 271 days, on September 17 — its third trigger since mid-August, after August 17 and September 1. Price has risen 18% since.
Nexo, NEXO was the only asset besides Bitcoin to reach 'project_in_trends', with the week’s highest trend score of 3.29K on September 18. We found no Nexo-specific news behind it, and its price rose 8.8%, less than Bitcoin’s 11%.
No-shows this week: 'social_price_correlation' and 'social_dev_score' produced no eligible events.
Worth Watching
- What BTC will do next.
- Zcash, ZEC: will sentiment keeps falling while price holds?
- Artificial Superintelligence Alliance, FET: will those recently dormant coins reach exchanges?
- Telcoin, TEL: will a third dormant-supply trigger land?
Full Trigger Table
Between 2026-09-16 08:00 and 2026-09-23 06:00 UTC, 201 trigger observations fired across seven active signals.
Market-cap filter: latest_marketcap_usd > $50M.
Anomalies We Track
- Network Activity & Price Divergence Anomaly — detects price surges that are not accompanied by a corresponding rise in network activity (real growth). Triggered only if price growth exceeds 3% on the same day, ensuring the alert is relevant for significant bullish moves.
- Project in Trends Anomaly — detects when a specific crypto token gains significant traction in online discussions, placing it among the top 10 most-mentioned words in crypto-related conversations.
- Old Coins Moved Anomaly — detects unusually large amount of long-dormant supply moving, measured against each asset’s own recent history. Triggers above 1.5 times that baseline. A trigger shows old coins moved, not that anyone sold them.
- Large USDC-USDT Mint Anomaly — detects daily combined $1 billion or larger minting events of USDC and USDT stablecoins on the Ethereum blockchain.
- Social Price Correlation Anomaly — detects whether social sentiment and price are behaving in an unusually aligned or unusually decoupled way. Currently runs on 1h X.com social data for bitcoin, ethereum, solana, dogecoin, xrp, trx, and cardano.
- Social Dominance Spike Anomaly — detects abnormal spikes in social dominance. Alerts when values exceed a statistical significance threshold of 3 standard deviations over 30 days.
- Social-Dev Score Anomaly — detects unusual activity compared to the recent 30-day history of social media metrics and development activity. The score is weighted 60/40 for social and dev activity.
- Hyperliquid Average Funding Rates Anomaly — detects when rates exceed predefined high/low thresholds of +40% and -20%, measured hourly.
- ETH Whale Dump Anomaly — detects potential large-scale ETH dumps by monitoring whale wallet behaviors. Uses a 500 ETH threshold and a 30-day holding period to distinguish normal trading from potential dump scenarios.
Thanks for reading this week’s Santiment Anomaly Report. For real-time anomaly alerts and the underlying data, head to Sanbase — and since the report is becoming its own newsletter soon, join the mailing list to get it straight to your inbox.
See you next week.
Anomalously yours,
Santiment
Disclaimer: Parts of this report were generated with AI and then quality checked and copy-edited by humans. It is for reference purposes only and is not intended as financial or investment advice. Always DYOR.