The Weekly Anomaly Report: August 26th – September 2nd


A token suddenly dominating crypto Twitter, whales dumping ETH, price spiking while network usage flatlines — you get the gist. We call these anomalies, and they often lead to trading opportunities.
This week we lead with the setups worth acting on, give you the market backdrop they sit against, and grade how last week’s calls actually played out. Let’s dig in!
Test your trading skills, build a track record, win capital allocation from Santiment on our new platform, Score Arena
— Apply for early access!
Market Backdrop
Bitcoin peaked at about $80.3K on August 27, then spent the rest of the window between $77.7K and $78.5K, finishing near $77.0K — down about 2.6%. Ether was weaker, easing from $2,508 to $2,378, roughly -5.2%. After the previous week’s 21% move, this was a period where both were digesting the rapid upward move from the prior week.
Fund inflows were very active. Spot Bitcoin funds logged eight consecutive days of inflows, with August passing $3B. Solana products had their strongest month of 2026, taking $153M in a single week, and August 27 alone brought $60.91M — the third-largest day since those funds launched.
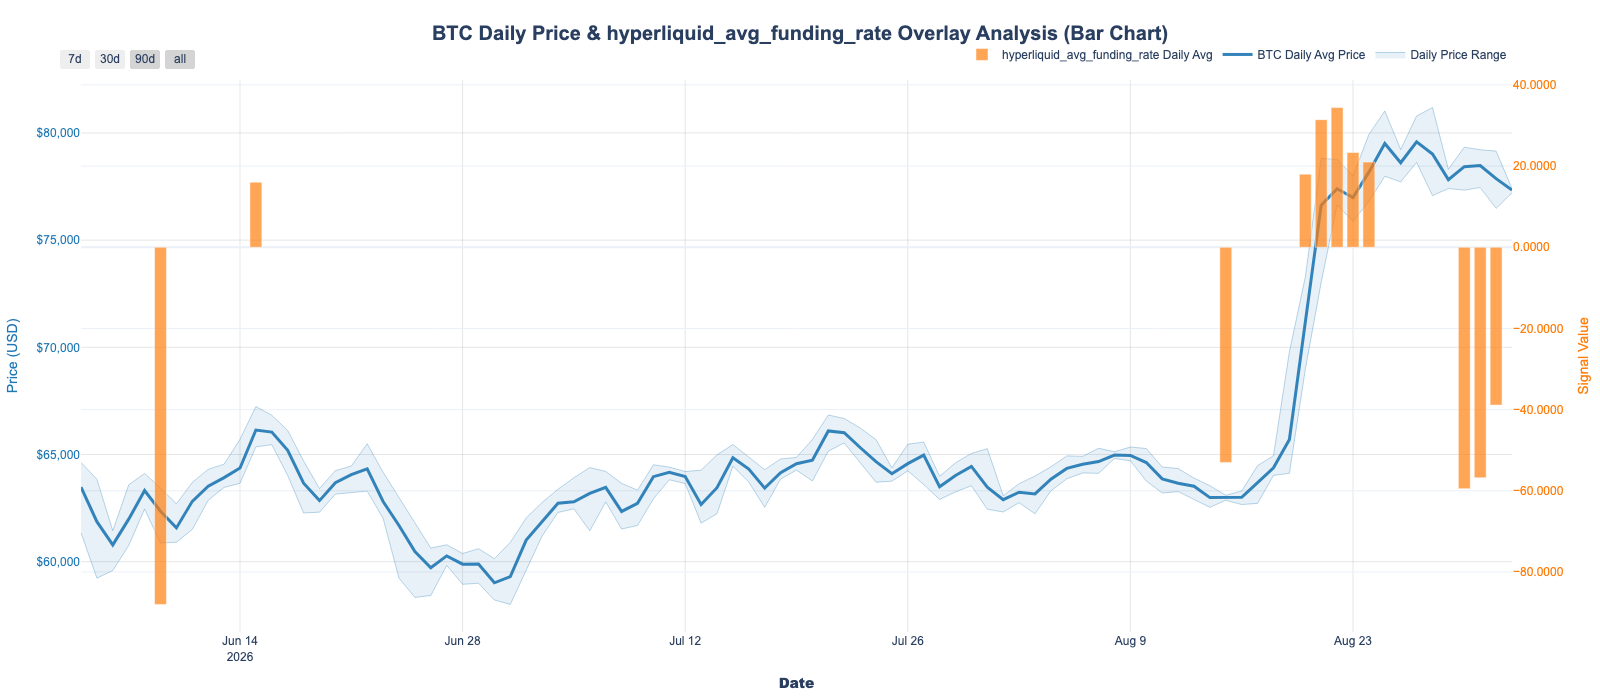
Aggregated funding rates on both Bitcoin and Ether stayed positive for the entire week, so traders betting on the majors were paying to hold those bets throughout. Hyperliquid tells a different story. hyperliquid_avg_funding_rate fired four times, with its strongest reading at -72.58 on August 31 against a trigger level of -20, and the sequence across three weeks now reads -53 on August 15th, then +46.91 on August 21st, and -72.58 on August 31st. Since it is a venue-wide average and the majors never went negative, what it is picking up is waves of shorting in long-tail alt-coins — a reading on how volatile the altcoin market is rather than a signal about market direction.
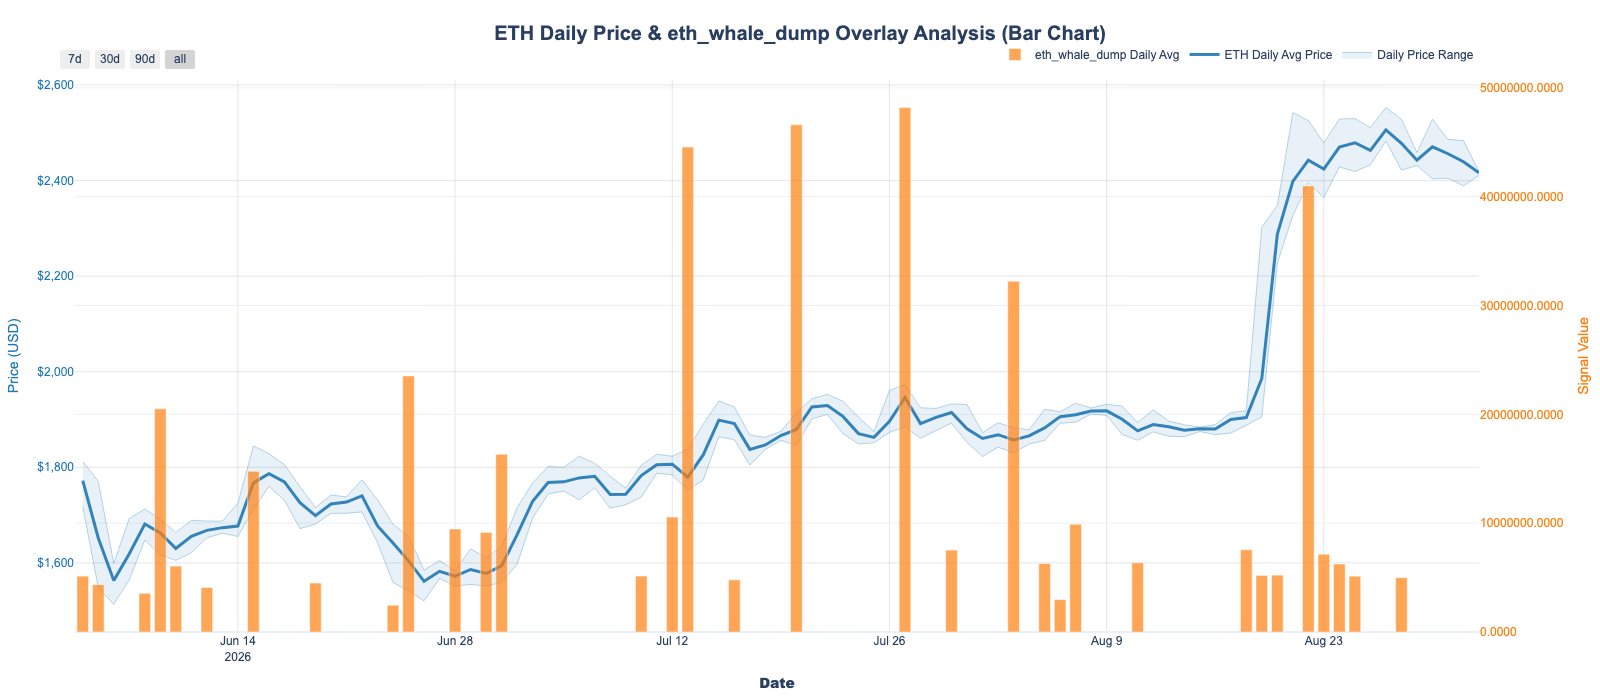
Large ETH holders went quiet again. eth_whale_dump only fired once, for about $5M on August 28 — roughly 2,040 ETH, the smallest reading in the last five weeks. The last time it went this quiet was that single $7.55M event on August 18, the day before Bitcoin broke out and Ether gained 17.5% in one session.
On-chain flows tell a two-part story. Between August 26 and 28, about 250,000 ETH left exchange wallets, the largest withdrawal landing on August 28 itself. Then it reversed, with roughly 83,000 ETH returning over the final four days. Net for the week, about 166,000 ETH still left exchanges, so the supply overhang eased.
This Week’s Trading Setups
1. Uniswap (UNI)
Signal: price_network_activity_divergence · Lean: Long bias, extending
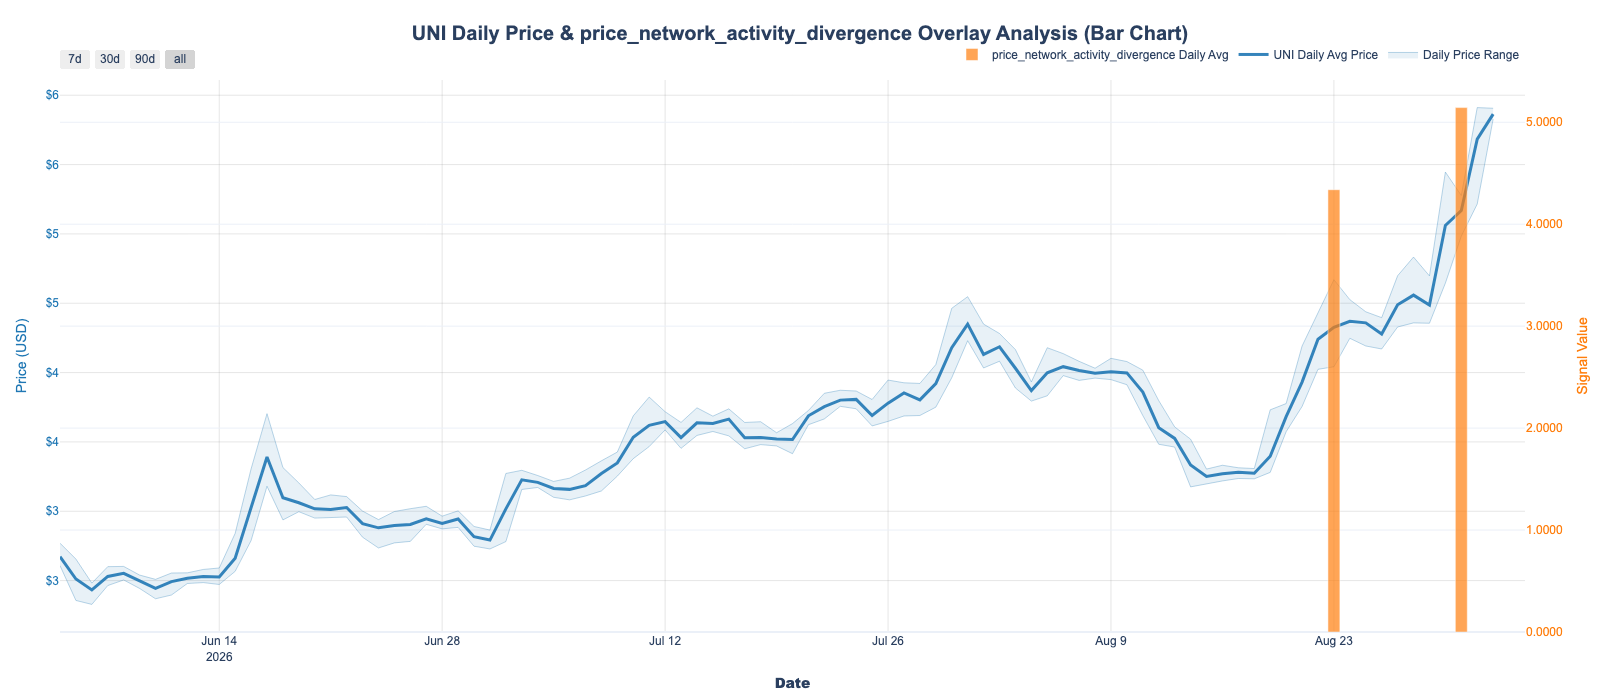
What’s anomalous. price_network_activity_divergence recorded 5.14 on August 31, the largest reading of the week. Market cap is about $3.60B.
Price went from $4.38 on August 26 to $5.78 by September 2, about +32%. Measured from August 18 it is closer to +76%. Bitcoin fell 2.6% over the same window, so this was Uniswap’s own move rather than market beta.
Notably, volume rose into the endpoint instead of before it: $207M on August 26, then $733M on August 30, $797M on September 1, and $988M on September 2 — the highest reading of the whole period, roughly seven times the mid-August baseline near $130M. Every other big mover we have covered in the past two weeks saw volume peak before price did. This one has not yet.
Why. Uniswap’s fee switch now buys and burns UNI with protocol revenue, and the revenue is real: about $53.4B of trading volume last month generated more than $98M in protocol fees over 30 days. Roughly 100M UNI, close to 10% of total supply, has been permanently burned through the UNIfication mechanism. Daily burns set a record on August 21 at about 150,000 UNI, and the annualized rate now runs above 16M UNI.
The newer piece is where that volume comes from. Robinhood Chain DEX volume hit $1.58B in the week to September 1, up about 90%, with Uniswap the leading venue. Its Robinhood Chain total value locked rose 87% to roughly $127M, and tokenized stock trading reached about $130M a day. Price jumped roughly 15% on August 30 and 31 as those burn figures landed.
What to watch. The $4.80–$5.00 area that capped price for months now sits below it. The bull case rests entirely on fee revenue persisting — early v4 fee figures near $325,000 a day annualize to around $119M, but a few weeks of data is not a trend. If Robinhood Chain volume slows, the burn slows with it, and the bull trend may stall.
The takeaway: The buyback is funded by fees that are still growing, and volume rose into the close rather than before it. Unlike most of what we have covered lately, this one does not look exhausted — we expect it to extend.
Trader tip: Watch the daily burn rate rather than the price — Uniswap’s set a record 150,000 UNI on August 21 and annualizes above 16M.
2. Solana (SOL)
Signal: project_in_trends · Lean: Mean-reversion
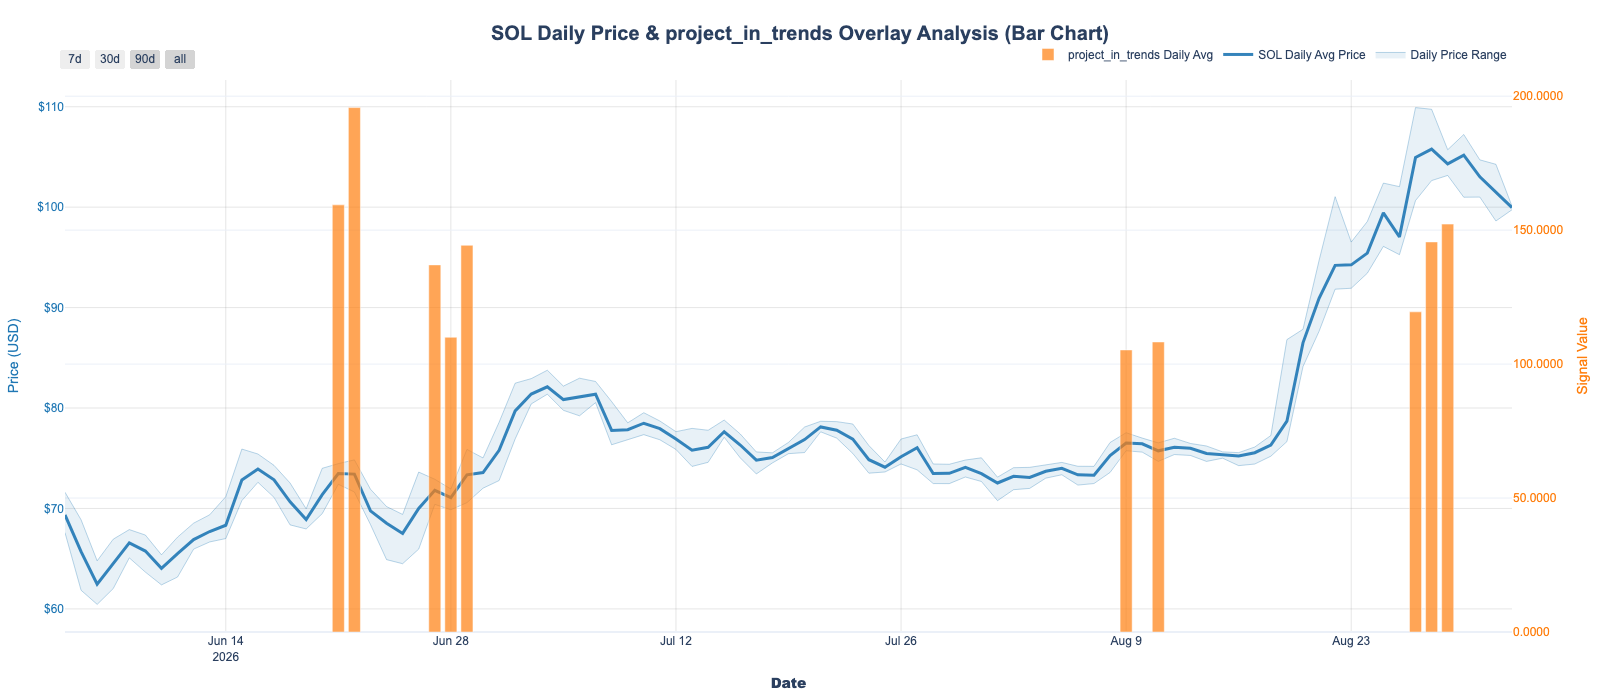
What’s anomalous. project_in_trends fired four times for Solana, peaking at 153.87 on August 28 at 21:00 UTC. Solana was the only asset to trigger this signal all week.
The timing is the problem. Price peaked on August 27 at $109.22, reaching $110.38 intraday — its highest since January. Attention peaked the next day. By September 2 price was $98.35, about 10% below the high.
Volume tells the same story. Solana traded $7.16B on August 27, then $6.01B, then halved to $2.05B on August 29, settling near $3.1B. Volume peaked with price, not after it.
Why. Two genuinely good things landed, both slightly late. August 27 was a record ETF inflow day at $60.91M. Then on August 28, SGP-0002 passed — Solana’s first binding on-chain governance vote, settling a months-long argument over token emissions. 300ms slot times went live the same day. Solana DEX volume hit a monthly high of $7.94B on that date, and Solana DEXs beat Bybit, Coinbase, and Kraken on combined spot volume for a ninth straight week.
SOL finished August up about 46%, its first monthly gain in ten months.
What to watch. The upgrade and the governance vote are done, and price is lower than before they happened. That does not make them worthless, but it removes them as forward catalysts. SOL remains roughly 66% below its January 2025 high. The best things to watch now are public sentiment and onchain metrics.
The takeaway: The good news arrived after the buyers did. With both catalysts spent and volume already halved, our read is short term downside or sideways grinding from here as the price waits for BTC and ETH to make their next moves.
Trader tip: when a rally is market beta, don’t be quick to credit it to the project's roadmap. Watch the major trends, you’re best bet is to go with the entire market’s direction.
3. Chainlink (LINK) and the August 27 cluster
Signal: old_coins_moved · Lean: Mean-reversion
What’s anomalous. old_coins_moved fired for 31 assets this week, and seven of them share the same metric day: August 27. That is the single day Bitcoin topped at $80.3K and the market stopped going up. Shiba Inu, Jasmy, Chainlink, ENS, Uniswap, and SPX6900 all recorded dormant-supply events on that date, across unrelated chains and unrelated businesses.
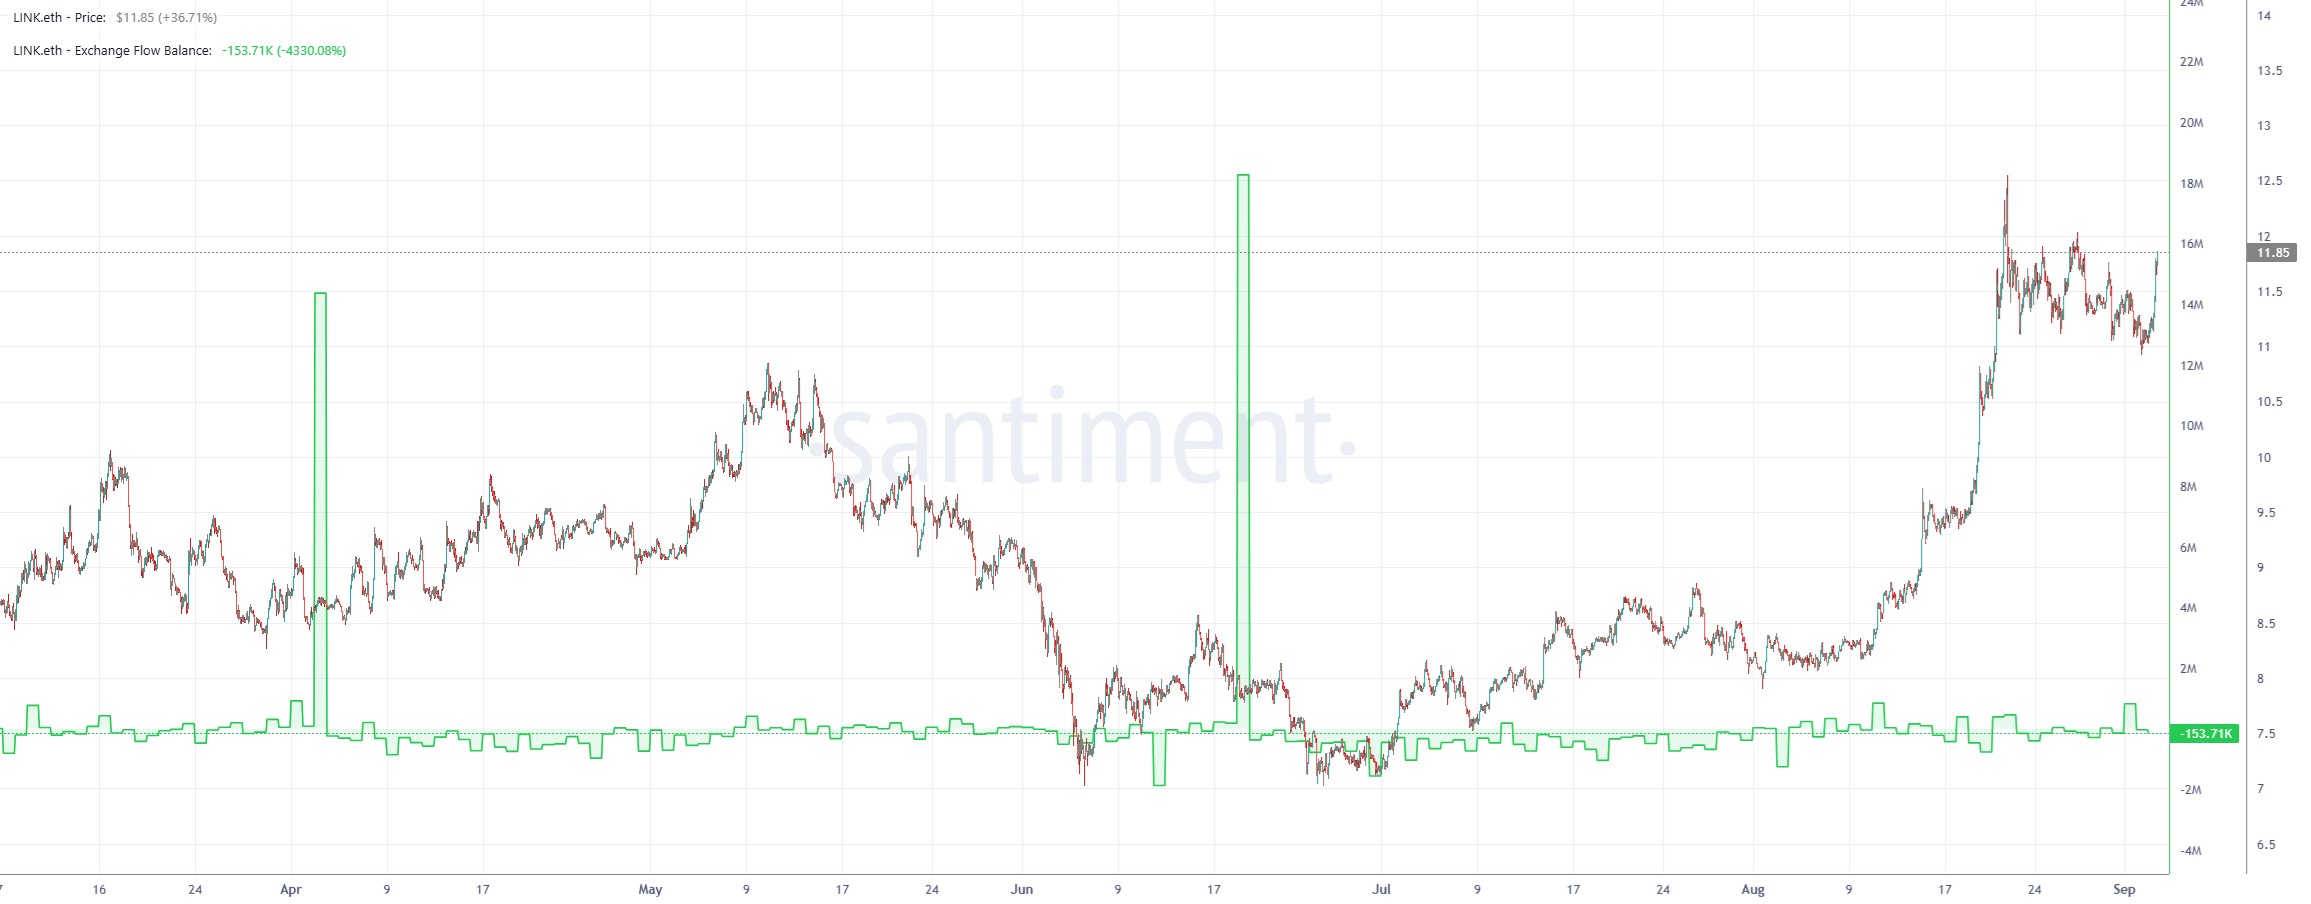
Chainlink is the clearest of them. old_coins_moved recorded 15.81 times its trigger level: about 2.7% of circulating supply moved, untouched for an average of 716 days — the longest dormancy of any asset that triggered. On-chain volume hit 20.07M LINK that day against 1.76M to 13.94M on every other day of the window. LINK peaked at $11.945 on August 27 and has fallen 7.0% since, to $11.105.
We flagged LINK as long-bias three weeks ago at $8.67, and it ran to $11.945 — up 38%. This is the other side of that trade.
Why. No new catalyst on any of the seven — flagging on data alone. That is what makes the clustering interesting. Seven separate groups of long-term holders, with no shared news, moved coins on the same day, and it was the day the market peaked.
What to watch. BTC, exchange balances, and whether these events repeat. Long-dormant holders moving once is noise; the same assets triggering again is a read on sentiment.
The takeaway: Whether these events repeat. Long-dormant holders moving once is noise; the same assets triggering again is a position being worked through. The call also depends on Bitcoin: most of these assets follow it, so another large move up would override the dormant-supply signal entirely.
Trader tip: Size down when a sell signal fights the market — LINK’s dormant holders moved at the top, but Bitcoin running higher may take these assets with it.
Last Week’s Scorecard
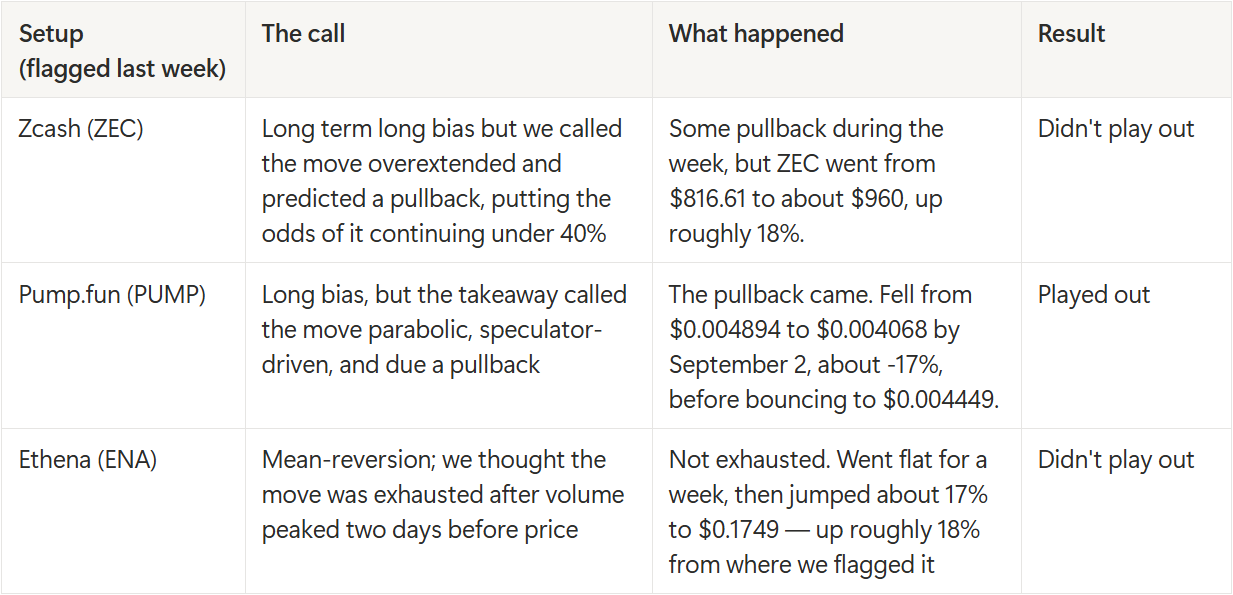
Scorecard read: One win and two misses. All three calls leaned toward exhaustion after big August runs. We acknowledged the large influence BTC price had on our predictions, same as this week.
For Z-Cash, we put the odds of continuation under 40% and told readers to avoid buying tops. It is now at an all-time high, roughly 18% above where we said that. Ethena is the same error in a different shape: peak sentiment and peak volume did arrive before peak price, exactly as we described, and the move resumed anyway. The reason we gave a reasonable chance to a continued move upward is because a week of sideways price after a parabolic run can be consolidation as well as exhaustion, and our educated guess was that this one would be more likely exhausted.
Pump.fun is the win, and worth noting it was the one where the bearish case rested on something structural — monthly team and investor unlocks — rather than on momentum looking stretched.
What Else Triggered
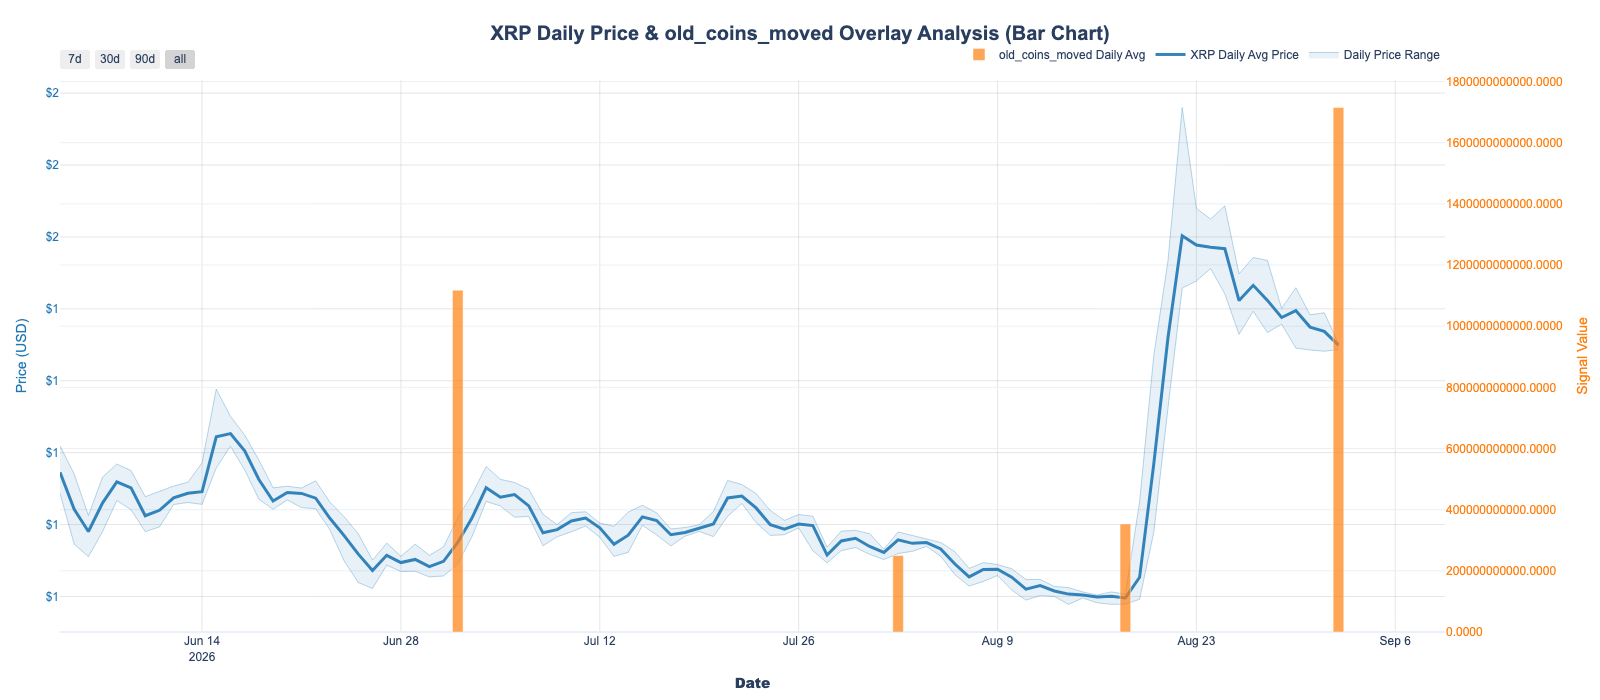
XRP coin movement answers what we asked last week. old_coins_moved recorded 19.55 times its trigger level: about 4.9% of circulating supply moved, untouched for an average of 542 days. These coins had been still for a year and a half. This is also XRP’s second trigger in three weeks, after August 17 — and last week we said the thing to watch was whether this signal broadened into repeat activity on the same asset. It has, on XRP. Price fell about 6.4% over the window while those coins moved.
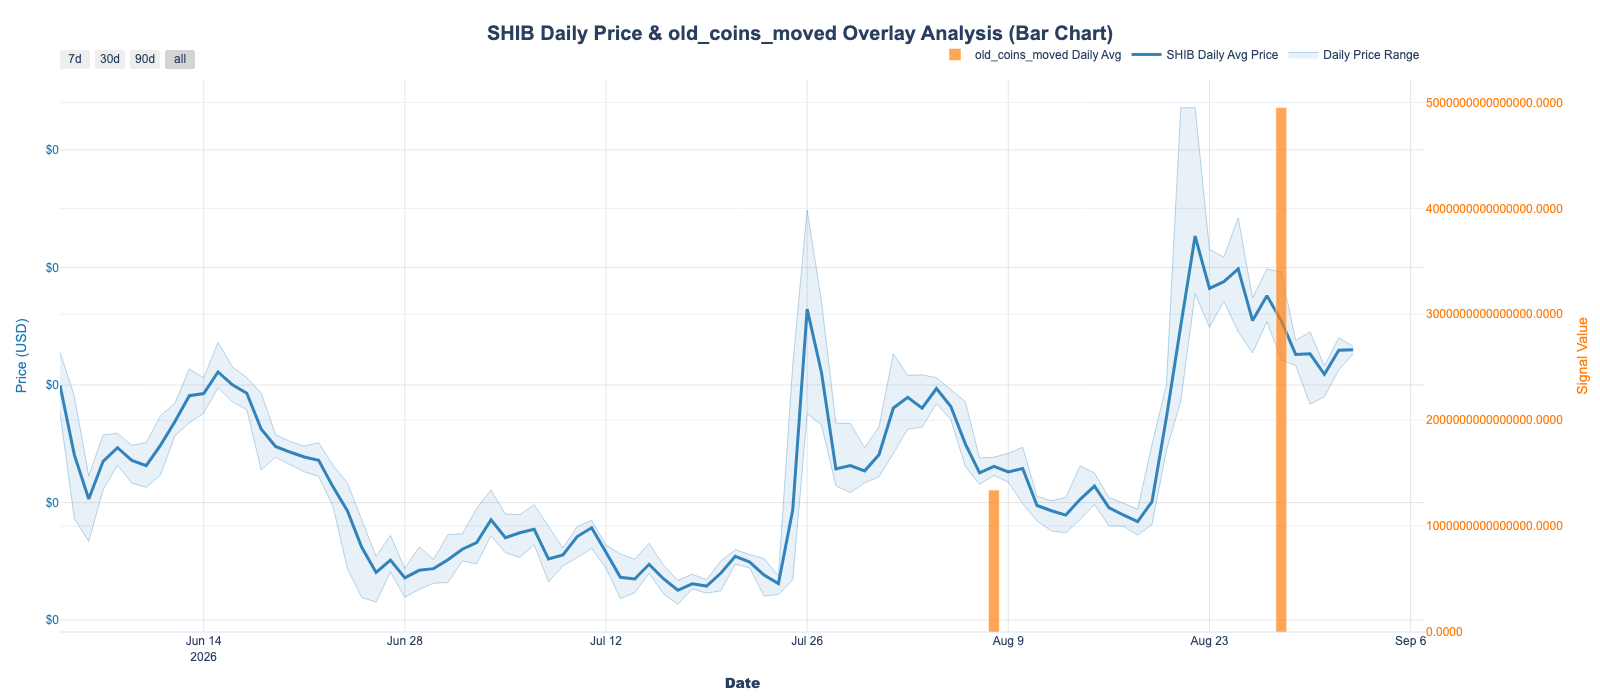
SHIB moved the oldest coins of the week. old_coins_moved recorded 6.93 times its trigger level: about 1.0% of circulating supply moved, untouched for an average of 865 days. That dormancy is the longest of any asset that triggered, ahead of Chainlink's 716 days and XRP's 542. The metric day was August 27, the same day the market topped, and SHIB has fallen 4.8% since.
No-shows this week: social_price_correlation and social_dev_score produced no eligible events.
Worth Watching
- Uniswap, UNI: whether volume holds near $1B a day.
- Solana, SOL: what BTC does, and whether SOL reappears in project trends.
- Ripple, XRP: whether another old_coins_moved trigger lands.
- hyperliquid_avg_funding_rate at -72.58, its most extreme reading in three weeks.
Full Trigger Table
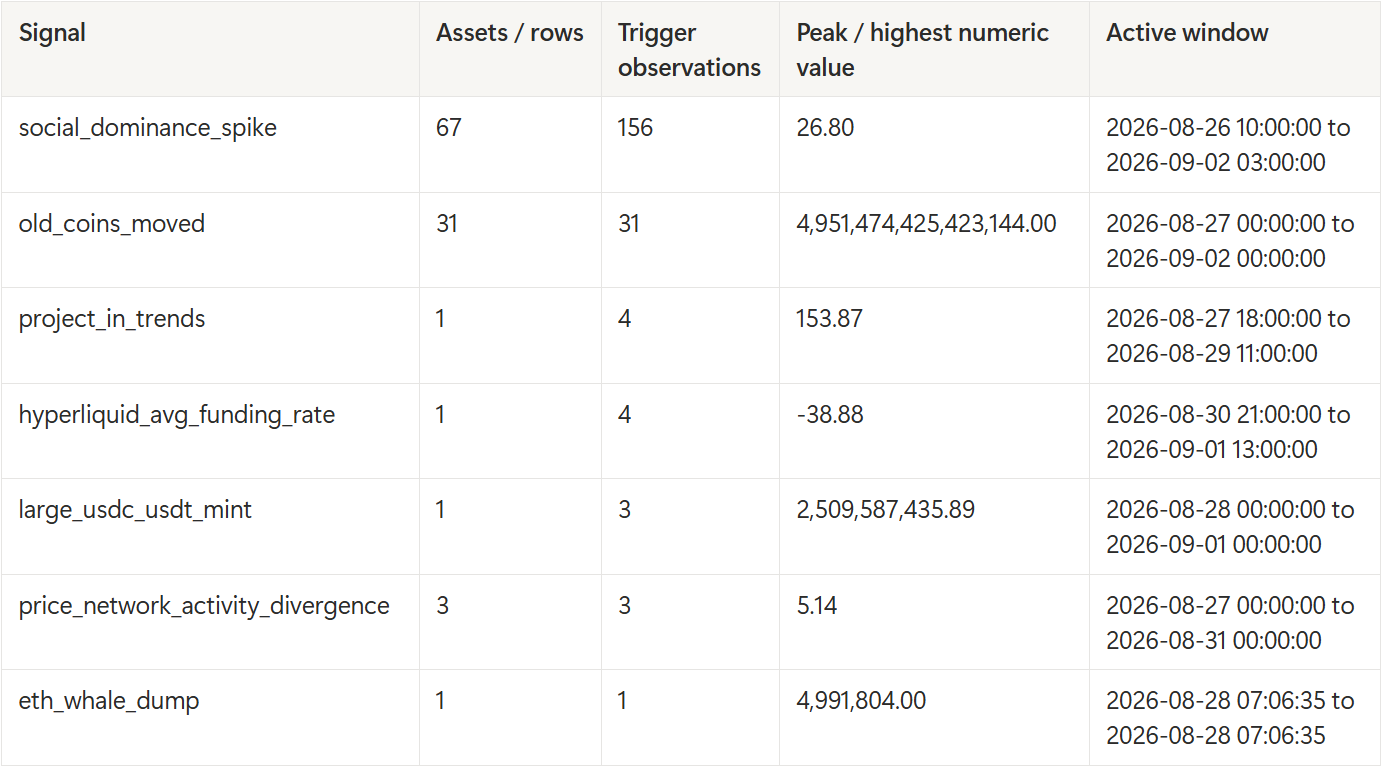
Between 2026-08-26 10:00 and 2026-09-02 03:00 UTC, 202 trigger observations fired across 7 of the 9 tracked anomaly types, spanning 105 signal-and-asset entries.
Market-cap filter: latest_marketcap_usd > $50M.
Anomalies We Track
- Network Activity & Price Divergence Anomaly — detects price surges that are not accompanied by a corresponding rise in network activity (real growth). Triggered only if price growth exceeds 3% on the same day, ensuring the alert is relevant for significant bullish moves.
- Project in Trends Anomaly — detects when a specific crypto token gains significant traction in online discussions, placing it among the top 10 most-mentioned words in crypto-related conversations.
- Old Coins Moved Anomaly — detects unusually large amount of long-dormant supply moving, measured against each asset’s own recent history. Triggers above 1.5 times that baseline. A trigger shows old coins moved, not that anyone sold them.
- Large USDC-USDT Mint Anomaly — detects daily combined $1 billion or larger minting events of USDC and USDT stablecoins on the Ethereum blockchain.
- Social Price Correlation Anomaly — detects whether social sentiment and price are behaving in an unusually aligned or unusually decoupled way. Currently runs on 1h X.com social data for BTC, ETH, SOL, DOGE, XRP, TRX, and ADA.
- Social Dominance Spike Anomaly — detects abnormal spikes in social dominance. Alerts when values exceed a statistical significance threshold of 3 standard deviations over 30 days.
- Social-Dev Score Anomaly — detects unusual activity compared to the recent 30-day history of social media metrics and development activity. The score is weighted 60/40 for social and dev activity.
- Hyperliquid Average Funding Rates Anomaly — detects when rates exceed predefined high/low thresholds of +40% and -20%, measured hourly.
- ETH Whale Dump Anomaly — detects potential large-scale ETH dumps by monitoring whale wallet behaviors. Uses a 500 ETH threshold and a 30-day holding period to distinguish normal trading from potential dump scenarios.
Thanks for reading this week’s Santiment Anomaly Report. For real-time anomaly alerts and the underlying data, head to Sanbase — and since the report is becoming its own newsletter soon, join the mailing list to get it straight to your inbox.
See you next week.
Anomalously yours,
Santiment
Disclaimer: Parts of this report were generated with AI and then quality checked and copy-edited by humans. It is for reference purposes only and is not intended as financial or investment advice. Always DYOR.